The Long Road to Convergence - Central and Eastern Europe Before and After 1990
Reviewing a suite of indicators - covering per-capita output, wages, income, and life expectancy - we find that the Central and Eastern European (CEE) region has shown substantial convergence to Western Europe since the early 1990s.
Across all indicators, the CEE region's countries closed, on average, almost half the gap with Western Europe's core (Germany) and rose from about one-third to two-thirds of this reference level since 1990. This is in contrast to the pre-1990 socialist era when CEE steadily fell behind Western and Southern Europe, especially from the mid-1970s. This post-1990 convergence performance of CEE is comparable to East Asia's over the same period and substantially stronger than that of comparable country groups in Latin America, Africa, or the non-EU former USSR.
The path toward Western Europe's income and especially productivity levels still remains long and may prove more difficult than this initial phase of convergence.
Table of contents
- Introduction
- Methods
2.1 Peer countries: convergence comparators
2.2 Benchmarks countries: convergence targets
2.3 Selected indicators
2.4 Periodisation - Results
3.1 GDP and GNI per capita
3.2 Labour productivity trends since 1990
3.3 Wages, earnings and income: trends since 1990
3.4 Life expectancy - Discussion
- Afterword
Introduction
Since the fall of communism, Central and Eastern Europe has undergone profound economic change. Most observers agree that incomes and output have moved closer to Western European levels, but there is far less agreement on how large this convergence was in total, and how it compares with other regions globally or with the region’s own pre-1990 trajectory.
This post examines whether the eleven Central and Eastern European (CEE) countries that joined the European Union since 2004 experienced meaningful economic convergence toward Western Europe since 1990 by global standards, and how that record compares with the pre-1990 period [1]. These countries, in order of population size, are: Poland, Romania, Czechia, Hungary, Bulgaria, Slovakia, Croatia, Slovenia, Lithuania, Latvia and Estonia; comprising a region with a combined population of approximately 102 million in 2024.
After 1945, most countries of Central and Eastern Europe became part of the Soviet sphere of influence and, from roughly the late 1940s, were governed as socialist one-party states aligned with Moscow. The countries of the former Yugoslavia were non-aligned and not occupied by the USSR, but nonetheless had socialist economic systems and were not part of the Western alliance.
After 1989-91, Soviet political and military dominance in the region ended, and these countries implemented large-scale privatisation and a transition from socialist systems based on state ownership and planning to market economies based primarily on private owneship.
Moreover, all of them joined the Western alliance, joining both NATO (between 1999 and 2004) and the EU: eight countries joined in 2004, Romania and Bulgaria in 2007, Croatia in 2013.
Historically, in terms of economic development, CEE countries typically occupied a middle position between the Western core of Western Europe and North America (and other Western offshoots) and the low- and middle-income countries of Asia, Africa and (partly) Latin America.
Their post-1990 trajectory therefore represents an interesting test case for the success - or failure - of economic convergence through market-based integration for a number of reasons.
First, after roughly 40 years under a socialist economic system [2] they transitioned to a private, capitalist, market-based economy, similar to that of Western countries.
Second, after 1990 they opened their markets to international (mostly European) investment and trade, joining the European Common Market from the mid-2000s which meant a globally unique level of integration with high income countries (HICs).
This makes CEE a unique test case for testing if market integration can generate economic convergence.
We can therefore analyse the success/failure of convergence both across time periods and by comparing with other regions:
| Socialism: 1950* to 1989 | Capitalism: after 1990 | |
|---|---|---|
| Peer group | Did CEE countries level with, pull away or fall behind comparable (peer) regions of the World under socialism? | Have CEE countries levelled with, pulled away or fallen behind comparable (peer) regions of the World since the introduction of capitalism? |
| Benchmark group | Did CEE countries show convergence to the Western core under socialism? | Have CEE countries been converging to the Western core since the introduction of capitalism? |
Table 1: Assessing convergence by era and region. (*for the USSR analyse from 1926 as well)
There are many claims - and strong emotions - about the last 35 years of the CEE region, and if it should be considered a success, a failure or something in between. I try to present an analysis below that that is systematic and unbiased. I will use several types of macro-economic measures that characterise overall economic growth, productivity, but also labour and household income as well as life expectancy. I will use data covering the entire period and all relevant geographies. To avoid cherry-picking of data, baselines or benchmarks of comparison, I also explicitly discuss the assumptions with regard to what regions/countries we compare CEE to, how to define the individual eras (start and end) and what units we use. I hope to provide a somewhat coarse-grained, but comprehensive, picture of the economic convergence of CEE since 1990, based on national averages or medians, both in a global comparative perspective and relative to the socialist era. In addition, the R code to generate the plots, as well as all data files are available here. I also attach to each plot the specific data used in that figure.
Methods
Peer countries: convergence comparators
As outlined in Table 1, to make a meaningful comparison we need to compare CEE to other regions/countries in two ways. First, we want to see how the economic performance of CEE compares to other, similar economies, which I will call the peer countries. To include countries in the peer group I used the following criteria:
- GDP per capita (constant 2011 USD, PPP) in either 1989 or 2024 fell within a factor of two of the CEE weighted average (ie. at least half as high as the CEE average and no more than twice as high)
- Population was at least two million in 1989 and 2024, to eliminate the distorting effects of very small states.
The above criteria include several Western European countries, as well as Japan and New Zealand. I excluded these, as they fall into the benchmark group (see next section), the countries that the convergence economies have aimed to catch up to. I also excluded rich oil states (Kuwait, Oman, Saudi Arabia), as these form a group of their own, and they also belonged to the wealthy capitalist core in 1990 already. Furthermore, I excluded Iraq and Lybia, two countries devastated by war, because their economic data reflects large exogenous shocks; including them would only exaggerate the convergence performance of all other countries.
The above criteria yield only two African peer countries (Algeria and South Africa). There a few North African countries slightly below the income threshold: Egypt, Morocco and Tunisia. I included these three countries in the analysis to have a picture of African convergence performance as well.
Combining all criteria above, we get 36 peer countries, so we will analyse in total the convergence performance of 47 countries. 11 of these are the ex-socialist CEE countries themselves, 7 are ex-USSR and former Yugoslav states, and there are 4 Southern European, 12 Latin American, 5 African and 6 Asian countries:
| Region | Countries |
|---|---|
| CEE | Hungary (HU), Poland (PL), Czechia (CZ), Slovakia (SK), Slovenia (SI), Estonia (EE), Latvia (LV), Lithuania (LT), Croatia (HR), Romania (RO), Bulgaria (BG) |
| Southern Europe (S_EUR4) | Greece (GR), Italy (IT), Portugal (PT), Spain (ES) |
| ex-USSR/Balkans | Azerbaijan (AZ), Belarus (BY), Georgia (GE), Kazakhstan (KZ), Moldova (MD), North Macedonia (MK), Russia (RU), Serbia (RS), Ukraine (UA) |
| Latin America (LAT_AM) | Argentina (AR), Brazil (BR), Chile (CL), Colombia (CO), Costa Rica (CR), Dominican Republic (DO), Ecuador (EC), Jamaica (JM), Mexico (MX), Panama (PA), Paraguay (PY), Uruguay (UY) |
| Africa | Algeria (DZ), Egypt (EG), Morocco (MA), South Africa (ZA), Tunisia (TN) |
| Asia | China (CN), Iran (IR), Israel (IL), Malaysia (MY), South Korea (KR), Thailand (TH) |
Table 2: Peer countries by region (abbreviations and country codes)
Benchmarks countries: convergence targets
In the second type of comparison, we want to assess whether the CEE countries and their peers exhibited meaningful economic convergence to the wealthy core of the world economy. To do this, we compare the growth performance of the convergence economies (CEE and peers) to a set of reference countries, which I will call the benchmark countries.
The first benchmark defined is Germany which seems an appropriate benchmark for multiple reasons. First, it is the largest Western European economy and the one that CEE countries are most connected to by trade, investment and migration. Second, it is a country also ravaged by WWII, so it started rebuilding and growing from a low basis after 1945, similarly to CEE. This is in contrast to the US or the UK that suffered no comparable damages in the war and were also more developed even prior to WWII, as well as having some geographical advantages that are unique, so they seem less appropriate to use as benchmarks for CEE. Third, Germany would likely be the most common reference point among the population in CEE; in this sense, it also serves as an aspirational benchmark. As a second, broader benchmark of convergence to the wealthy core I use the weighted average of the G7 group.
Besides expressing the convergence economies’ performance as a percentage of the core’s and interpreting the resulting trends, I also use the population-weighted average of Southern Europe, Latin American and the world as benchmarks in several of the plots below. Therefore the S_EUR4 and LAT_AM groups are used both as peer groups and as benchmarks, to inform the assessment of the CEE convergence performance. Expressing the CEE performance as a percentage of S_EUR4 and LAT_AM shows if CEE was catching up or falling behind (or perhaps remaining stable) relative to comparable regions.
Selected indicators
I selected a broad set of socio-economic indicators to characterise the economic development of the countries analysed. This includes the most well-known and broadest output indicators, narrower labour productivity measures that drive the latter, but also wages, earnings and broader household income measures, to gauge the evolution of living standards. Finally, I also analyse life expectancy as the broadest metric of general wellbeing.
For variables expressed in monetary terms, I used measures that adjust for price differences across countries and, where available, are expressed in real (constant rather than nominal) terms over time. To remove the effect of inflation, I used time series from the World Bank, the OECD and Penn World Tables that use constant dollars tied to a given reference year, typically 2011 or 2021. To adjust for differences in price levels across countries, I used data expressed in purchasing power parity (PPP) or purchasing power standards (PPS: the unit used by Eurostat), rather than nominal USD or euros. Eurostat earnings and income data are expressed in purchasing power standards (PPS) that adjust for cross-country price differences and are mainly designed for cross-country comparisons. PPS are anchored to the EU price structure, rather than to domestic CPI, so it is not a nominal measure, but reflects a mixture of real income growth and price convergence within the EU. As a result, interpreting PPS time trends in absolute terms is less straightforward than for constant-price measures. However, analysing PPS levels over time relative to a benchmark country (e.g. Germany) is an appropriate basis for assessing convergence. For life expectancy the unit is simply years. Let us now review the indicators used.
High-level output measures:
- GDP/capita:
- long-term GDP/capita series from Penn World tables, constant 2011 international USD (PPP)
- GDP per capita since 1990 World Bank, constant 2021 international USD (PPP)
- GNI/capita: World Bank, constant 2021 international USD (PPP)
Labour productivity:
- GDP per person employed: OECD data, processed by OurWorldInData. Constant 2021 international USD (PPP).
- GDP per hour worked: Penn World Tables data, processed by OurWorldInData. constant 2021 international USD (PPP; multiple benchmark method). There is a nearly identical dataset by the OECD.
Earnings and income:
- annual average wages: constant 2024 US dollars, PPP converted. OECD data.
- median hourly earnings: Eurostat data. Unit: Purchasing power standards (PPS). Adjusted for cross-country price differences and EU-wide price changes.
- median equivalised net income: Eurostat data. Unit: Purchasing power standards (PPS). Adjusted for cross-country price differences and EU-wide price changes.
Finally, we also collected life expectancy data:
- period life expectancy: the number of years the average person born in a certain year would live if they experienced the same chances of dying at each age as people did that year. Source: United Nations World Population Prospects (2024), downloaded from Our World in Data
Periodisation
When making comparisons over time, results can be distorted - intentionally or not - by choosing baselines that exaggerate or understate changes. For example, starting from a trough can make relative increases appear larger. For this reason, I explicitly discuss how start and end years are selected and how baselines are defined.
When analysing the socialist period after WWII, the analysis starts from 1950, for a number of reasons.
For several countries, 1950 is the first post-WWII data point available.
Moreover, the 1945-1949 period reflects post-war reconstruction from a very low base, not just for CEE but also the main benchmark country (Germany), and cannot be considered a reliable measure of economic performance.
Finally, full-scale socialist systems were only implemented in CEE (except the Baltics) from around 1948. Therefore 1950 seems an appropriate starting point for post-war comparisons across countries.
When periodising the socialist era further, I divided it into an ‘early’ and ‘late’ period. For economic variables I used 1973 or 1975 as the dividing year between the two, because this is when most economic indicators start to stall in the socialist bloc. For life expectancy the upward trend ends around 1965, so I used that as the dividing point.
In Figures 3 and 4 I examined relative changes in GDP per capita from a chosen baseline over the long-term, including the pre-WWII period, to assess how Soviet economic growth compares globally. In this case it was necessary to pick baseline and end-of-period years.
Before WWII, the available window for meaningful economic comparison is relatively narrow. Russia was devastated by civil war in the early 1920s, and it was only by 1926 that per-capita output returned to its pre-WWI (1913) level. Up to that point, we are essentially observing post-war reconstruction; only afterward can we discern the effects of socialist industrialisation, which began in earnest in 1928.
We need to be careful with baselines and end points here, as there is high volatility in the data due to wars: WWI, the civil war (early 1920s) and WWII.
I see two reasonable baseline years in this case. We can start with the last year before WWI (1913), so there can be no issue of starting from an artificially low trough due to WWI and the civil war. Alternatively, we can take 1926 as a baseline, when Russia reached its pre-civil war output level.
While this (1926) seems acceptable, it should be said that this level was extremely low by international standards ($1200 in 2011 intUSD): about 2x lower than Mexico, 3x lower than Poland and 5x lower than Argentina.
If it had not been for WWI and the civil war, Russia would have presumably been at a higher level in 1926, so the 1926 baseline is very low largely due to exogenous reasons. It is likely that Russia - a country with huge population, area and natural resources - would have seen strong growth under any regime following almost 15 years of economic devastation, so some of the strong rebound after could be more a general ‘catchup potential’ effect rather than specifically due to Stalinist modernisation.
Nevertheless, I used 1926 which seems an acceptable choice, though, if anything, makes Soviet growth look stronger than starting from a later year.
For the end point of the first period of USSR history - prior to the post-war boom - I identified three plausible years: (1) 1939, marking the start of World War II; (2) 1950, corresponding to the onset of the post-war boom in much of the world; and (3) 1955, reflecting the fact that several Asian economies did not return to their pre-war output levels until the mid-to-late 1950s.
This last end point allows for a comparison of Soviet growth from 1913/1926 up to the start of the post-war boom with Asia as well.
Using 1989 as the end year of the entire socialist era is a clear and clean choice, as major economic changes began that year, even though the USSR was formally dissolved only at the end of 1991.
In a sense, this is charitable to the socialist system’s record, since the economies were already stagnant or in recession in 1990-1991 and those years could arguably still be counted as part of the socialist era. However, drawing the line at 1989 is analytically cleaner, which is what we will use.
One remaining question is how to define the transition period from socialism to capitalism, and which year to use as the starting point for post-socialist convergence. After 1989, most former socialist countries experienced a recession - milder in CEE and more severe in the former USSR and in Yugoslavia where it also coincided with war (for some countries).
To assess convergence following economic restructuring, one could either use the start of the transition period (1990) or choose a few years later, for example at the trough of the recession, arguing that it is from that point that the new market-based structures began to have an effect.
This latter choice could be justified by the fact that in the CEE region, the recession lasted only a few years, with economic growth mostly resuming by 1992 (from 1994 in the Baltics and around 1998 in Bulgaria).
The rapid rebound suggests that the recession reflected the unavoidable closure of defunct industries inherited from socialism.
However, there is a debate about whether a less drastic restructuring might have been possible, and whether some socialist industries could have been salvaged and if the severity of the recession did not partly reflect the choices of the restructuring.
To remain agnostic on this issue and avoid any bias from ‘baseline cherry-picking’, for the main headline indicators of post-socialist convergence (Figures 5, 6, 7, and 8), I used 1990 - instead of the trough of the transition recession - as the baseline year, thereby including the transition recession within the post-socialist period.
On some plots however I separate the transition period to show shifts separately for each period. In Figure 2, where I analyse GDP per capita trends for both pre- and post-1990, I show the transition as a separate period, defined as 1989-1992.
Similarly, the transition period is shown separately for life expectancy (Figure 13), defined as 1989-1995, because it was around 1995 that life expectancy started to increase again in ex-USSR countries, although in CEE this had started from 1991-1993 already.
For several variables (output per hour of work, annual average wages, median earnings and household income) data are only available from 1995 or even later. In these cases I used the earliest available time points as start years.
Results
GDP and GNI per capita
GDP per capita trends: CEE before and after 1990
Figure 1 shows the historical trajectory of GDP per capita (constant 2011 USD, PPP), from 1950 to 2022, expressed as a percentage of the same indicator for Germany, the G7, Southern Europe and Latin America (switch between these by clicking on the buttons).
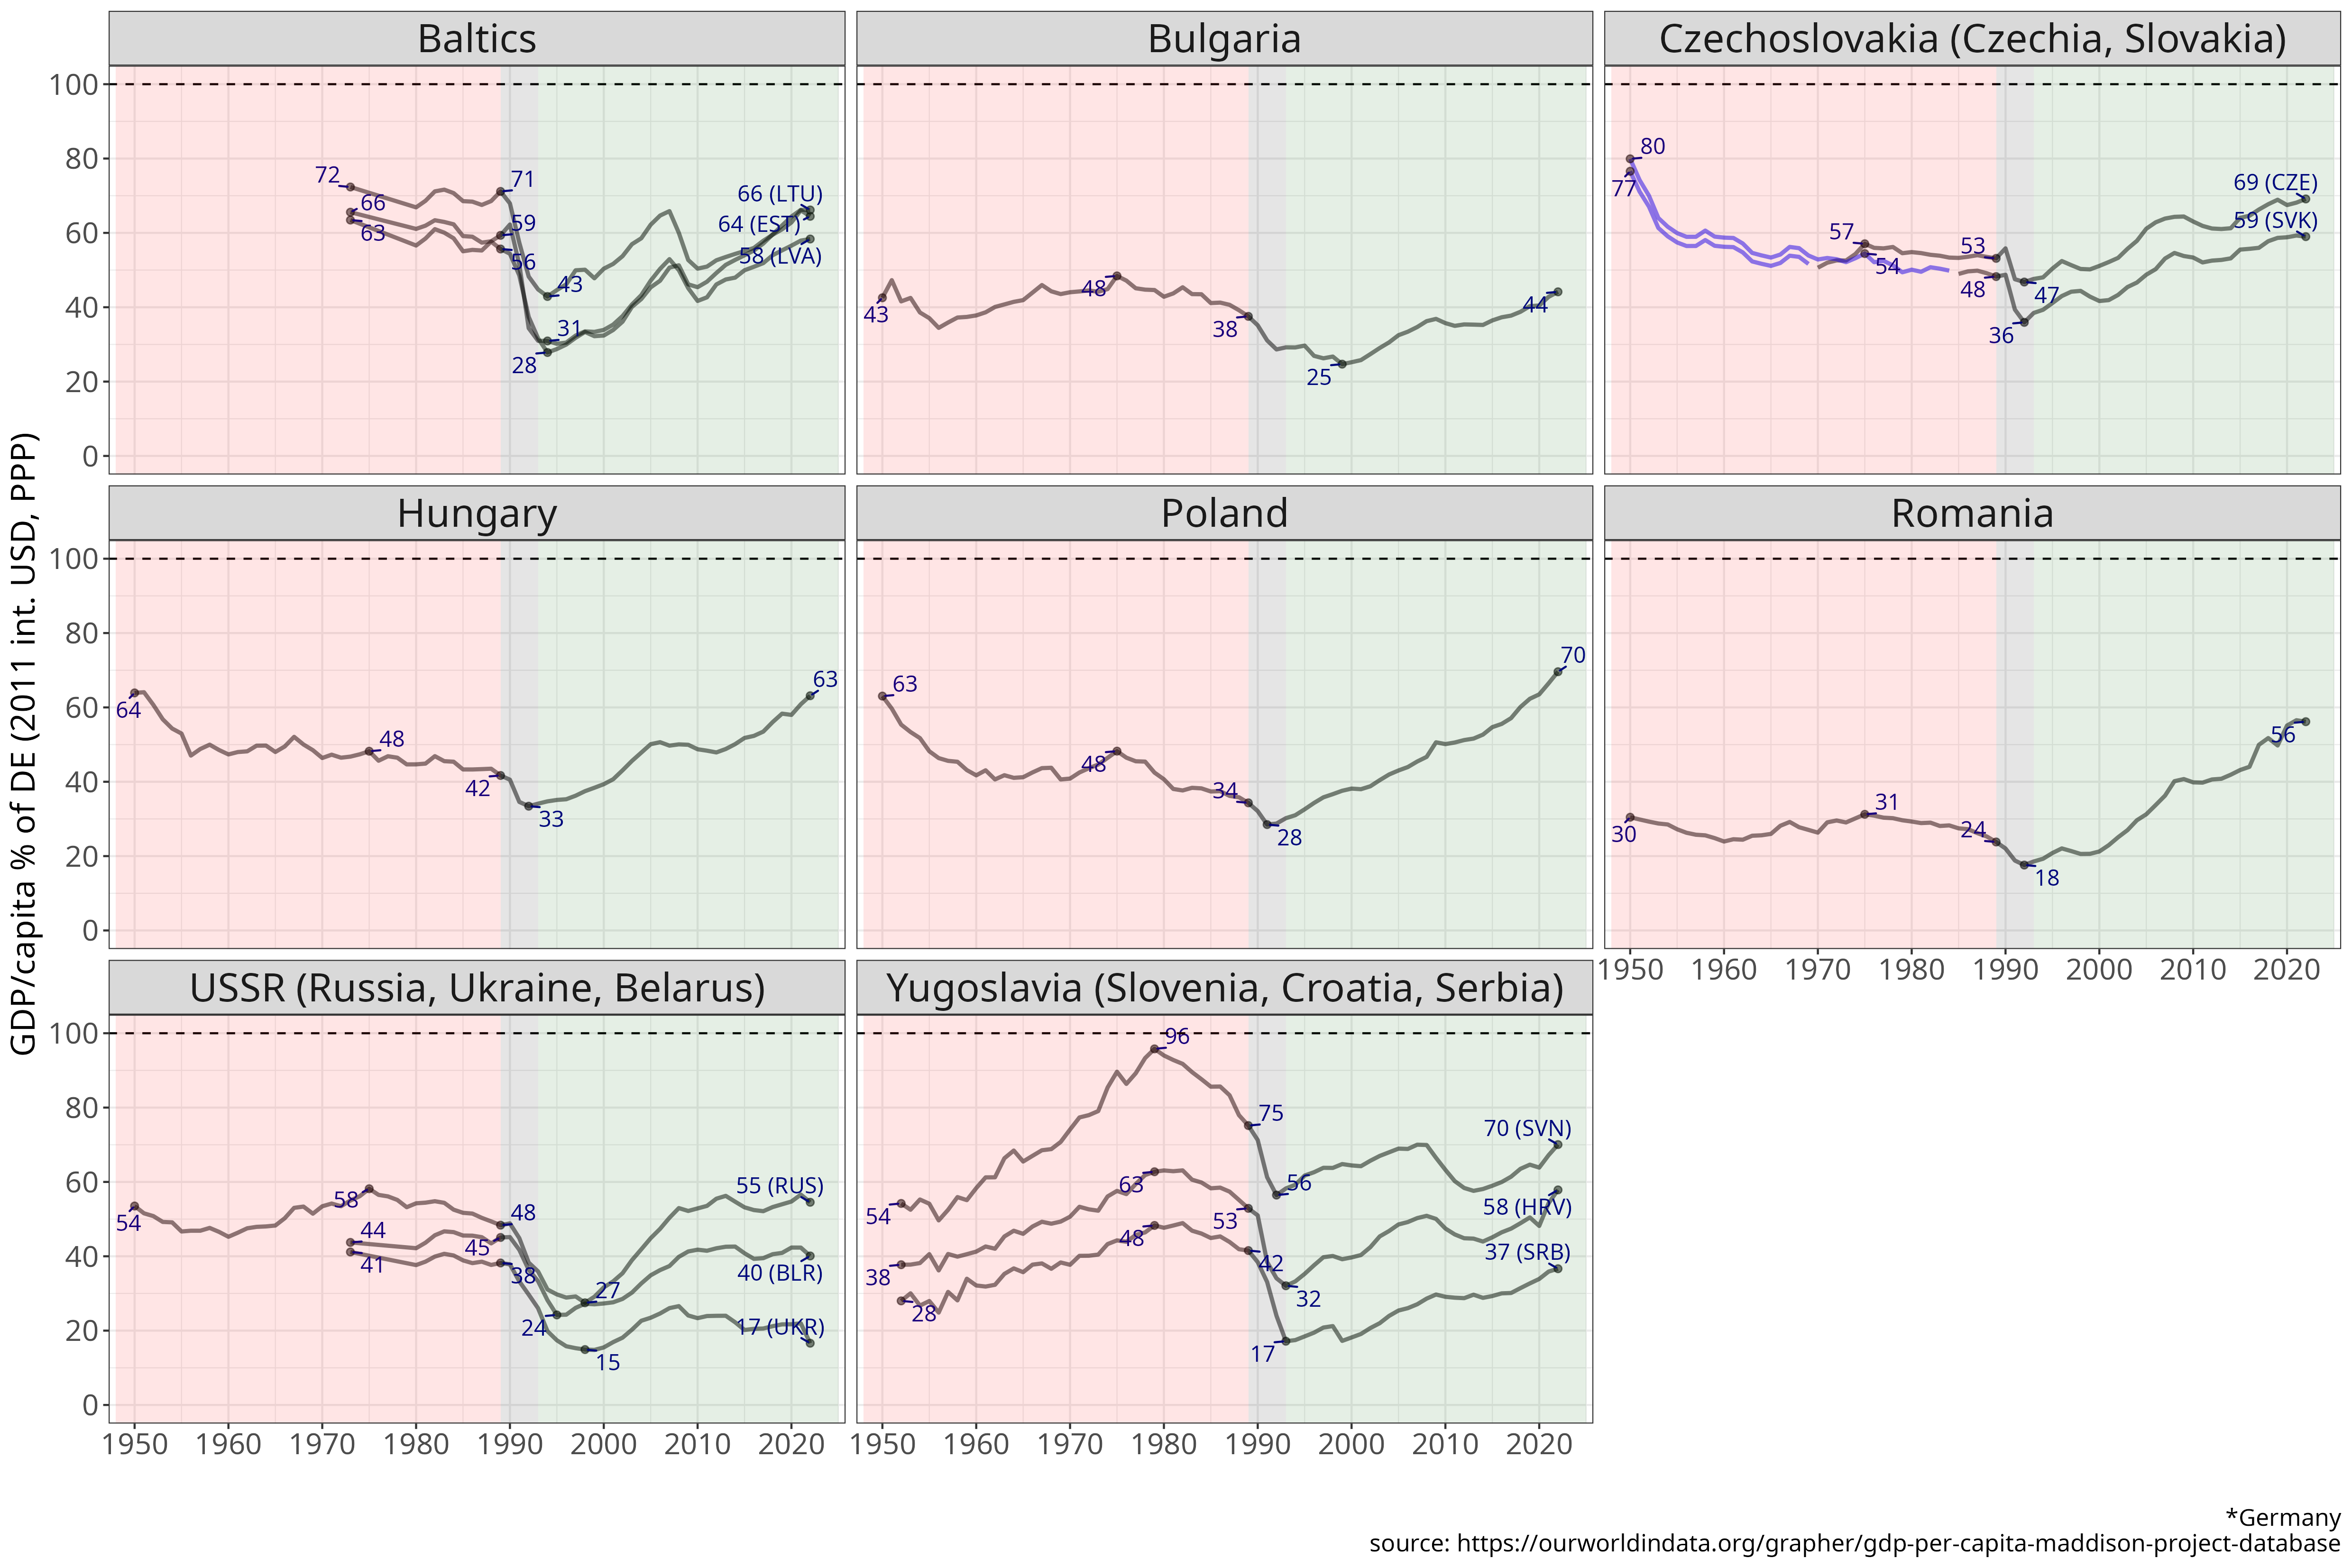
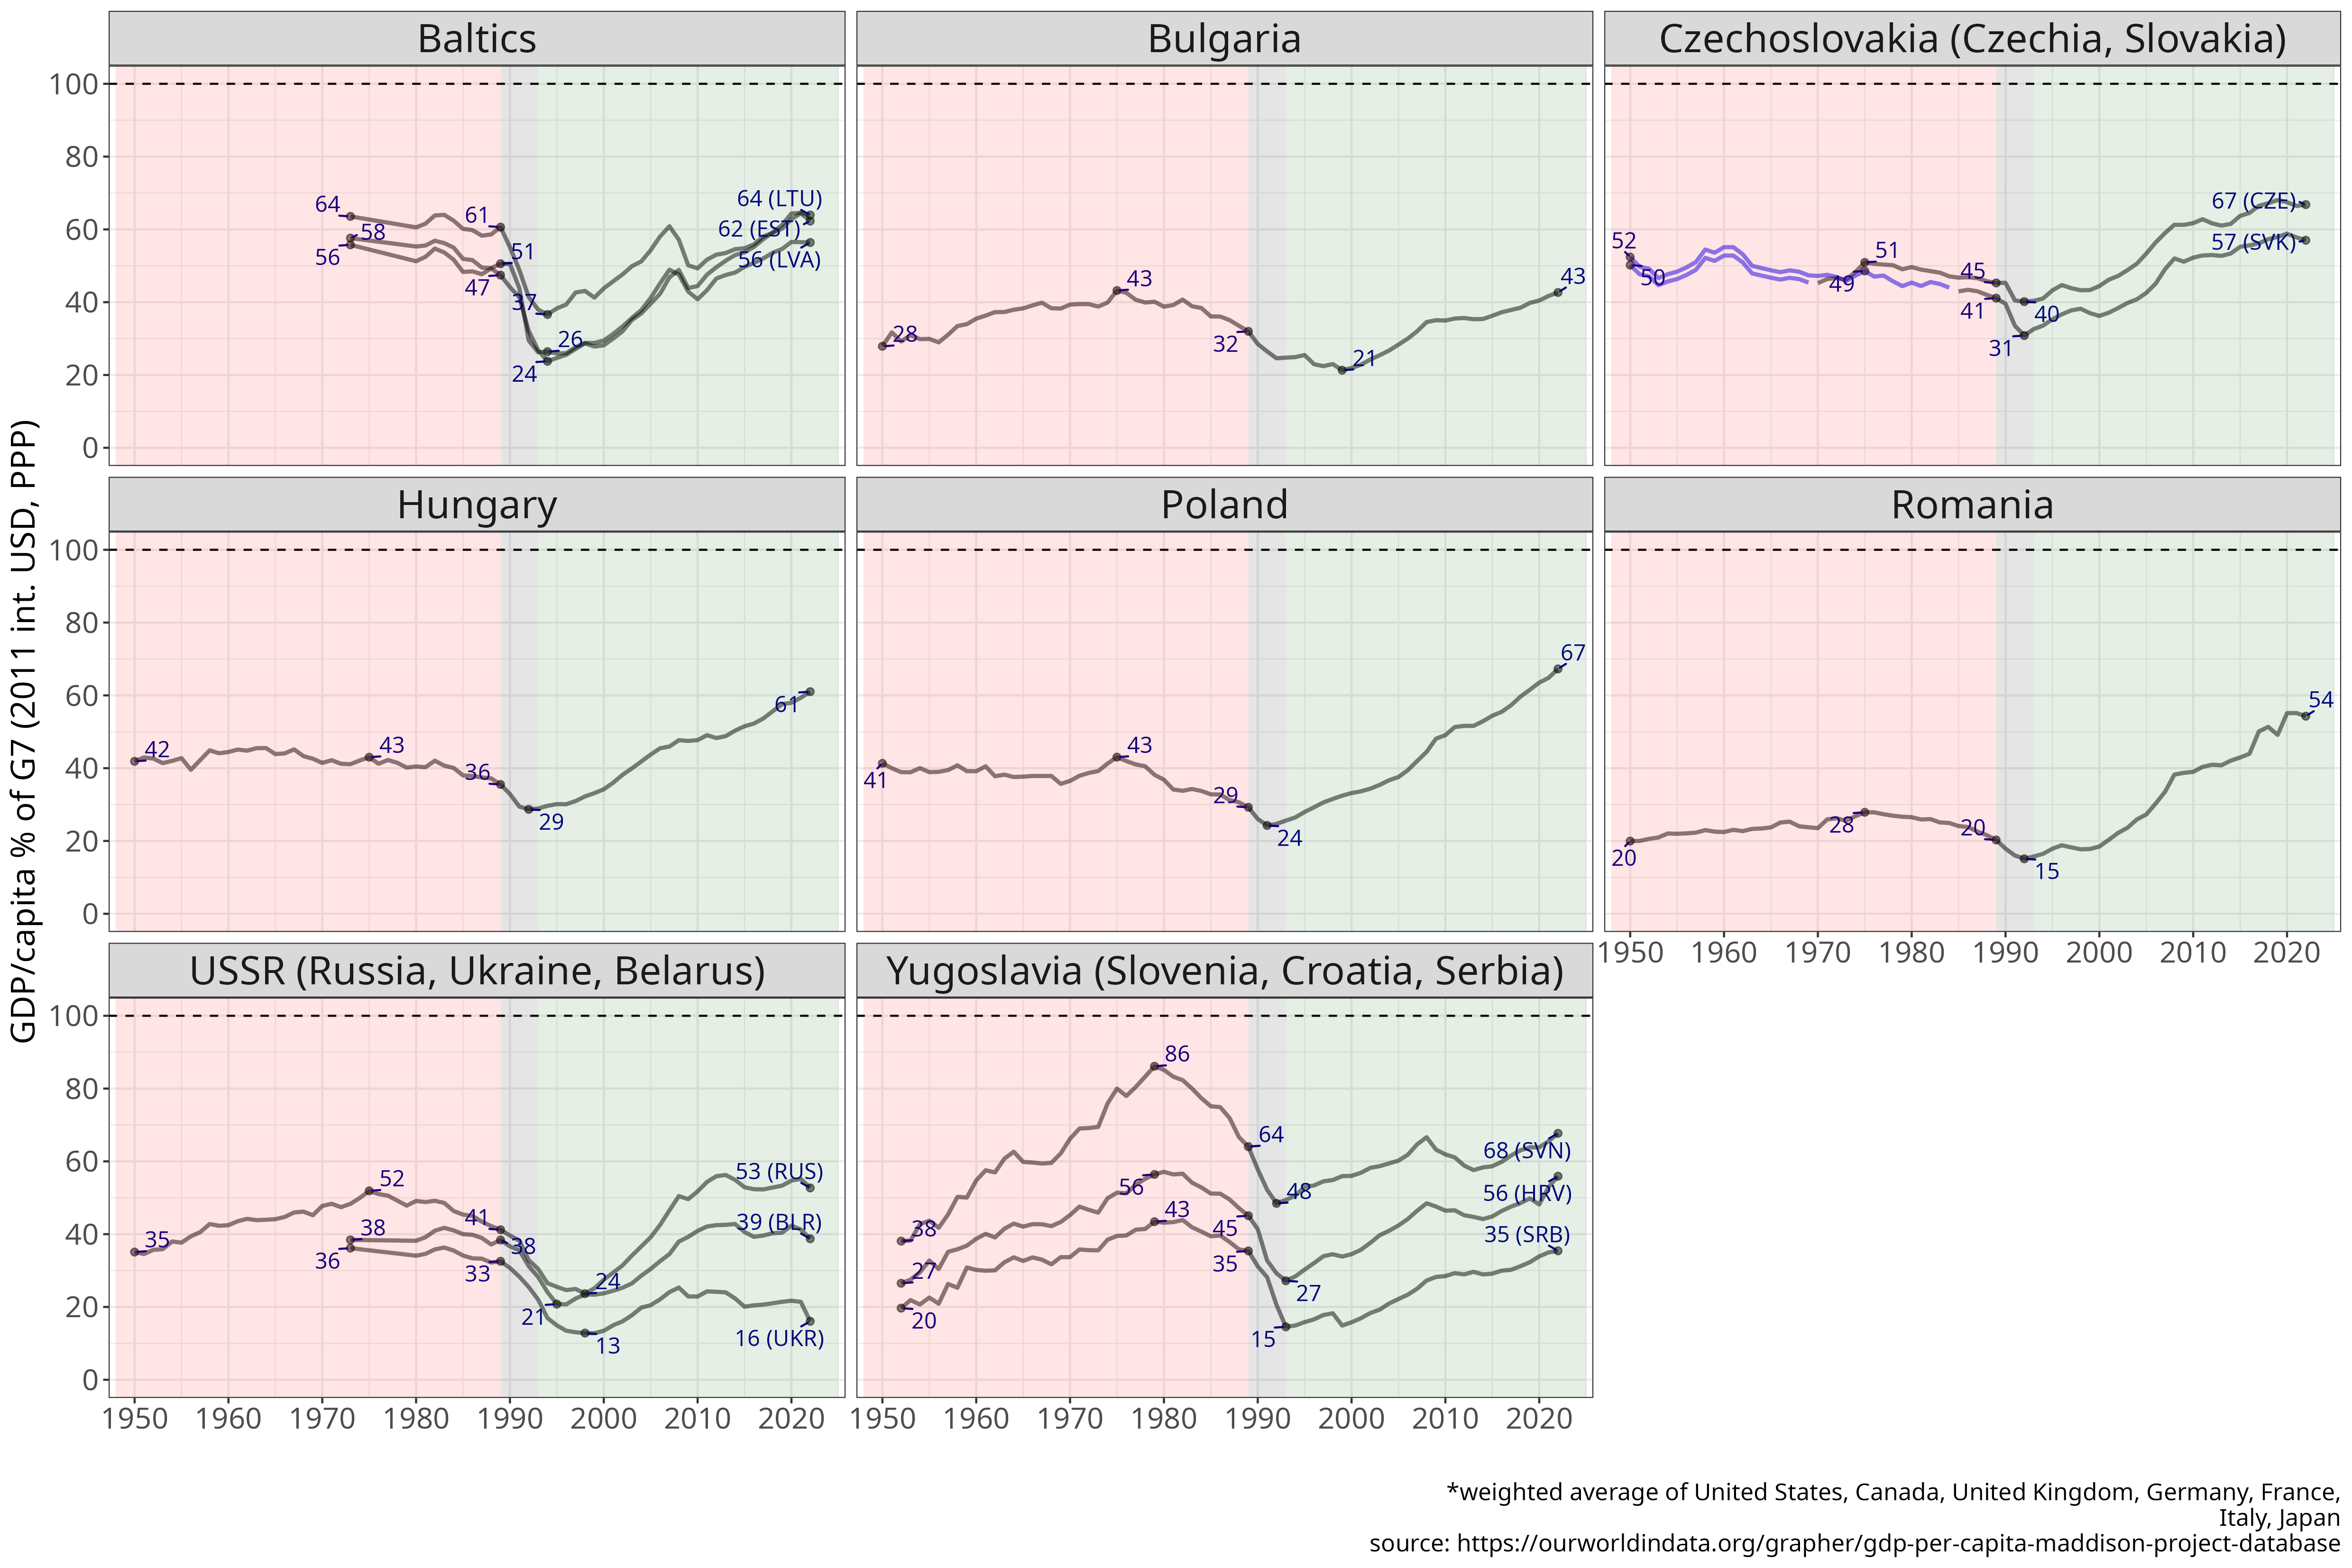
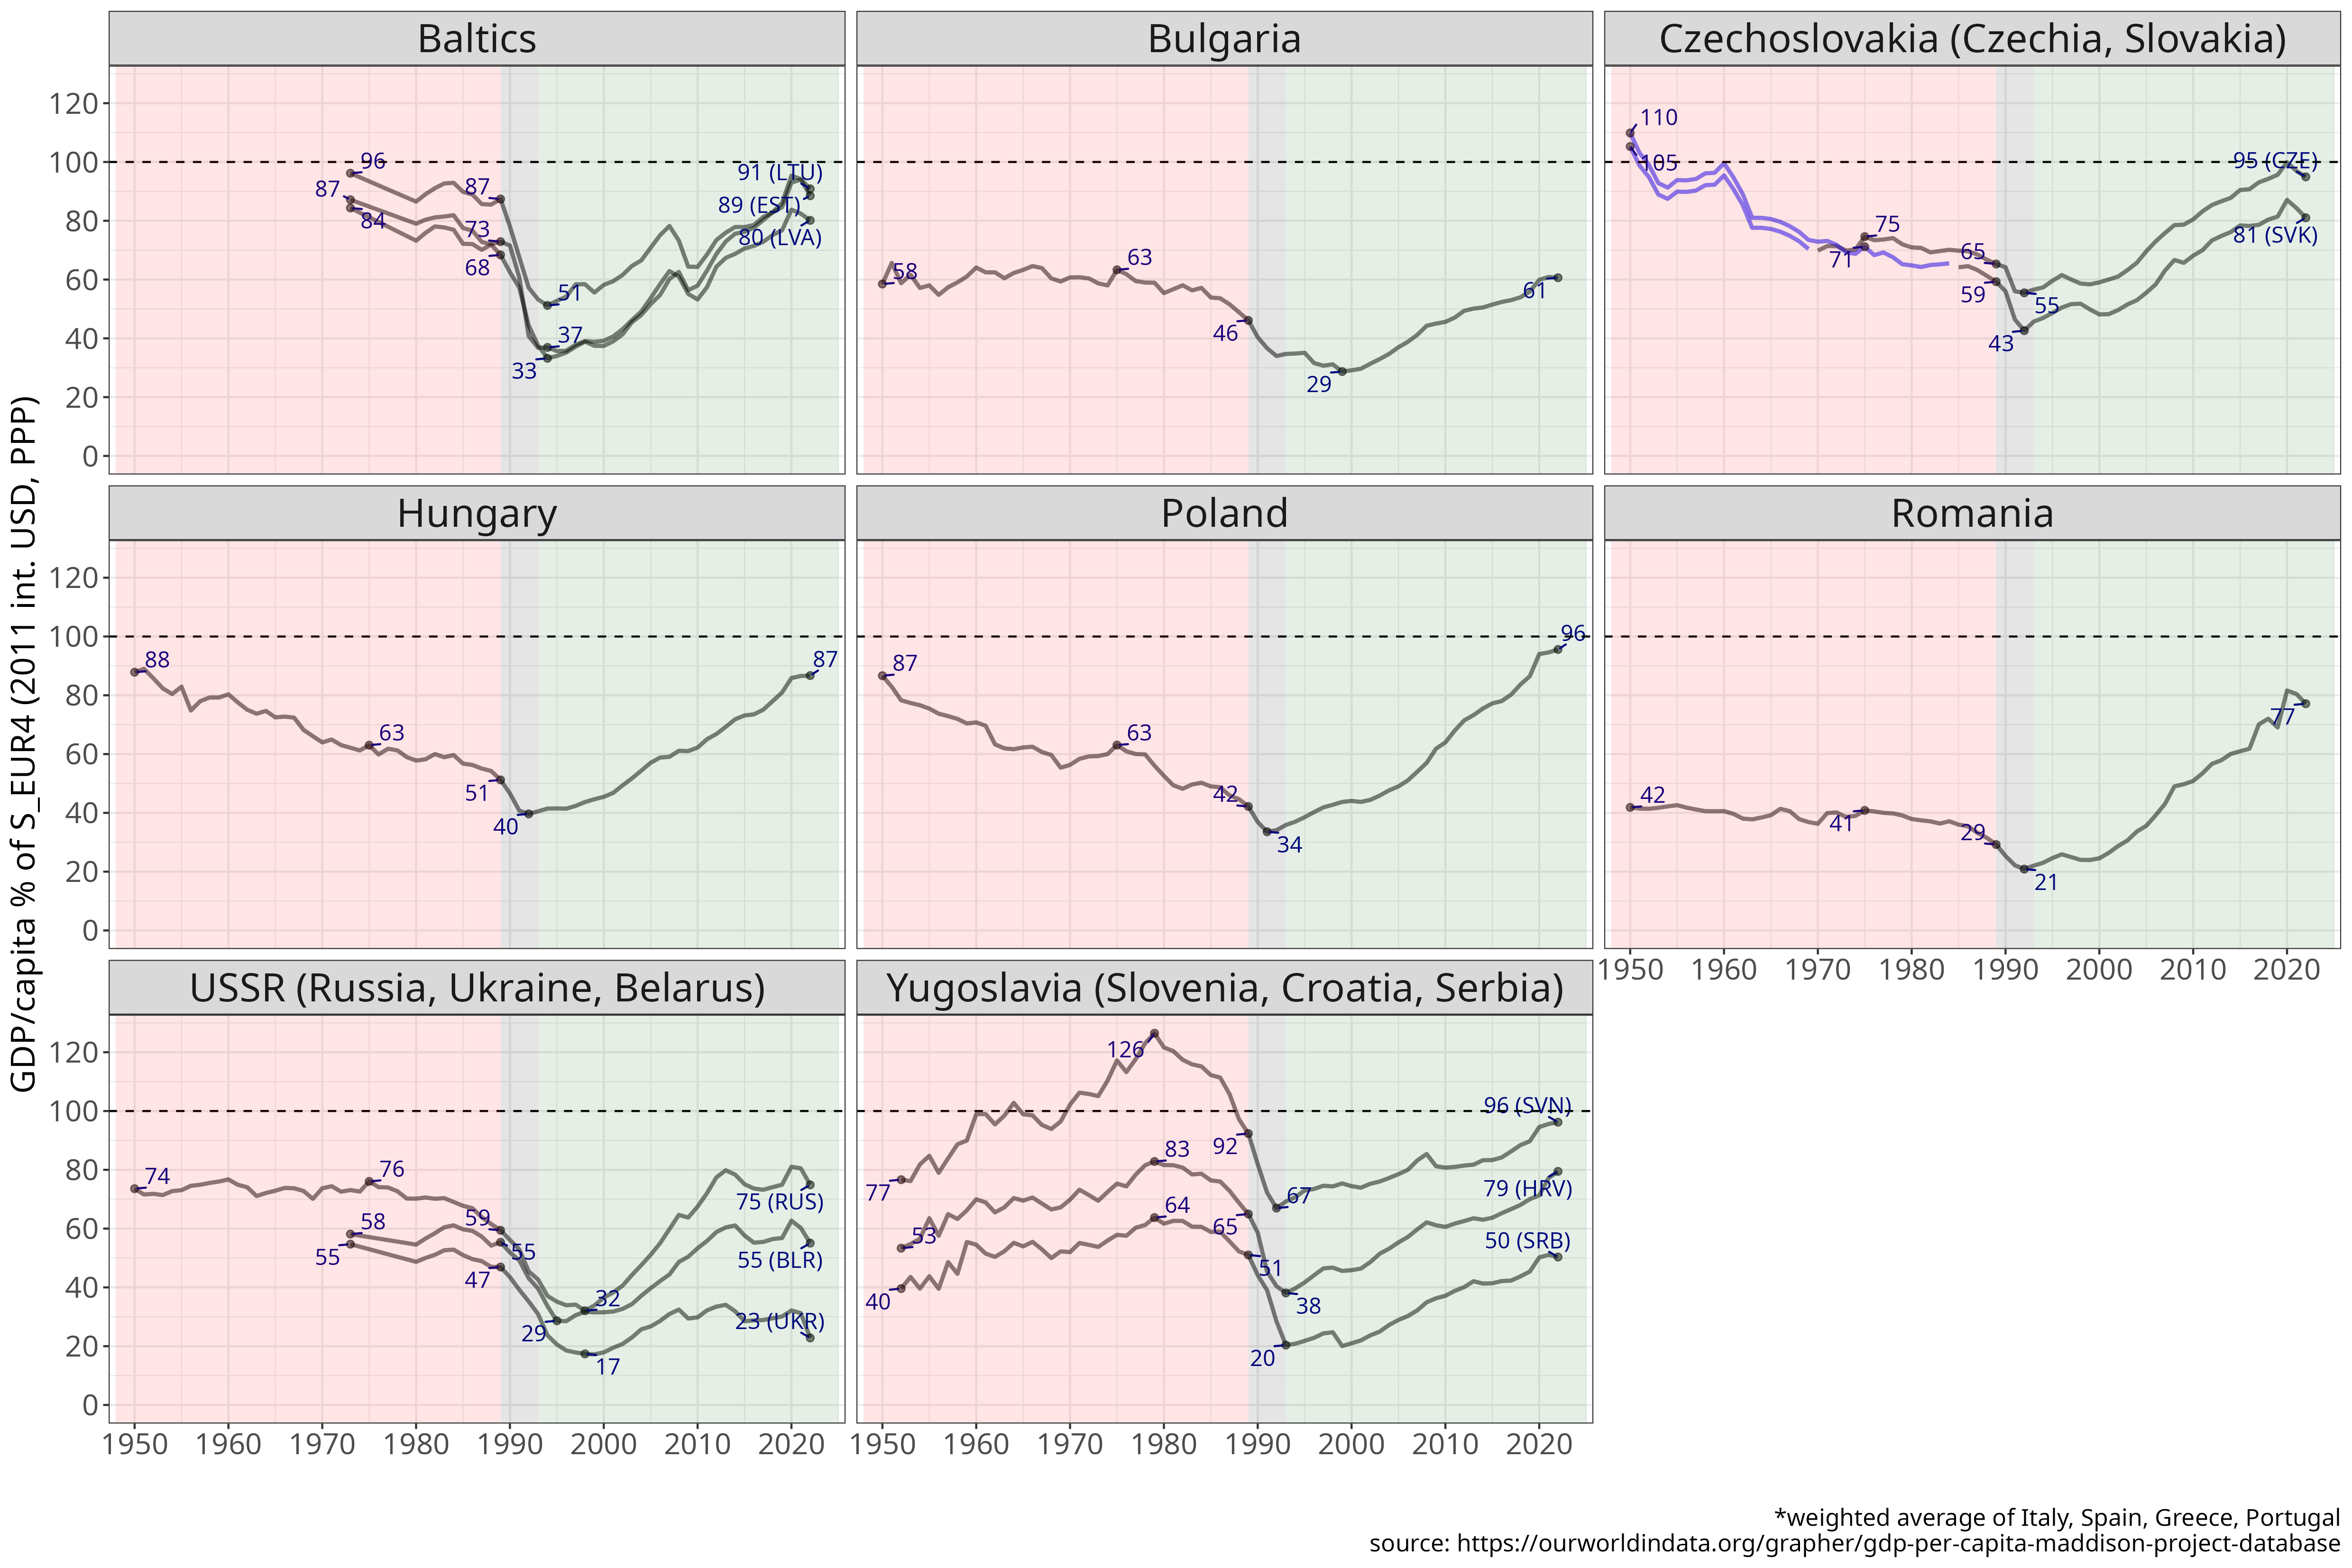
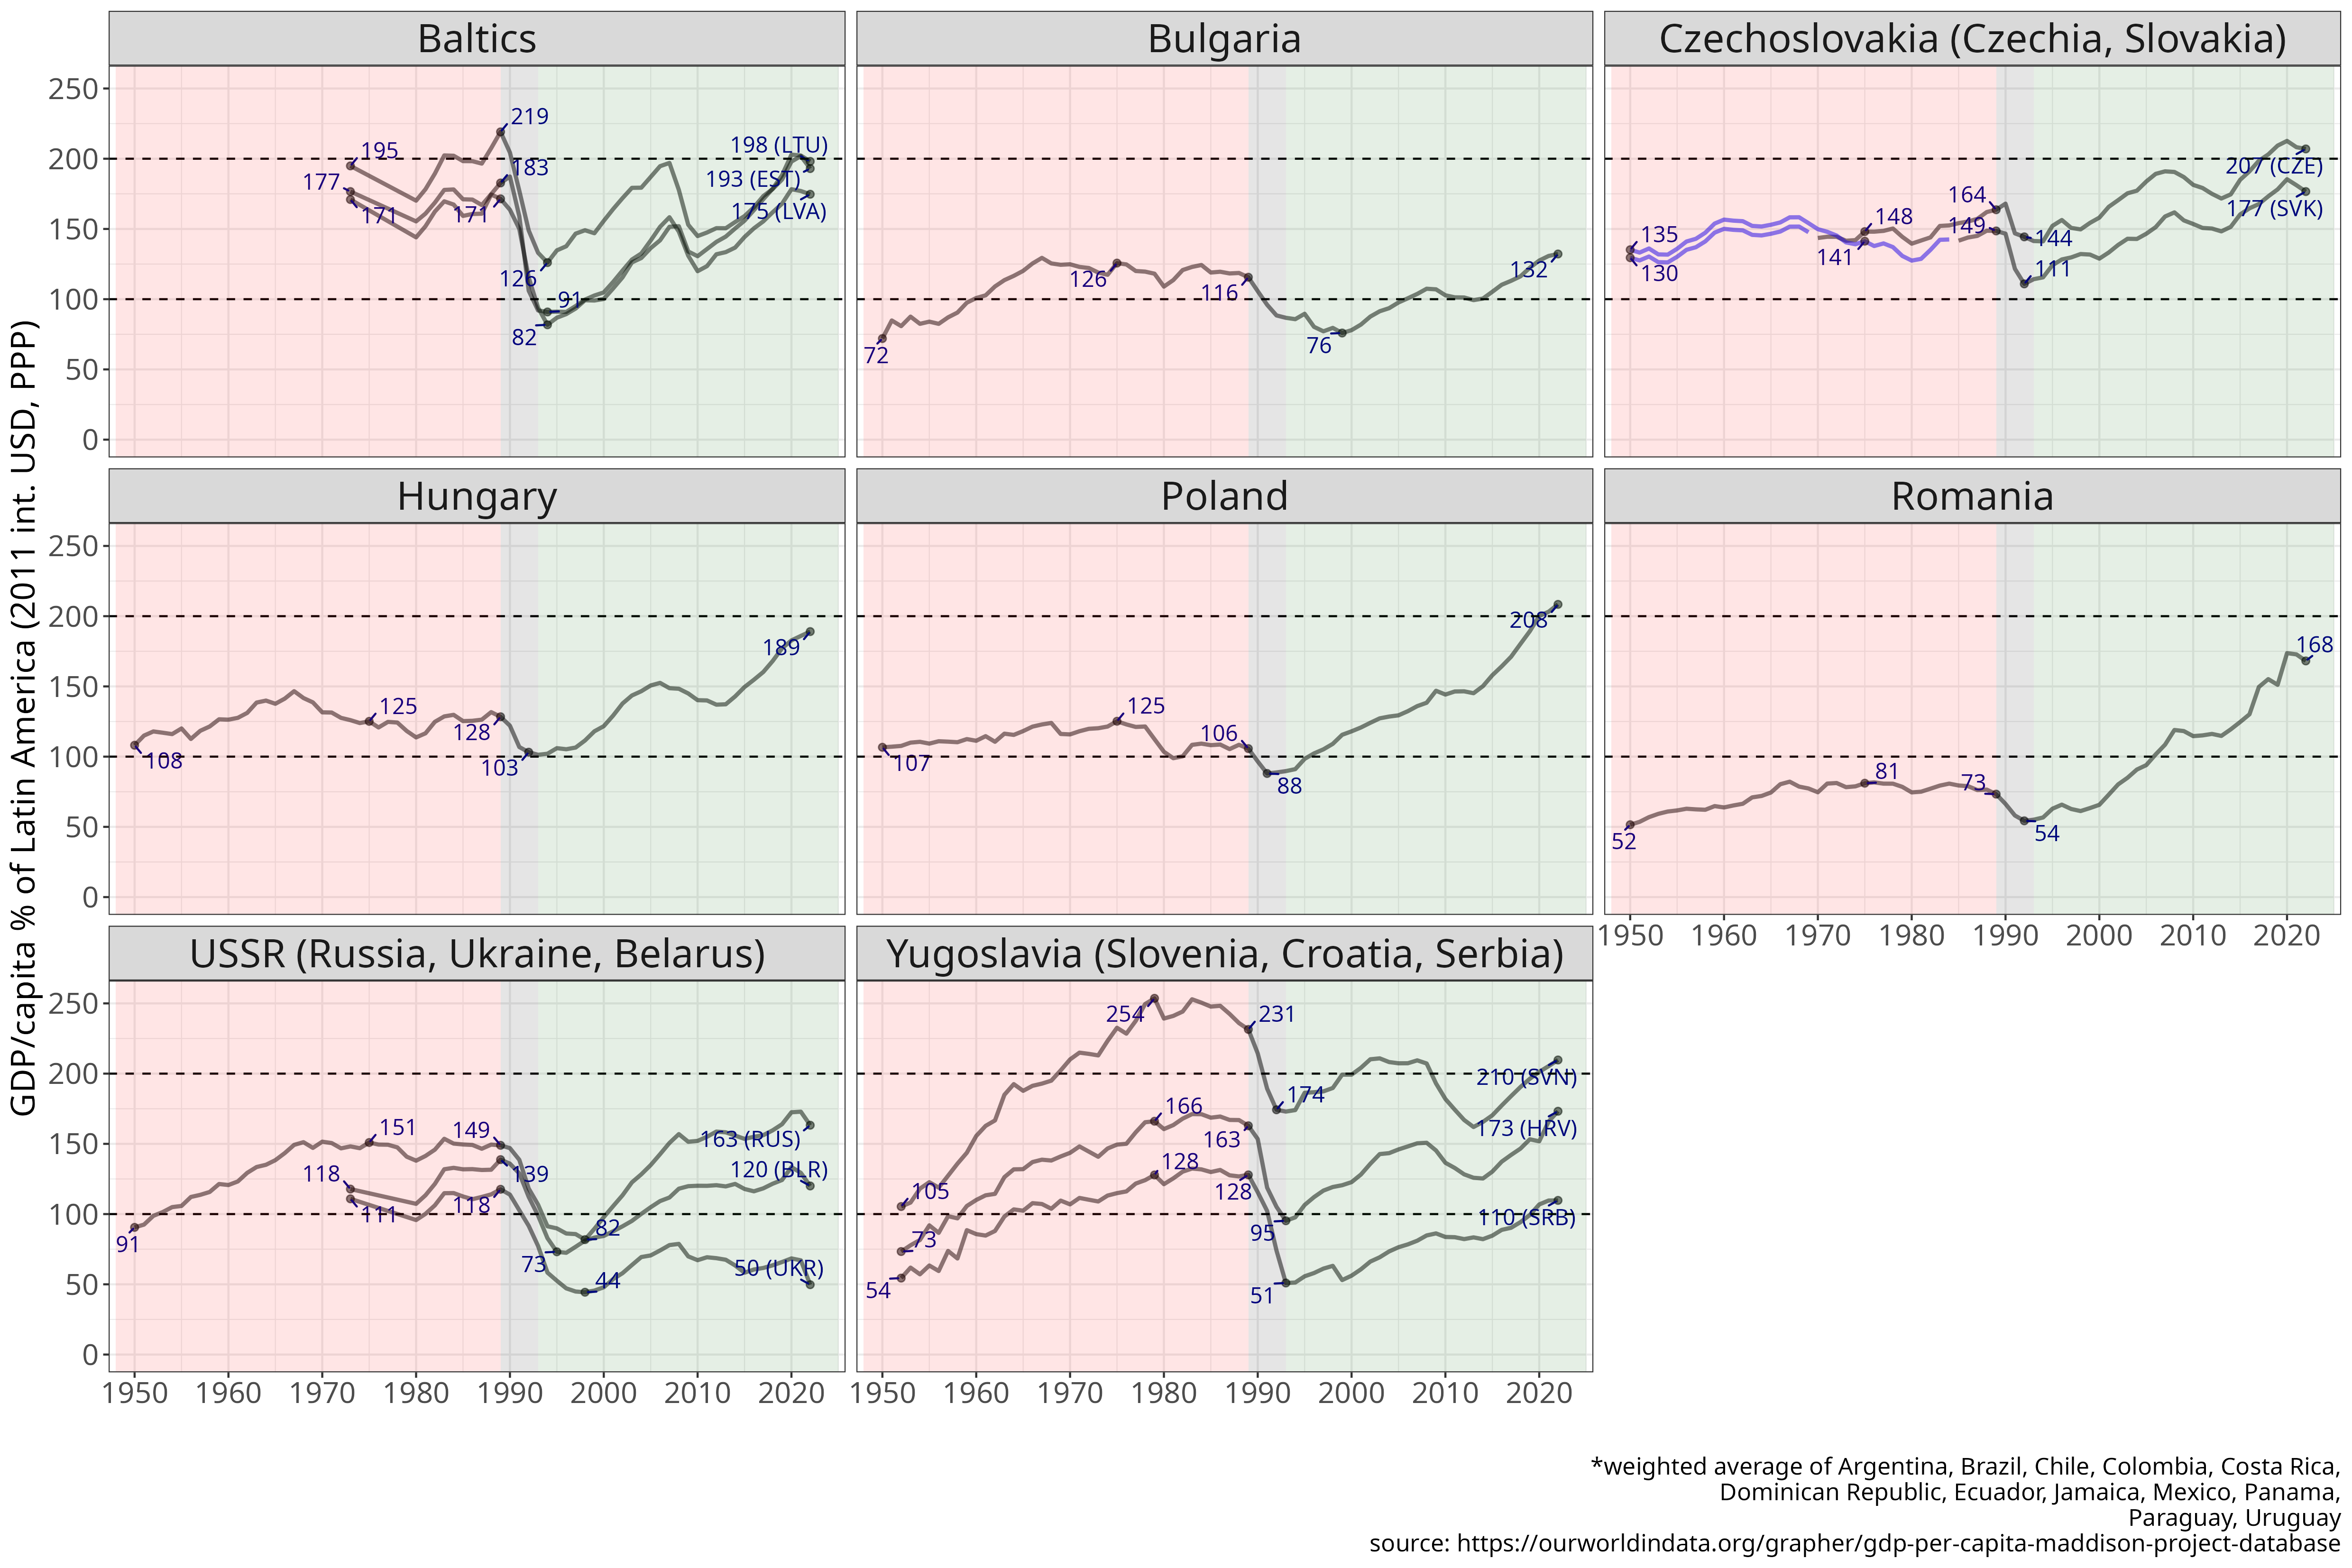
Figure 1 Dynamics of GDP/capita of ex-socialist countries between 1950 and 2022, relative to Germany or the the weighted averages of G7, Southern Europe and Latin America.
Shading: red = socialism, 1950-1989; grey = transition 1989-1992; green = capitalism, 1992-2022.
For Czechia and Slovakia, values prior to 1970 and 1985 respectively are derived from Czechoslovakia (CZSK) data, rescaled by CZE/CZSK (1970) and SVK/CZSK (1985) ratios. GDP/capita in constant 2011 international dollars (PPP).
[download plot data]
[source]
Figure 1 shows that the CEE countries were either in continuous decline relative to the core’s output level (Hungary, Czechia, Slovakia, Poland) between 1950 and the mid-1970s or stood still (Romania, Bulgaria and Russia).
Especially for the more developed CEE countries of Hungary, Poland and Czechia/Slovakia, early socialism started off from a level not that distant from Germany’s (~80% for CZ/SK, and ~65% for HU and PL) and ‘managed to’ lower this to about 50% by 1975.
Bulgaria and Romania stood still, but at a lower level compared to the core’s (RO: ~30%, BG: 45%), while Russia at a somewhat higher (~55%).
There is one exception to this pattern, the former Yugoslavia: Croatia, Slovenia and Serbia did show convergence to the West in the 1950-1978 period, especially Slovenia, nearly reaching the output per capita level of Germany.
However, from the mid- to late 1970s, the convergence of Yugoslavia also came to a halt. From that point until the end of the socialist regimes, all ex-socialist countries followed a uniform pattern: a continuous decline relative to Germany, the G7, or Southern Europe.
The transition recessions of the early 1990s were quite deep in the Baltics, ex-USSR countries and ex-Yugoslavia (where it also meant war), and milder in the rest of CEE. Following this period, the direction of the trend reversed: all CEE countries started on a path of sustained convergence to the German level from the early/mid-1990s.
Again expressed as a % of the German/G7 level, all CEE countries have by now well exceeded their nadir at the end of the transition recession, and all except some of the Baltics their 1989 level.
In some countries (RO, PL) the increase compared to 1989 is quite dramatic, doubling or even almost tripling their level relative to Germany/the G7 and more than halving the gap with DE.
The ex-USSR countries (Russia, Ukraine and Belarus) that did not join European integration have been less successful: while they showed convergence in the 1995-2008 period, it stalled afterwards and they plateaud at a lower level.
If we use Southern Europe (IT, ES, GR, PT) as a benchmark we broadly see the same pattern, but the V-shape is even more dramatic. Under socialism the CEE countries rapidly fell behind Southern Europe, especially after the mid-1970s; and again with the partial exception of Yugoslavia but only before 1980.
Since the early 1990s in turn, CEE caught up substantially with Southern Europe, with some countries having (almost) reached the Southern European average (PL, CZ, SI, LT).
In other words, socialist modernisation was even more unsuccessful - in these broad output terms - if we compare it to Southern Europe, the other comparable, but capitalist, region of Europe.
Compared to Latin America, we find that during socialism the ex-socialist countries mostly remained at the same relative level, with some pulling ahead from a lower basis (RU, BG, RO) in the 1950-1975 period.
After 1990 the CEE region pulled well ahead of Latin America, reaching roughly twice the Latin American level.
I summarise these patterns in a more compact format in Figure 2, which shows only cumulative changes, with color coding to guide the eye (red = falling behind, blue = catching up). The pattern is again rather clear. From 1950 to 1975, CEE countries fell behind Western and Southern Europe, with the exception of Yugoslavia. Between 1975 and 1989, all socialist countries, including Yugoslavia, experienced relative decline compared to Western and Southern Europe. Following the transition recession, since the early/mid-1990s, CEE countries have shown strong convergence towards Germany’s level (around 20-40% cumulatively since 1990), but also vis-a-vis the G7, and Southern Europe (+40-60%), while pulling away from Latin America, moving from roughly parity to about twice the Latin American level.
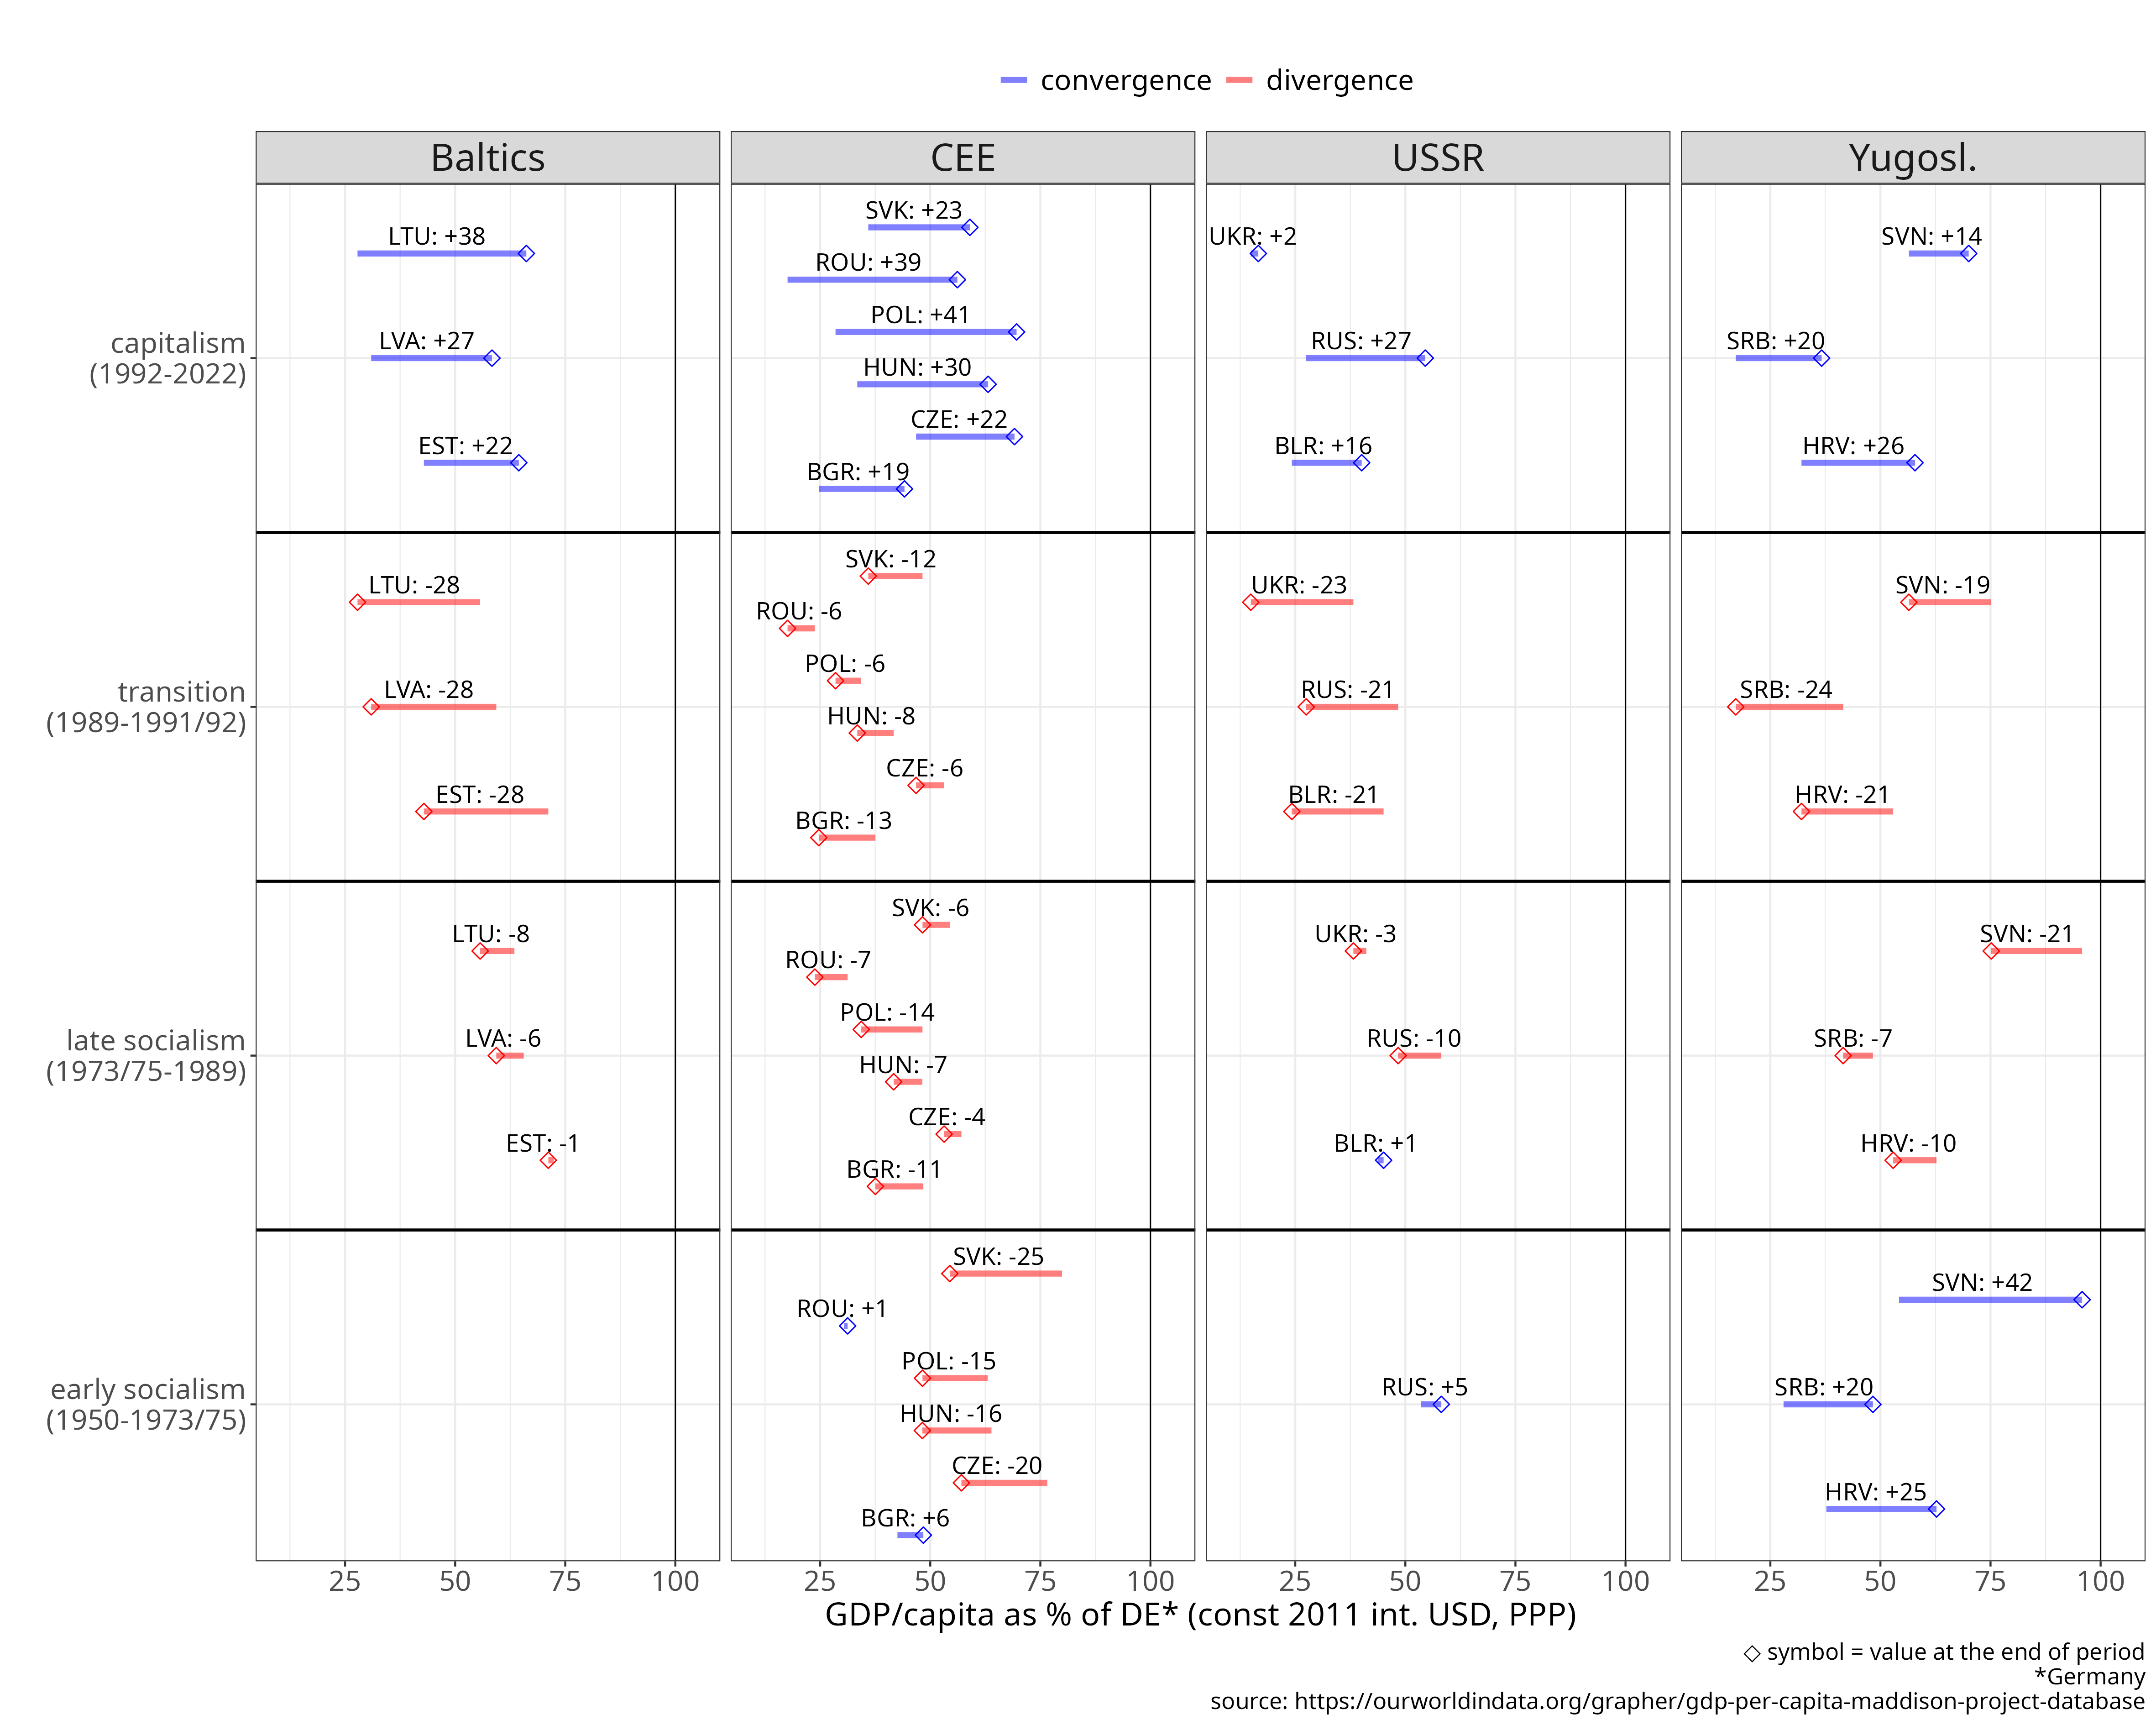
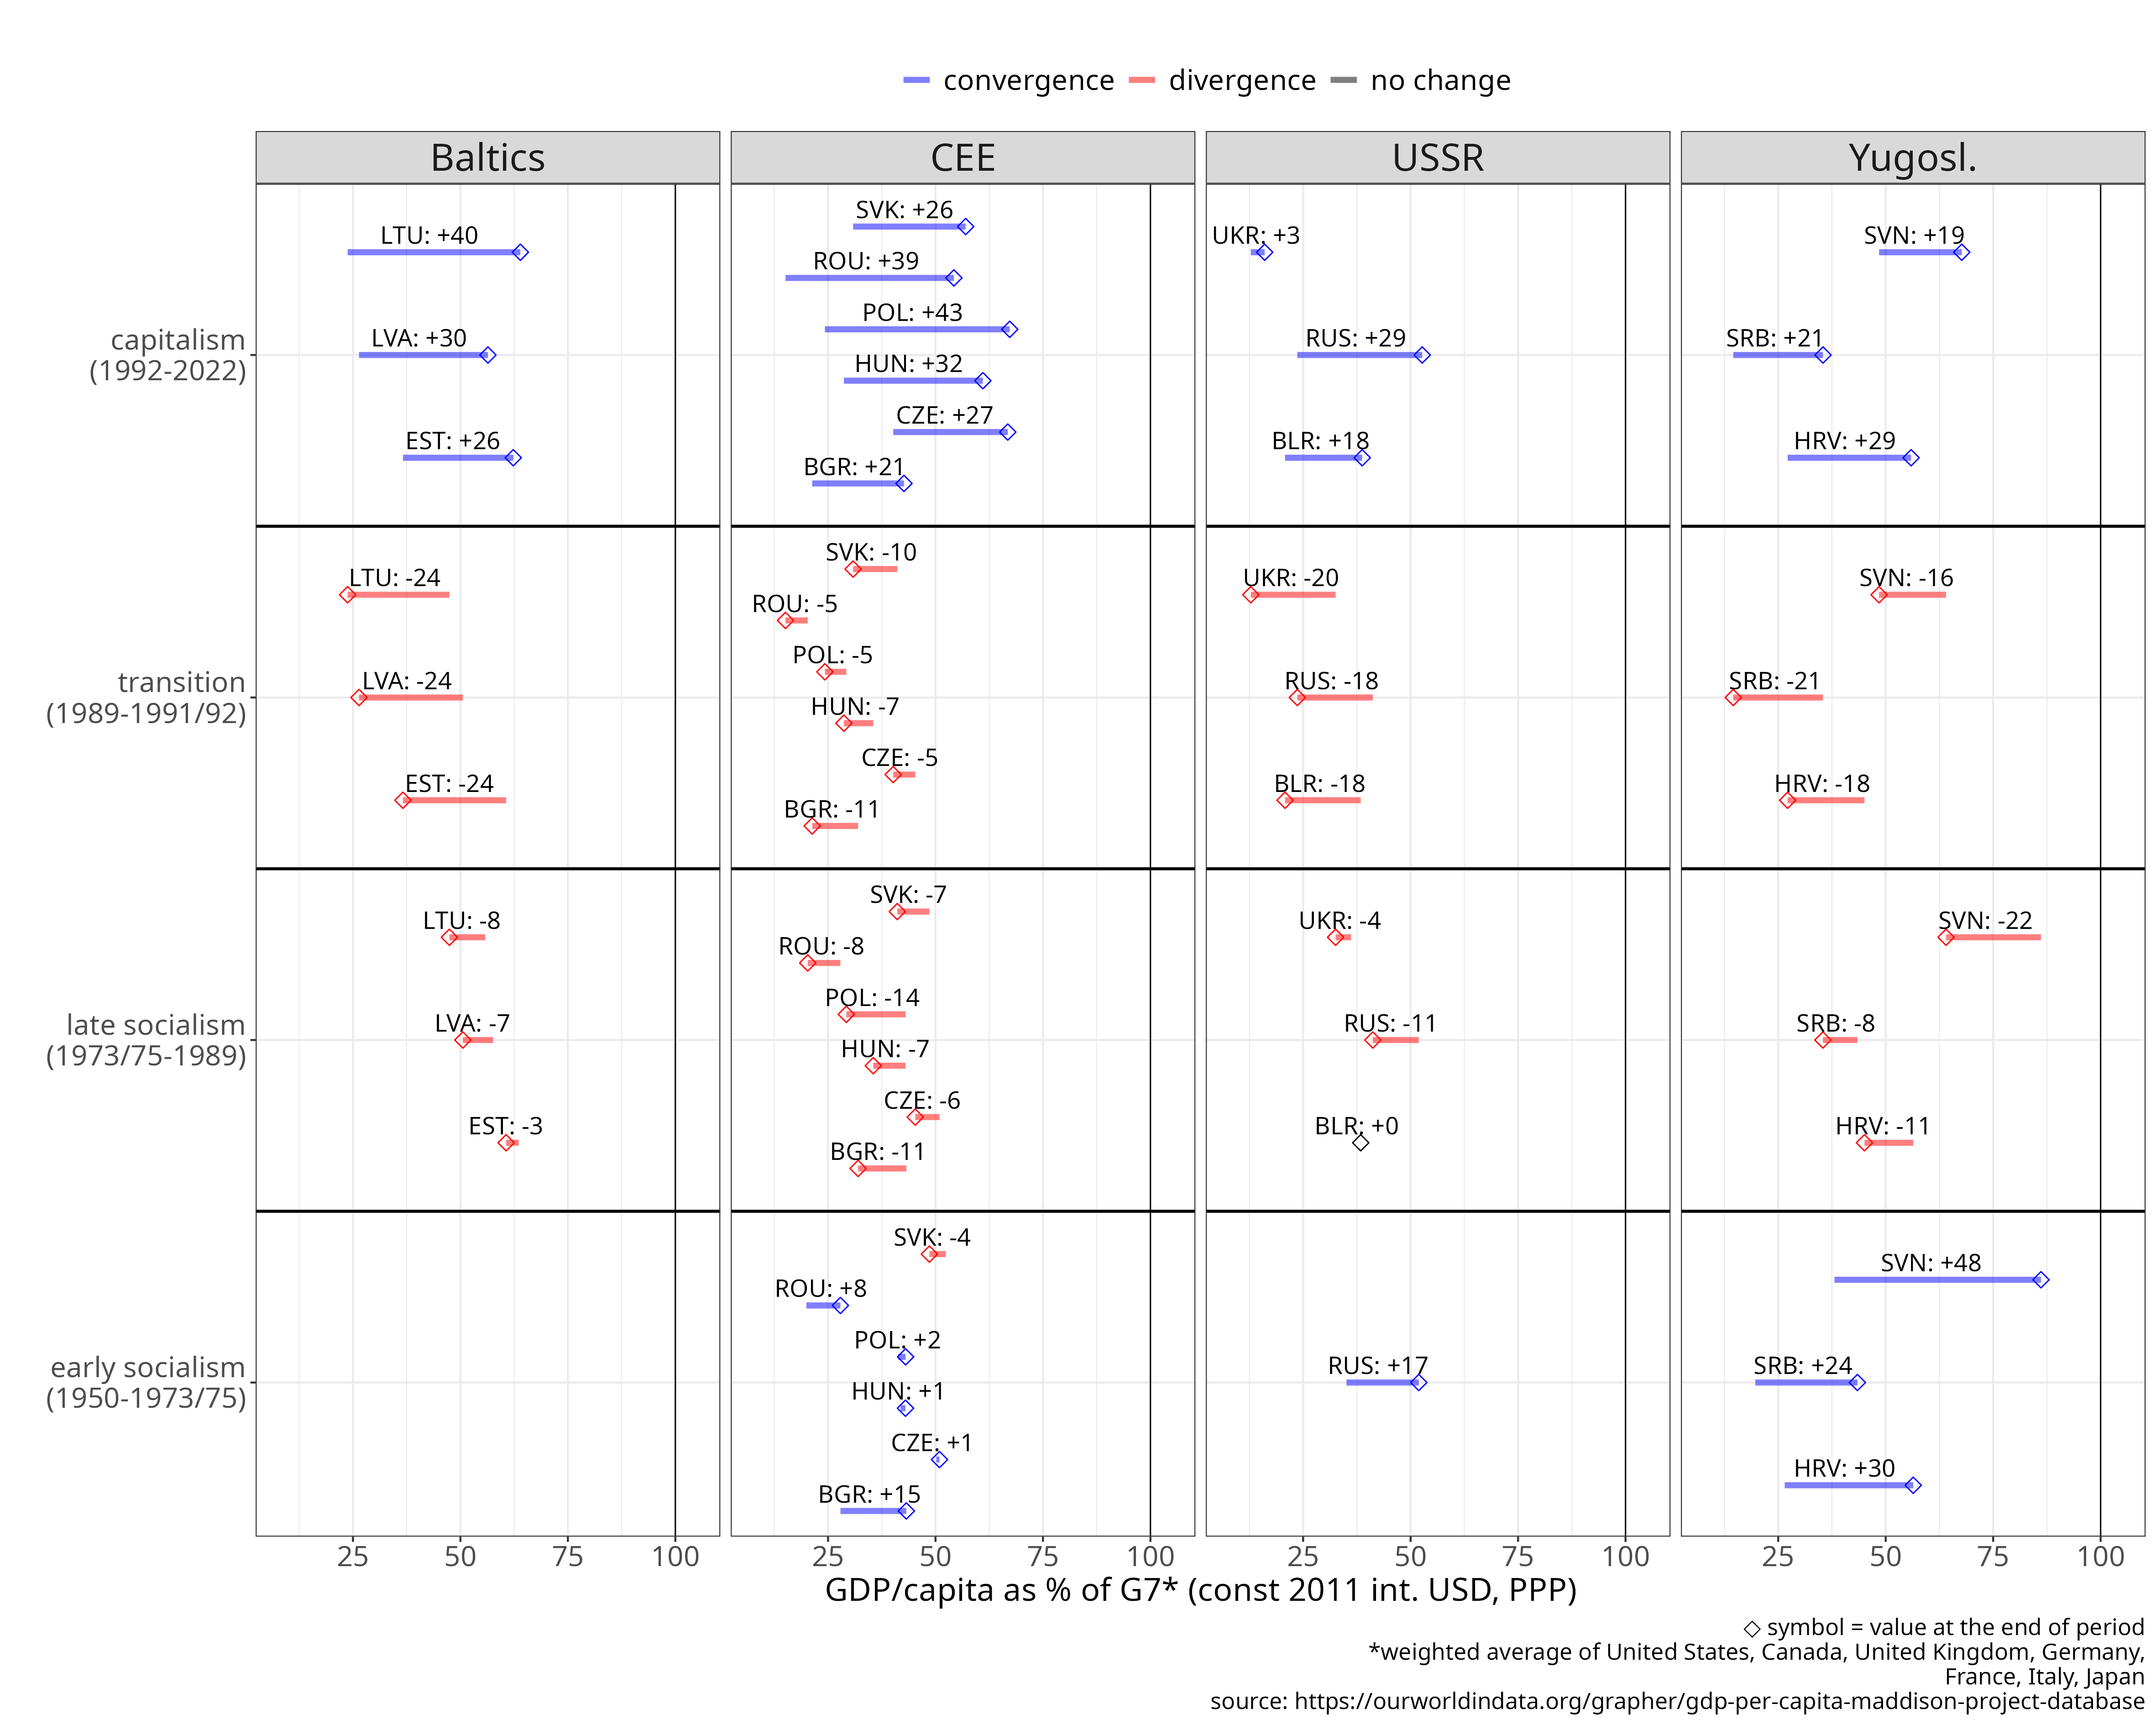

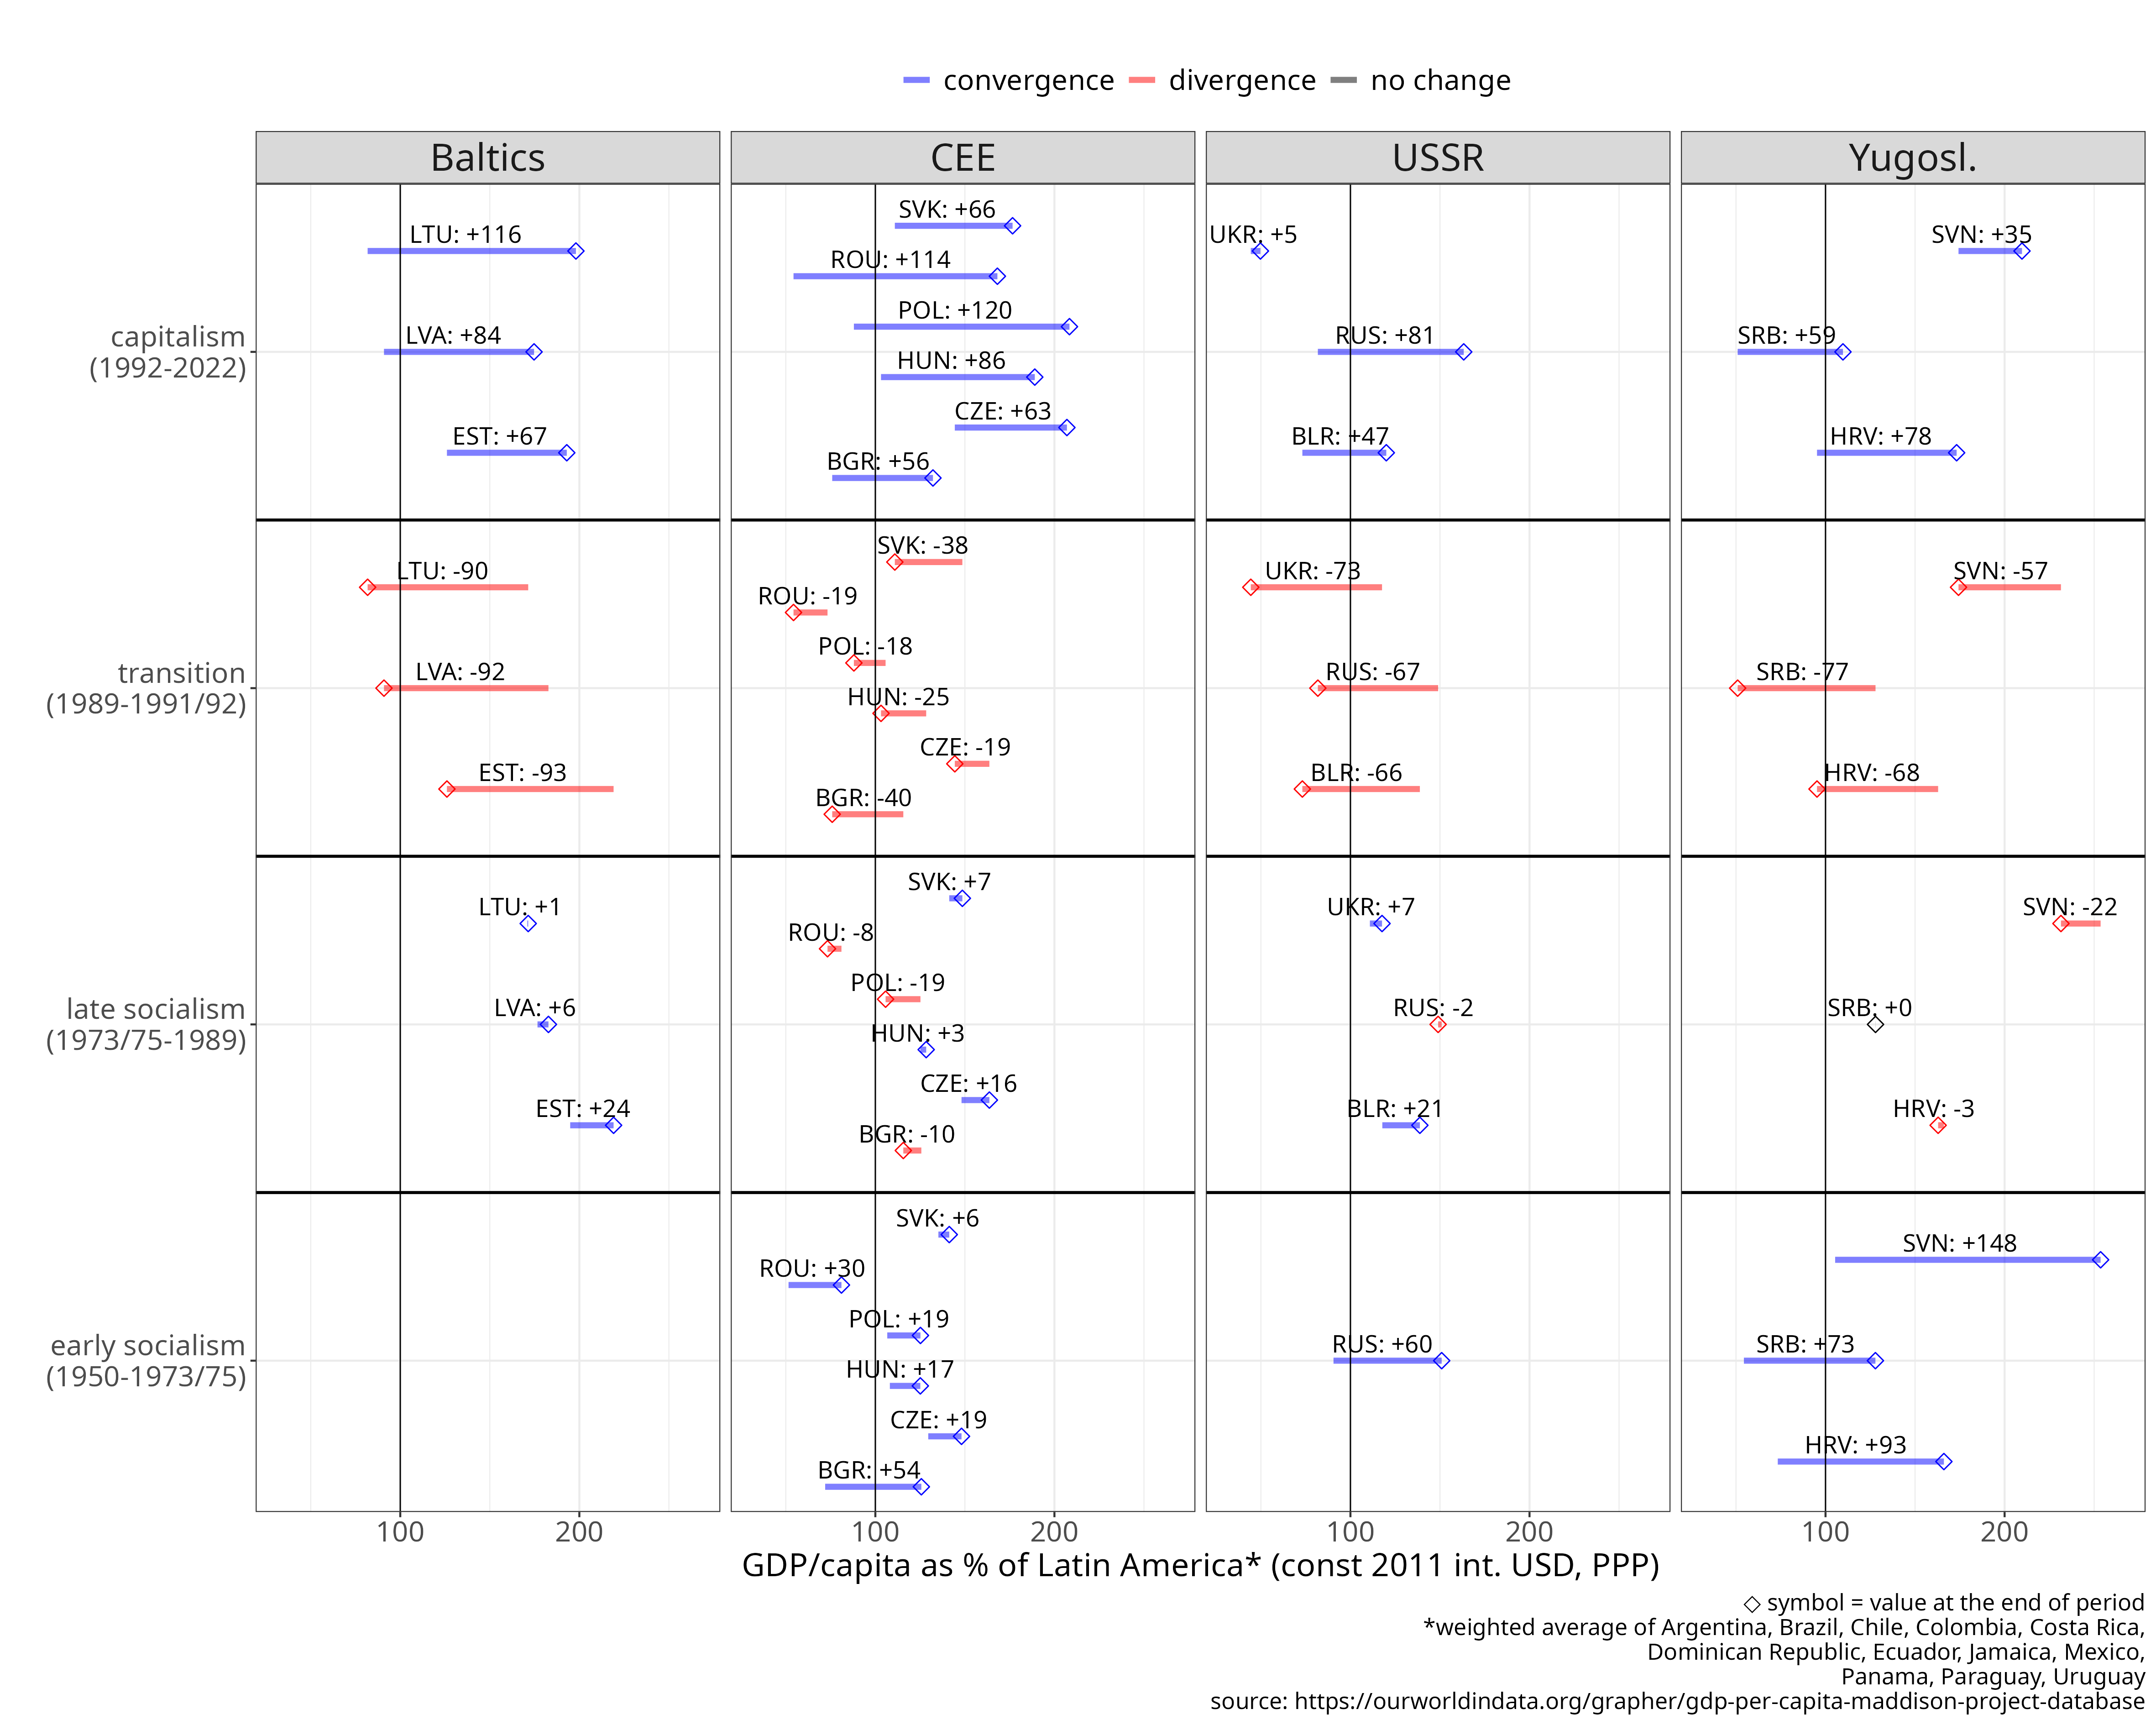

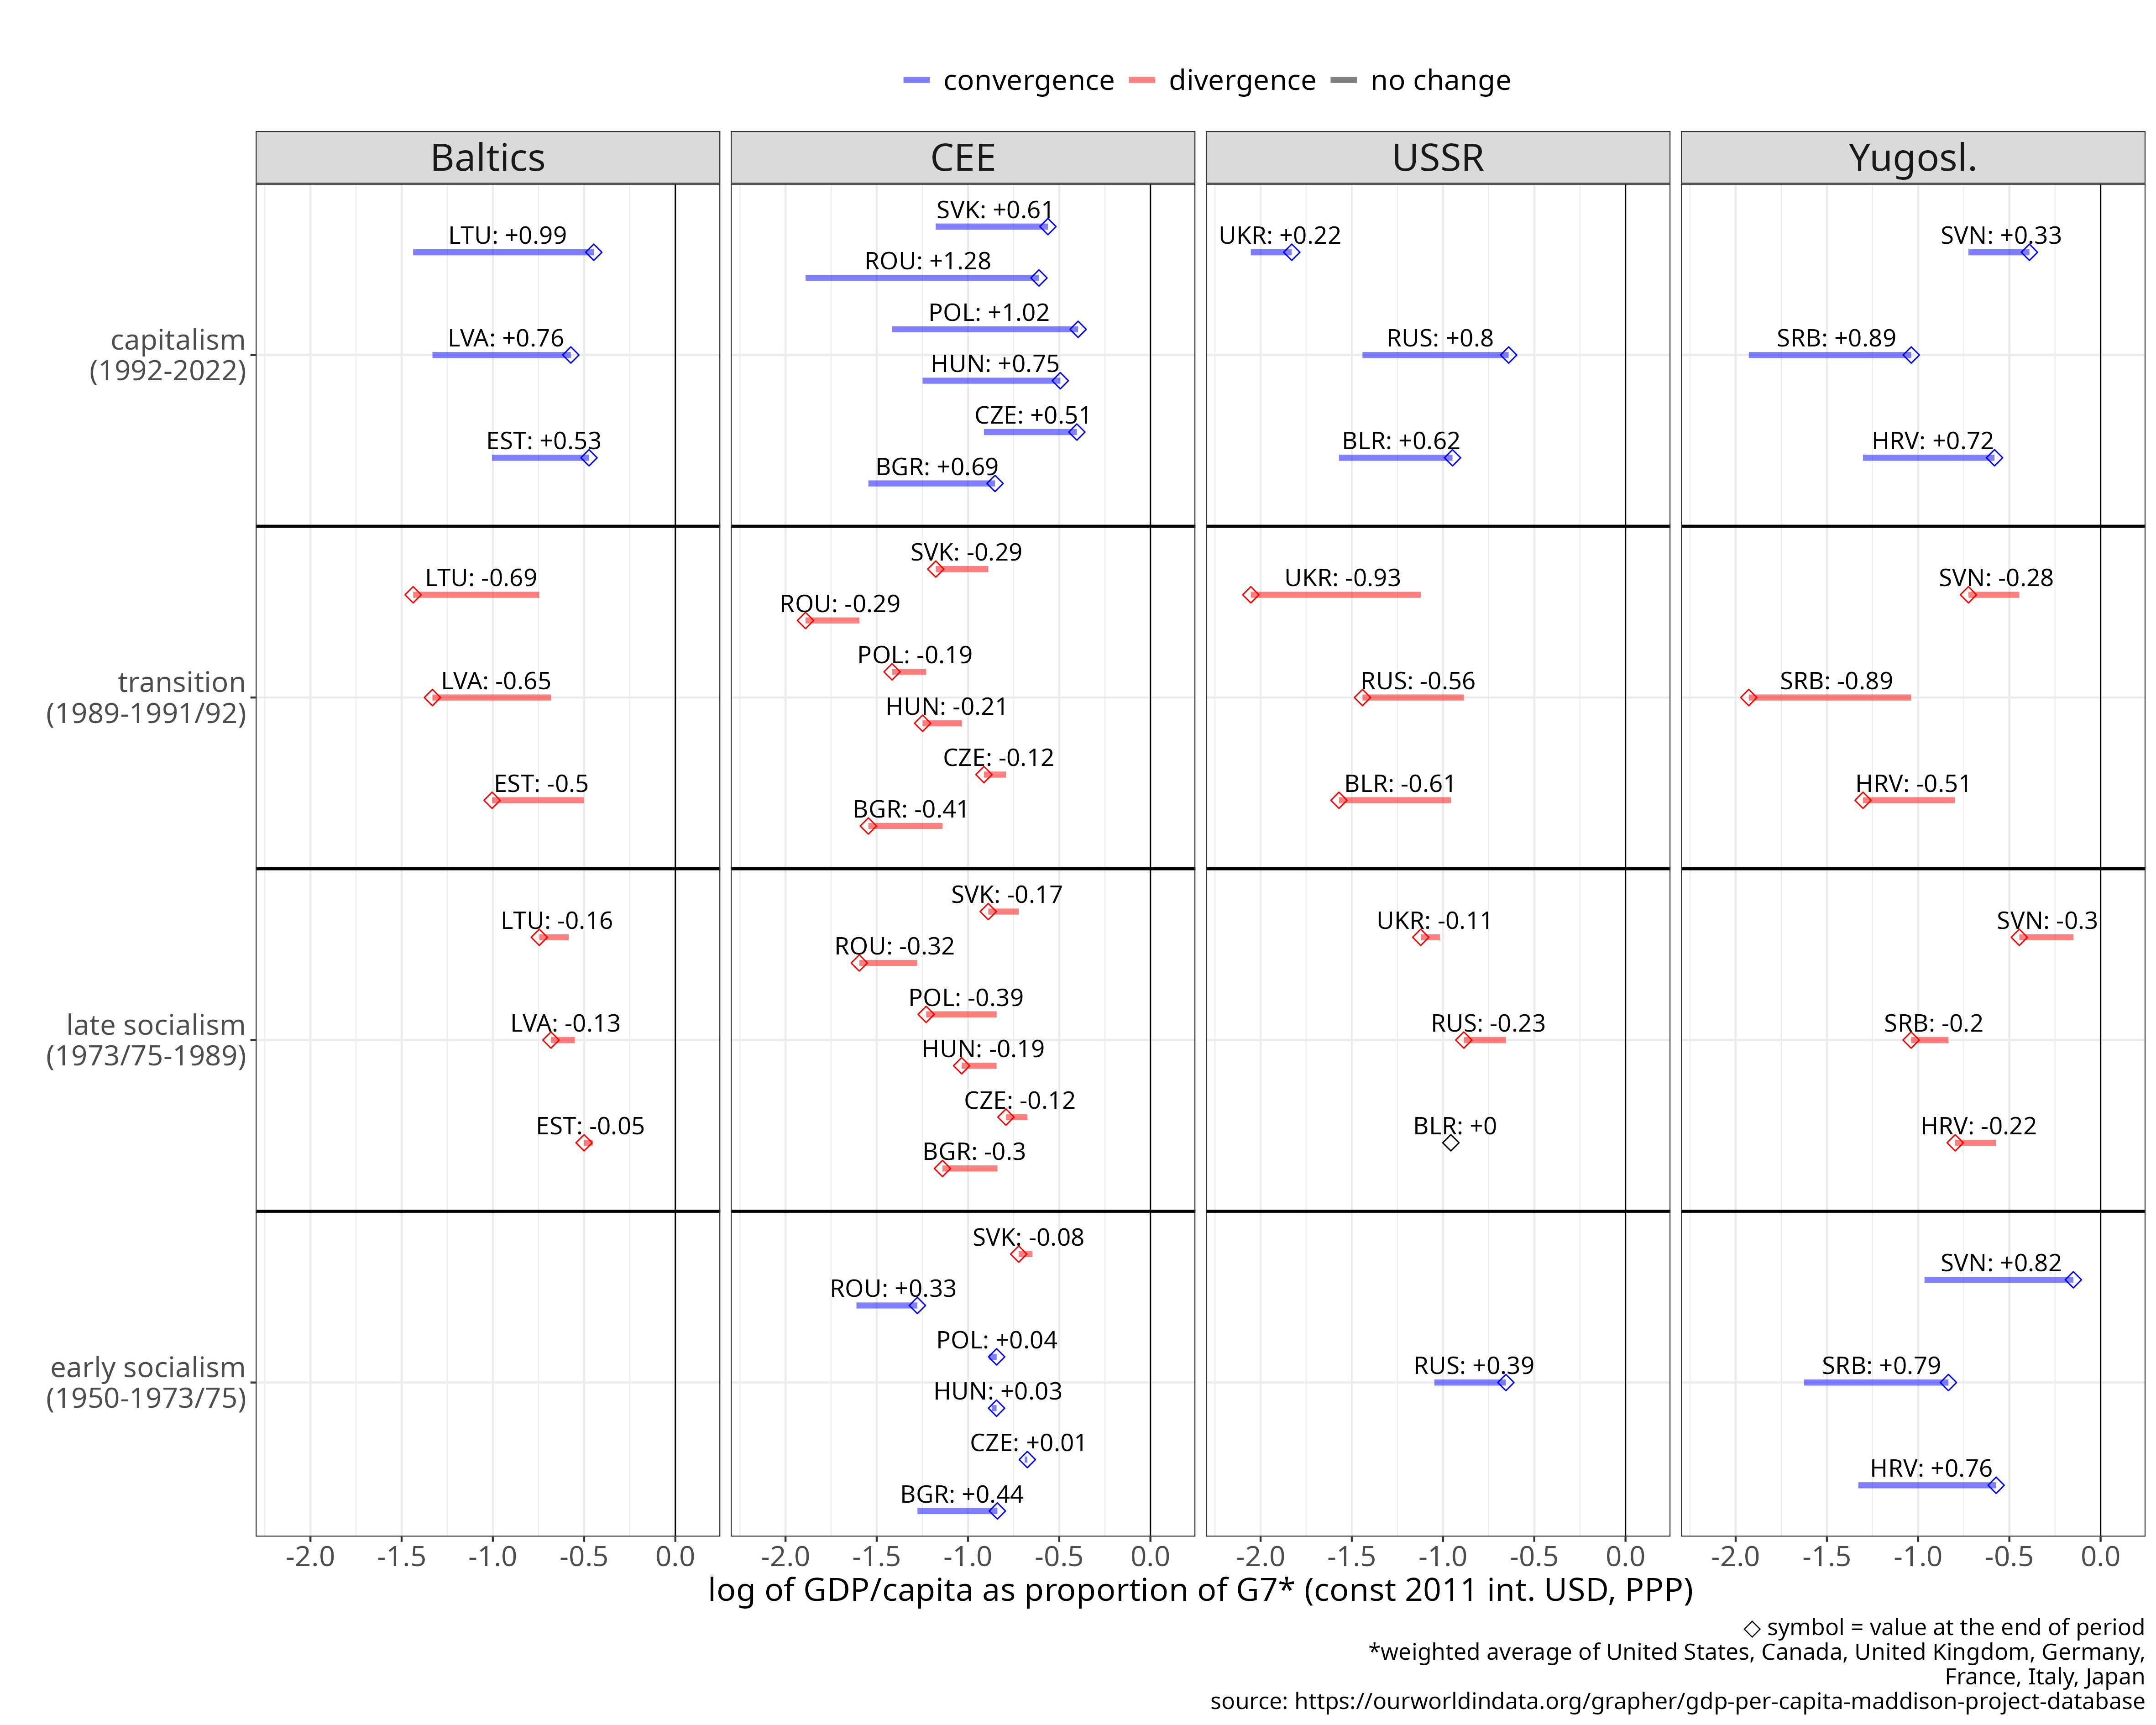
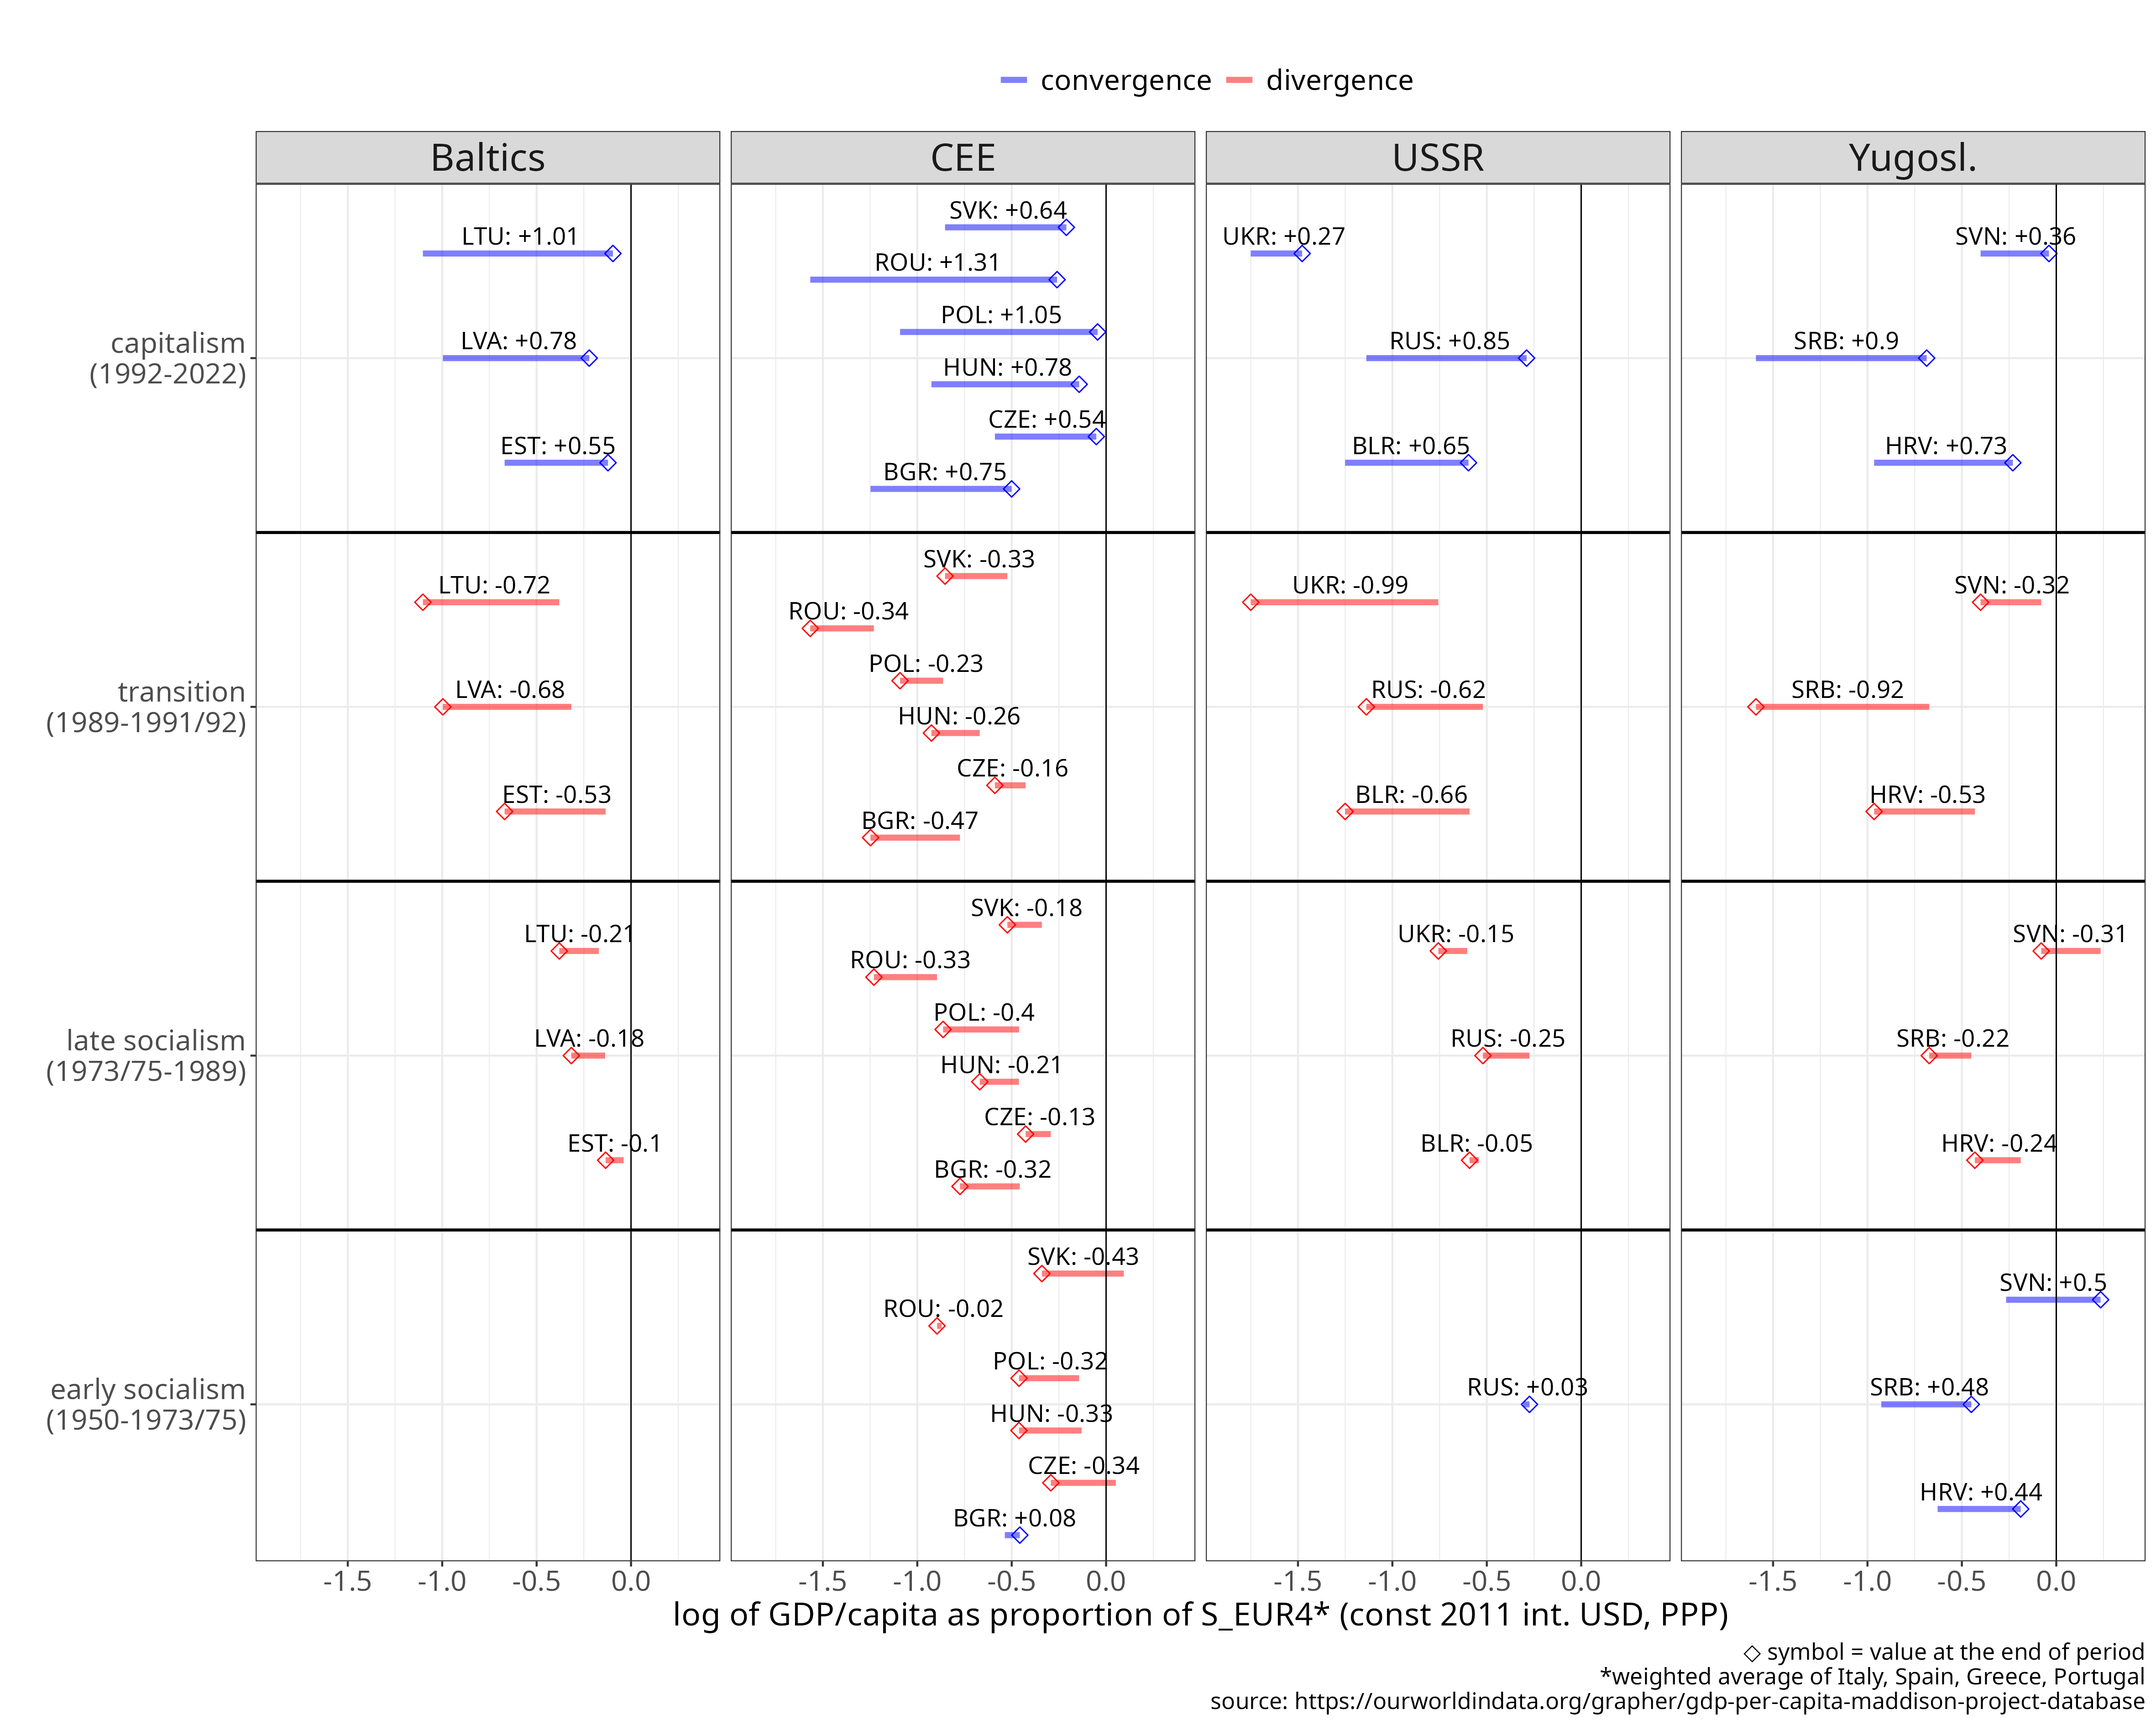
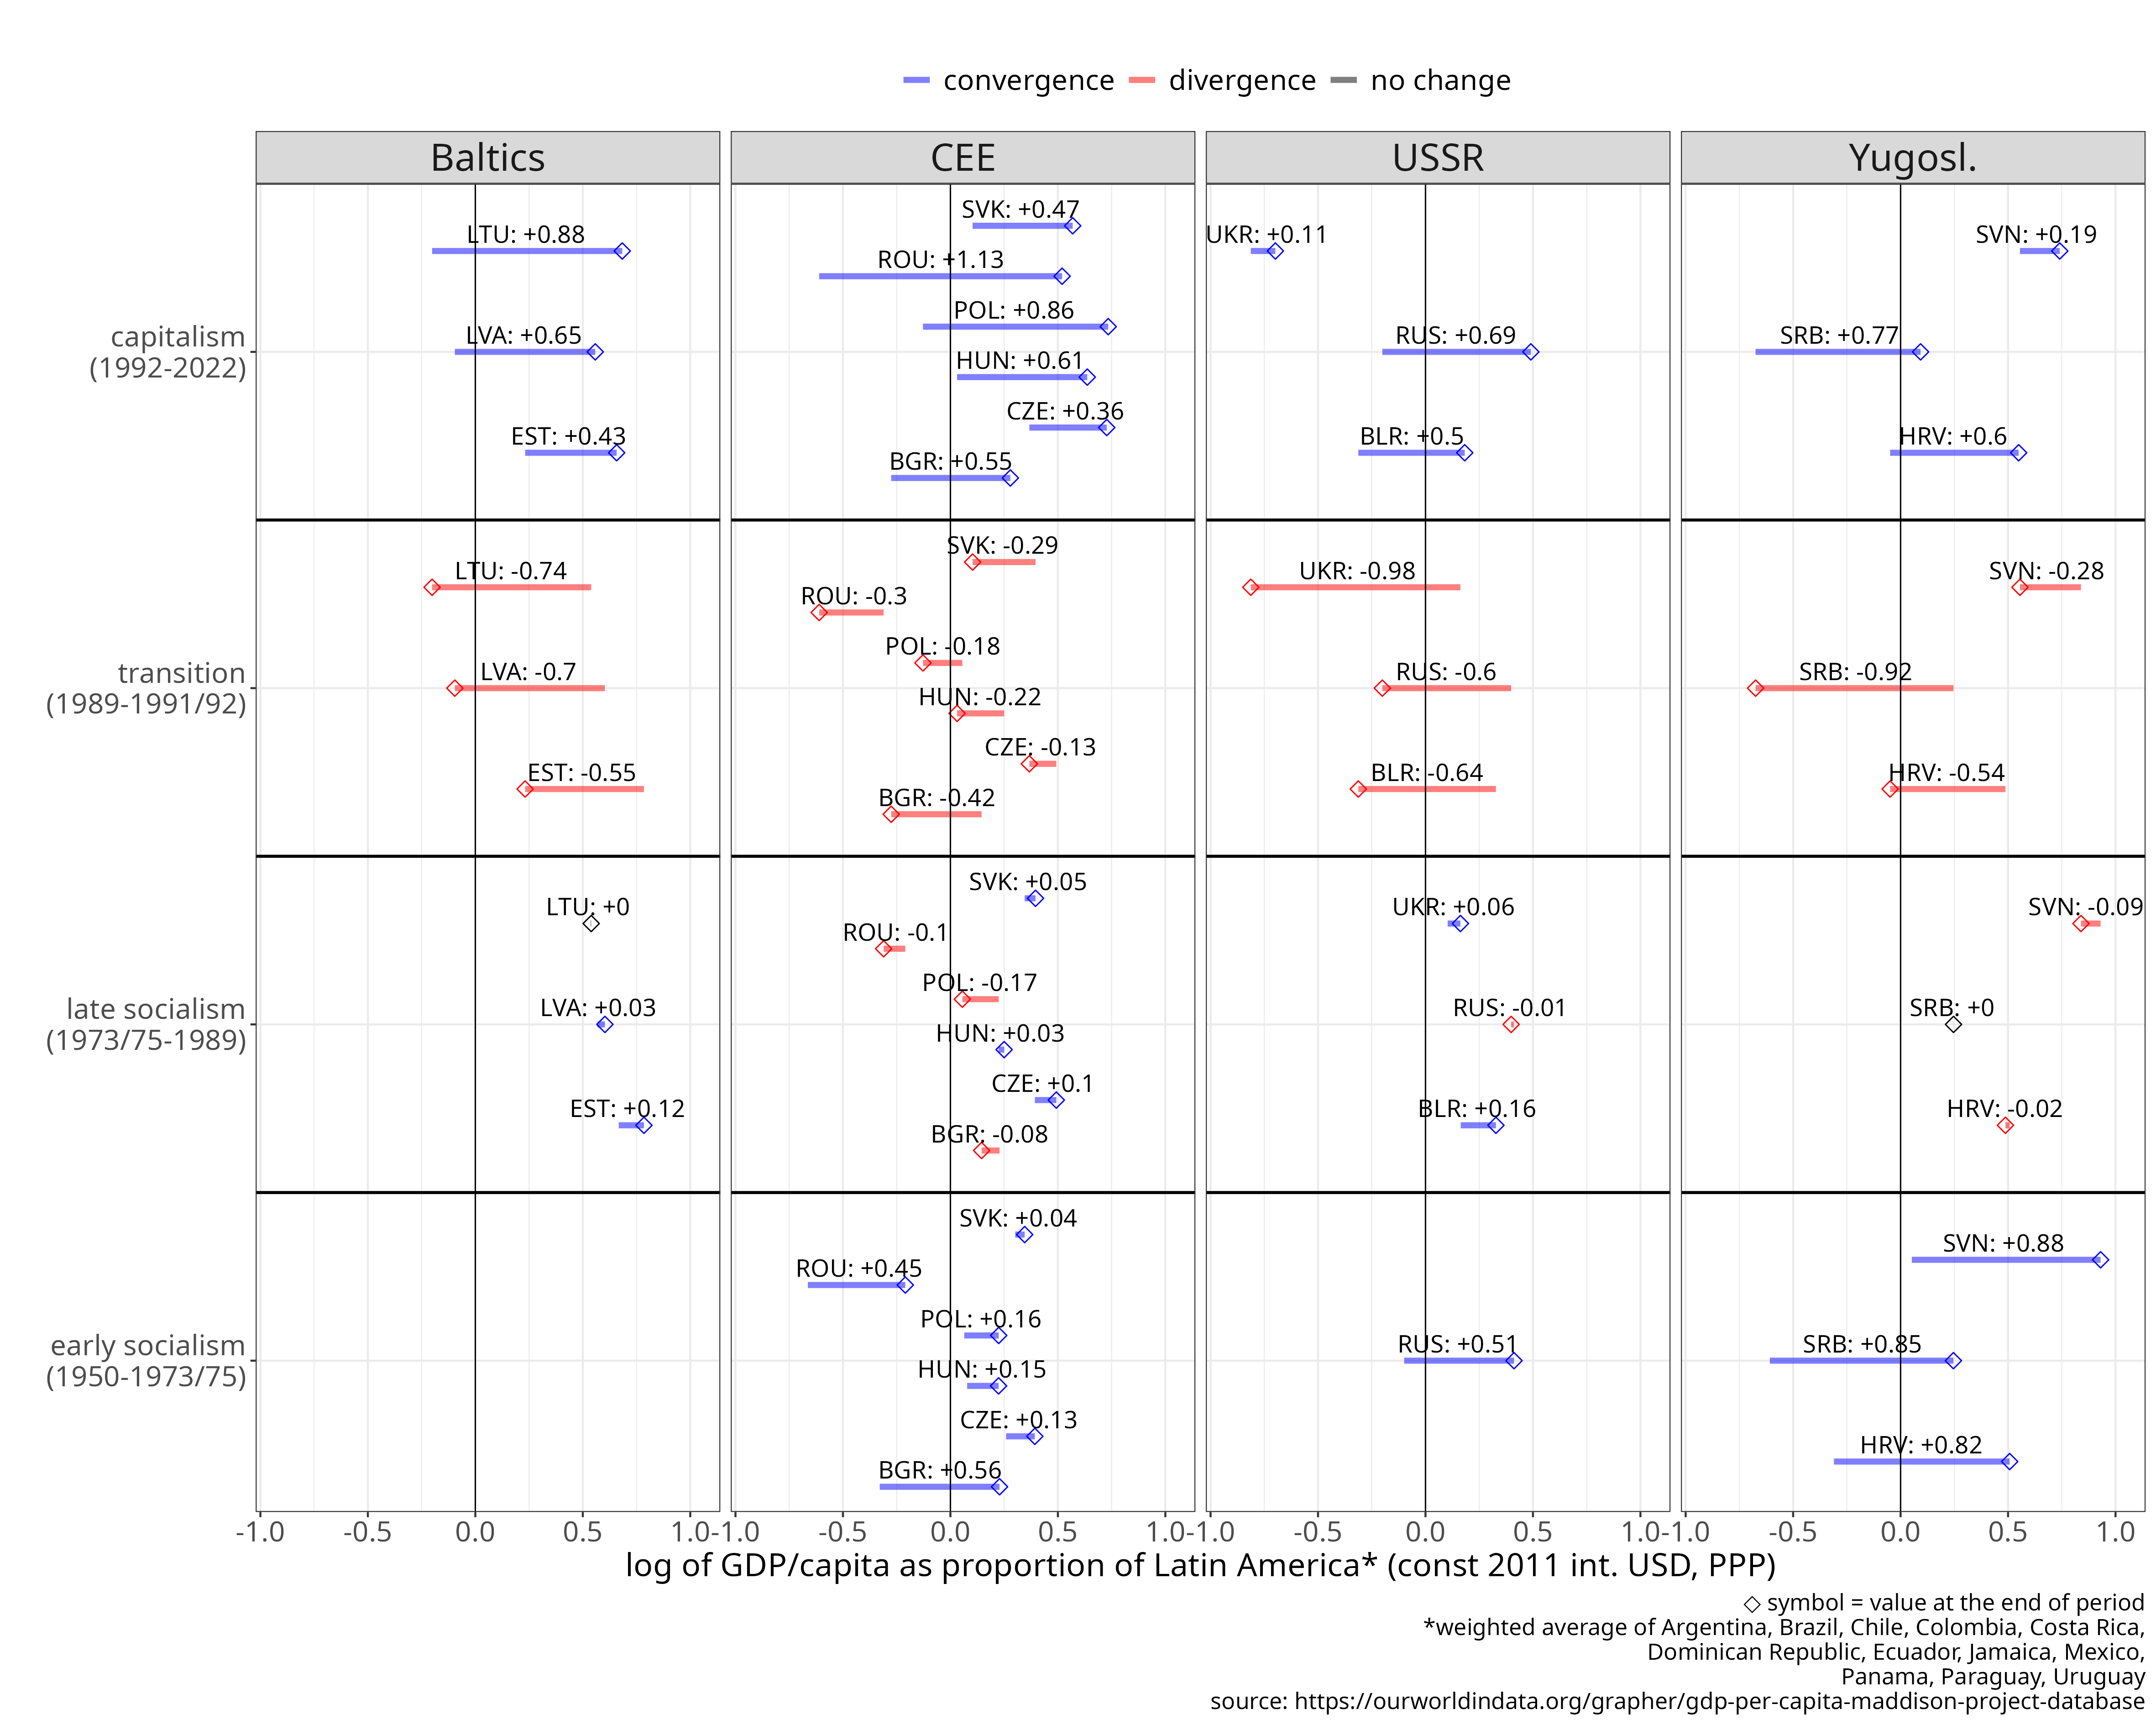
Figure 2 Cumulative change in GDP/capita of ex-socialist countries relative to the Western core, Southern Europe and Latin America.
For Czechia and Slovakia, values prior to 1970 and 1985 respectively are derived from Czechoslovakia (CZSK) data, rescaled using the CZE/CZSK ratio in 1970 and the SVK/CZSK ratio in 1985.
[download plot data]
[source]
Long-term trends of GDP per capita: the Soviet experience
In our analyses so far we looked at the period after WWII, but socialism started earlier in the USSR. Here, we will take a short detour into the pre-1950 Soviet economy. As discussed previously in Methods, to assess the pre-WWII period we have two baseline years (1913 and 1926) and three end-of-period years, yielding six time windows to place Soviet economic performance in a global context. In Figure 3, I plot the fold change in GDP per capita between the start and end of each window (x-axis), together with the final GDP per capita level (y-axis), allowing countries at different income levels to be distinguished. Also, I extended here the list of countries to all countries that had a population over 10 million in 1989.
Figure 3 Growth performance, 1913-1955, for all countries in the peer and benchmark groups, as well as all countries with populations above 10 million in 1989. Panels show changes over selected sub-periods. The x-axis shows GDP per capita at the end of each period, the y-axis the fold change in GDP per capita from start to end year of the period. The red square denotes the USSR; blue circles and diamonds denote CEE and ex-Yugoslav countries. [download plot data] [source]
There is one period, 1926-1939, where the USSR had the highest cumulative growth in relative terms, a 2x increase in the level of output; Venezuela (1.9x) and Turkey (1.7x) showed similar rates. Extending the end point to 1950 or 1955 makes the USSR not the highest growing economy, but the 2nd or 3rd, exceeded by the oil producing economies of Venezuela and Saudi Arabia.
If we use 1913 as the start date, Soviet economic growth falls in the high range, though not the highest.
This period includes wars, revolution, and some pre-revolution years, which lowers cumulative growth.
Conversely, because of this turbulence, the USSR in 1926 was well below its pre-WWI trendline. Starting the measurement from 1926 therefore biases the cumulative growth estimate upward, exaggerating the apparent steepness since it begins from an exogenously induced trough.
The East Asian ‘tigers’ (Japan, South Korea, Taiwan) embarked on explosive growth mostly after 1955, so within these pre-1955 time windows their performance is below average as their post-war growth did not start yet in earnest.
In short, in the 1926-1939 and even the 1926-1950 period Soviet economic growth was exceptionally high, in a global sense, although this was from a very low basis: in 1927 GDP per capita in Russia was at (effectively) the same level as eg. in Kenya ($1240 vs $1150).
In the next approximately 30 years Russia’s output level more than tripled, the second highest rate of growth globally after Venezuela, and reached the per capita output level of - then still quite poor - Spain or relatively richer Latin American countries like Mexico (but still below Argentina, Chile or Venezuela).
We should note that the 1926-1955 period coincided with Stalin’s rule. Whether this growth spurt was achieved, or instead perhaps held back by the extensive state violence of the era is a question beyond the scope of this analysis.
What we can say with certainty is that the two coincided, and that this reign of terror was something unprecedented in global history up until then.
I would leave it to the reader to judge whether the USSR’s growth performance over this 15-30 year period can in any way counterbalance the extreme level of mass violence involved, especially given the caveats regarding the low baseline of 1926.
Putting aside moral questions, to say that Stalinism was the price to pay for an exceptional growth performance seems especially problematic given that the Soviet ‘growth premium’ ended after the mid-1950s, raising serious questions about the quality of industrialisation achieved between 1926 and 1955.
In addition, several countries showed higher cumulative growth (4-6x in 25 years, cf. Figure 4) in the decades following WWII, without state violence on even a remotely comparable scale.
Figure 4 shows the global picture of cumulative growth performance after WWII (also cf. Figure 1-2).
Figure 4: Growth performance, 1950-1989, for all countries in the peer and benchmark groups, as well as all countries with populations above 10 million in 1989. Panels show changes over selected sub-periods. The x-axis shows GDP per capita at the end of each period, the y-axis the fold change in GDP per capita from start to end year of the period. The red square denotes the USSR; blue circles and diamonds denote CEE and ex-Yugoslav countries.
[download plot data]
[source]
In the 1950-1975 period Soviet growth was still in the high range, but several East Asian and Southern European countries (as well as the oil-rich states of Iran and Saudi-Arabia) had higher cumulative growth than the USSR, overtaking the USSR both in absolute level and growth rate. In summary, while within the 1926-1955 period Soviet growth performance could be described as exceptional - though matched by a few oil states - it was not unique if we extend the analysis to the after-war period. In the 1950-1975 period several East Asian and South European countries showed cumulative increases in GDP per capita that were larger than the USSR’s in 1926-1955, in an even shorter amount of time. Following the mid-1970s, Soviet growth performance became first mediocre and progressively below average, reaching a state of stagnation from around 1980.
GDP and GNI per capita since 1990: capitalist convergence
Let us now analyse in more detail the period following 1990, as capitalism was (re)introduced to CEE and the former USSR. In Figure 1-2 we already had a glimpse of the convergence of CEE to the Western core and Southern Europe, and its pulling away from Latin America after 1990.
Now, let us systematically compare CEE to peer regions, using the most up-to-date data by the World Bank, that extends to 2024.
Figure 5 shows the cumulative change of GDP per capita of CEE from 1990 to 2024 alongside five other comparable world regions.
We analyse cumulative change in absolute terms (constant 2021 USD, PPP), or expressed as a percentage of the same variable’s value for the core (Germany, G7), Southern Europe, Latin America, and the world average.
Looking at a linear scale we can assess the absolute change either in (constant) dollars or in percentage points of the benchmark regions.
On the log scale we look at (the log of) the fold change from start to end. The results on linear scale can be said to describe absolute convergence: how much a given country/region climbed upwards through the period. The log scale shows how much countries/regions moved up relative to their own starting point, again either expressed in dollars or in percentages of benchmark regions.
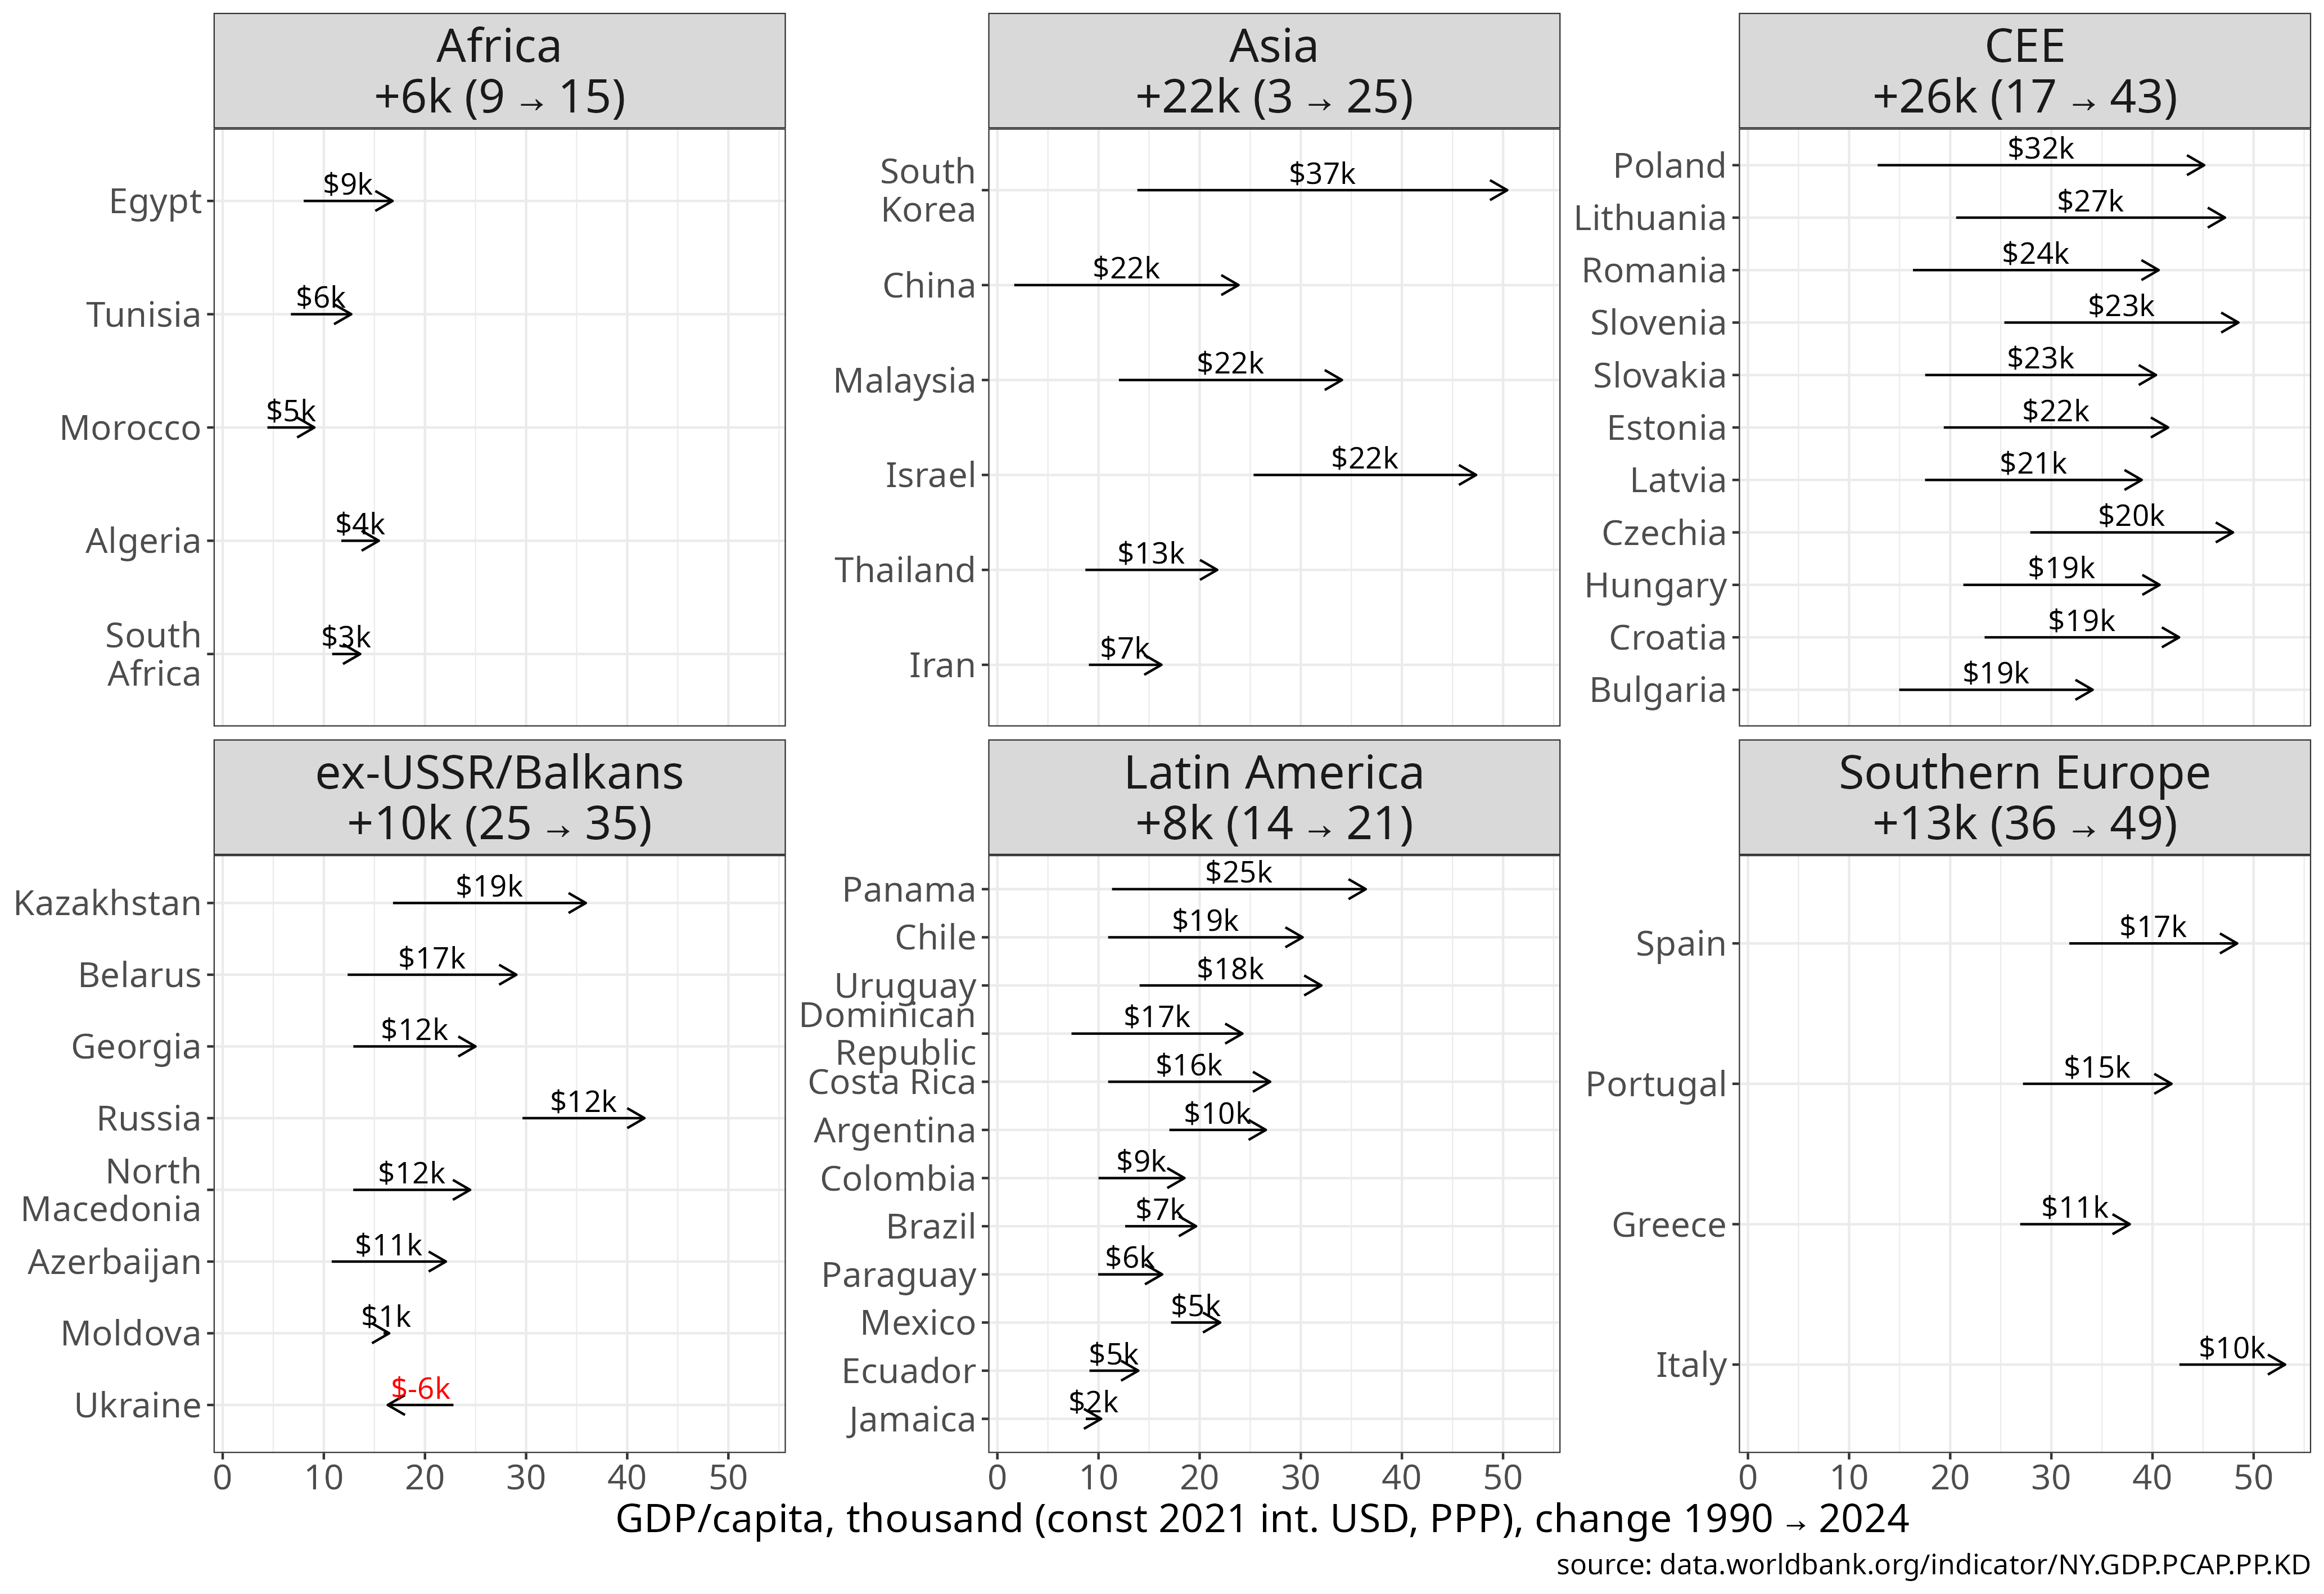
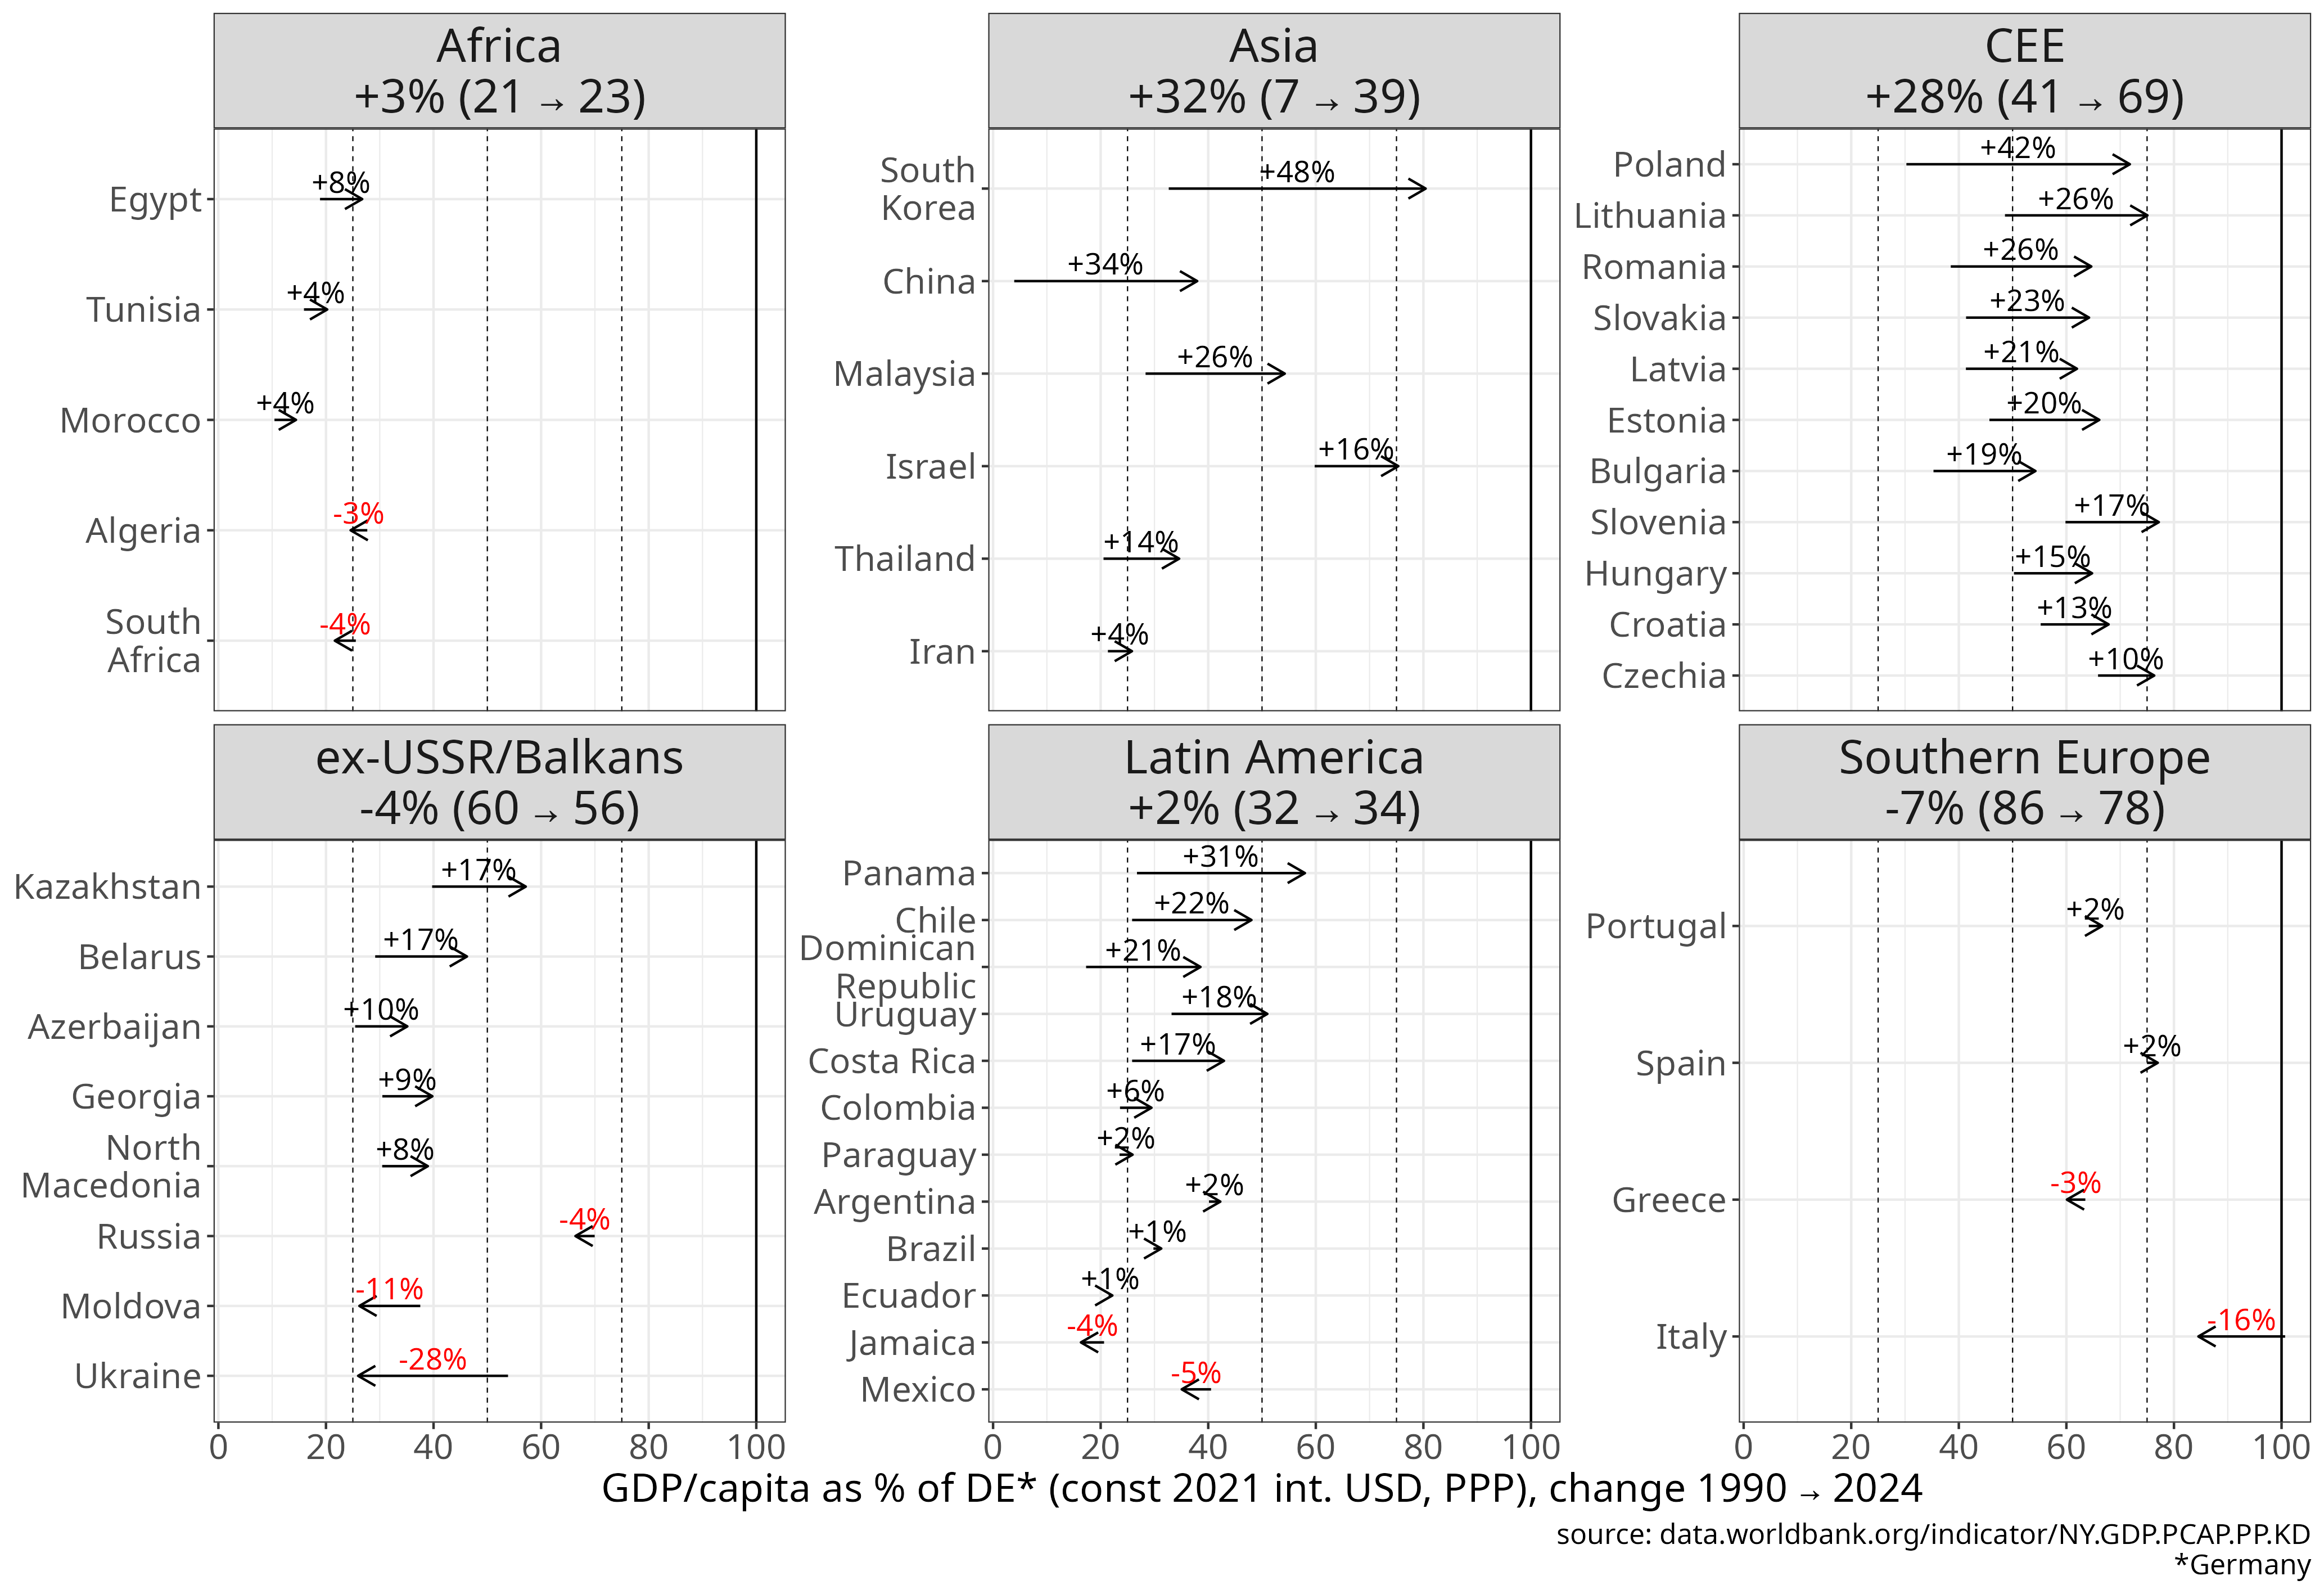
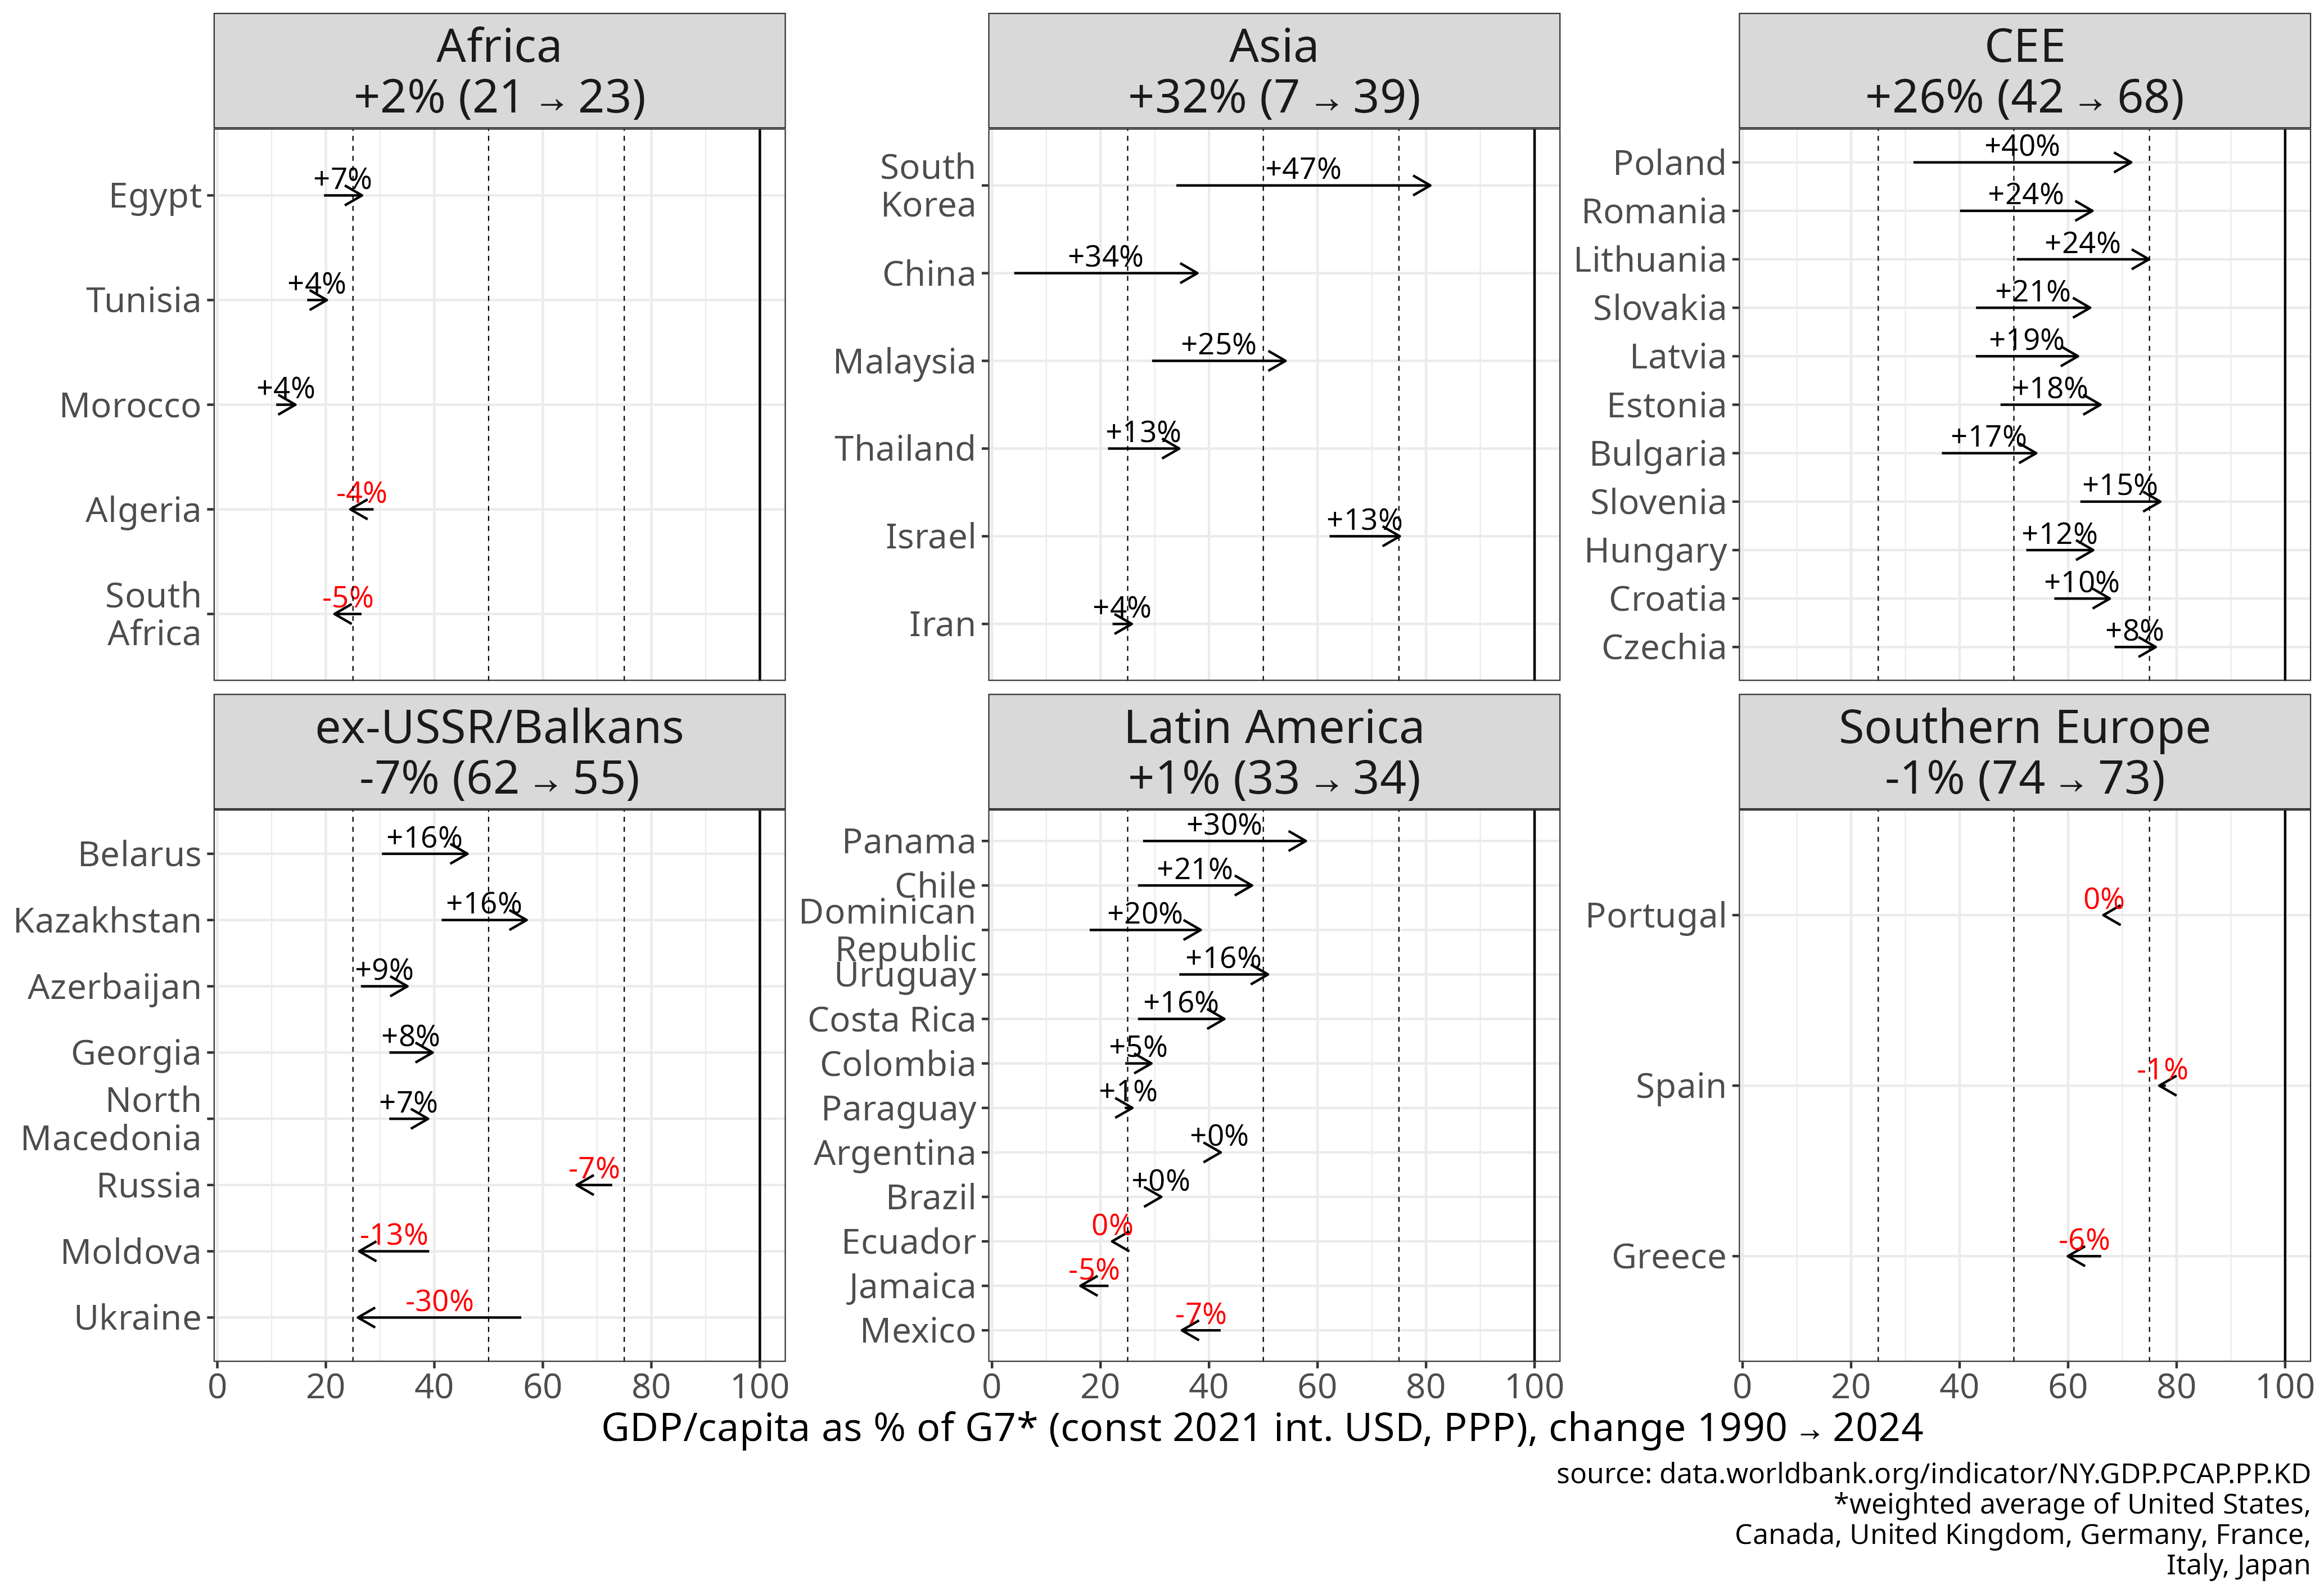
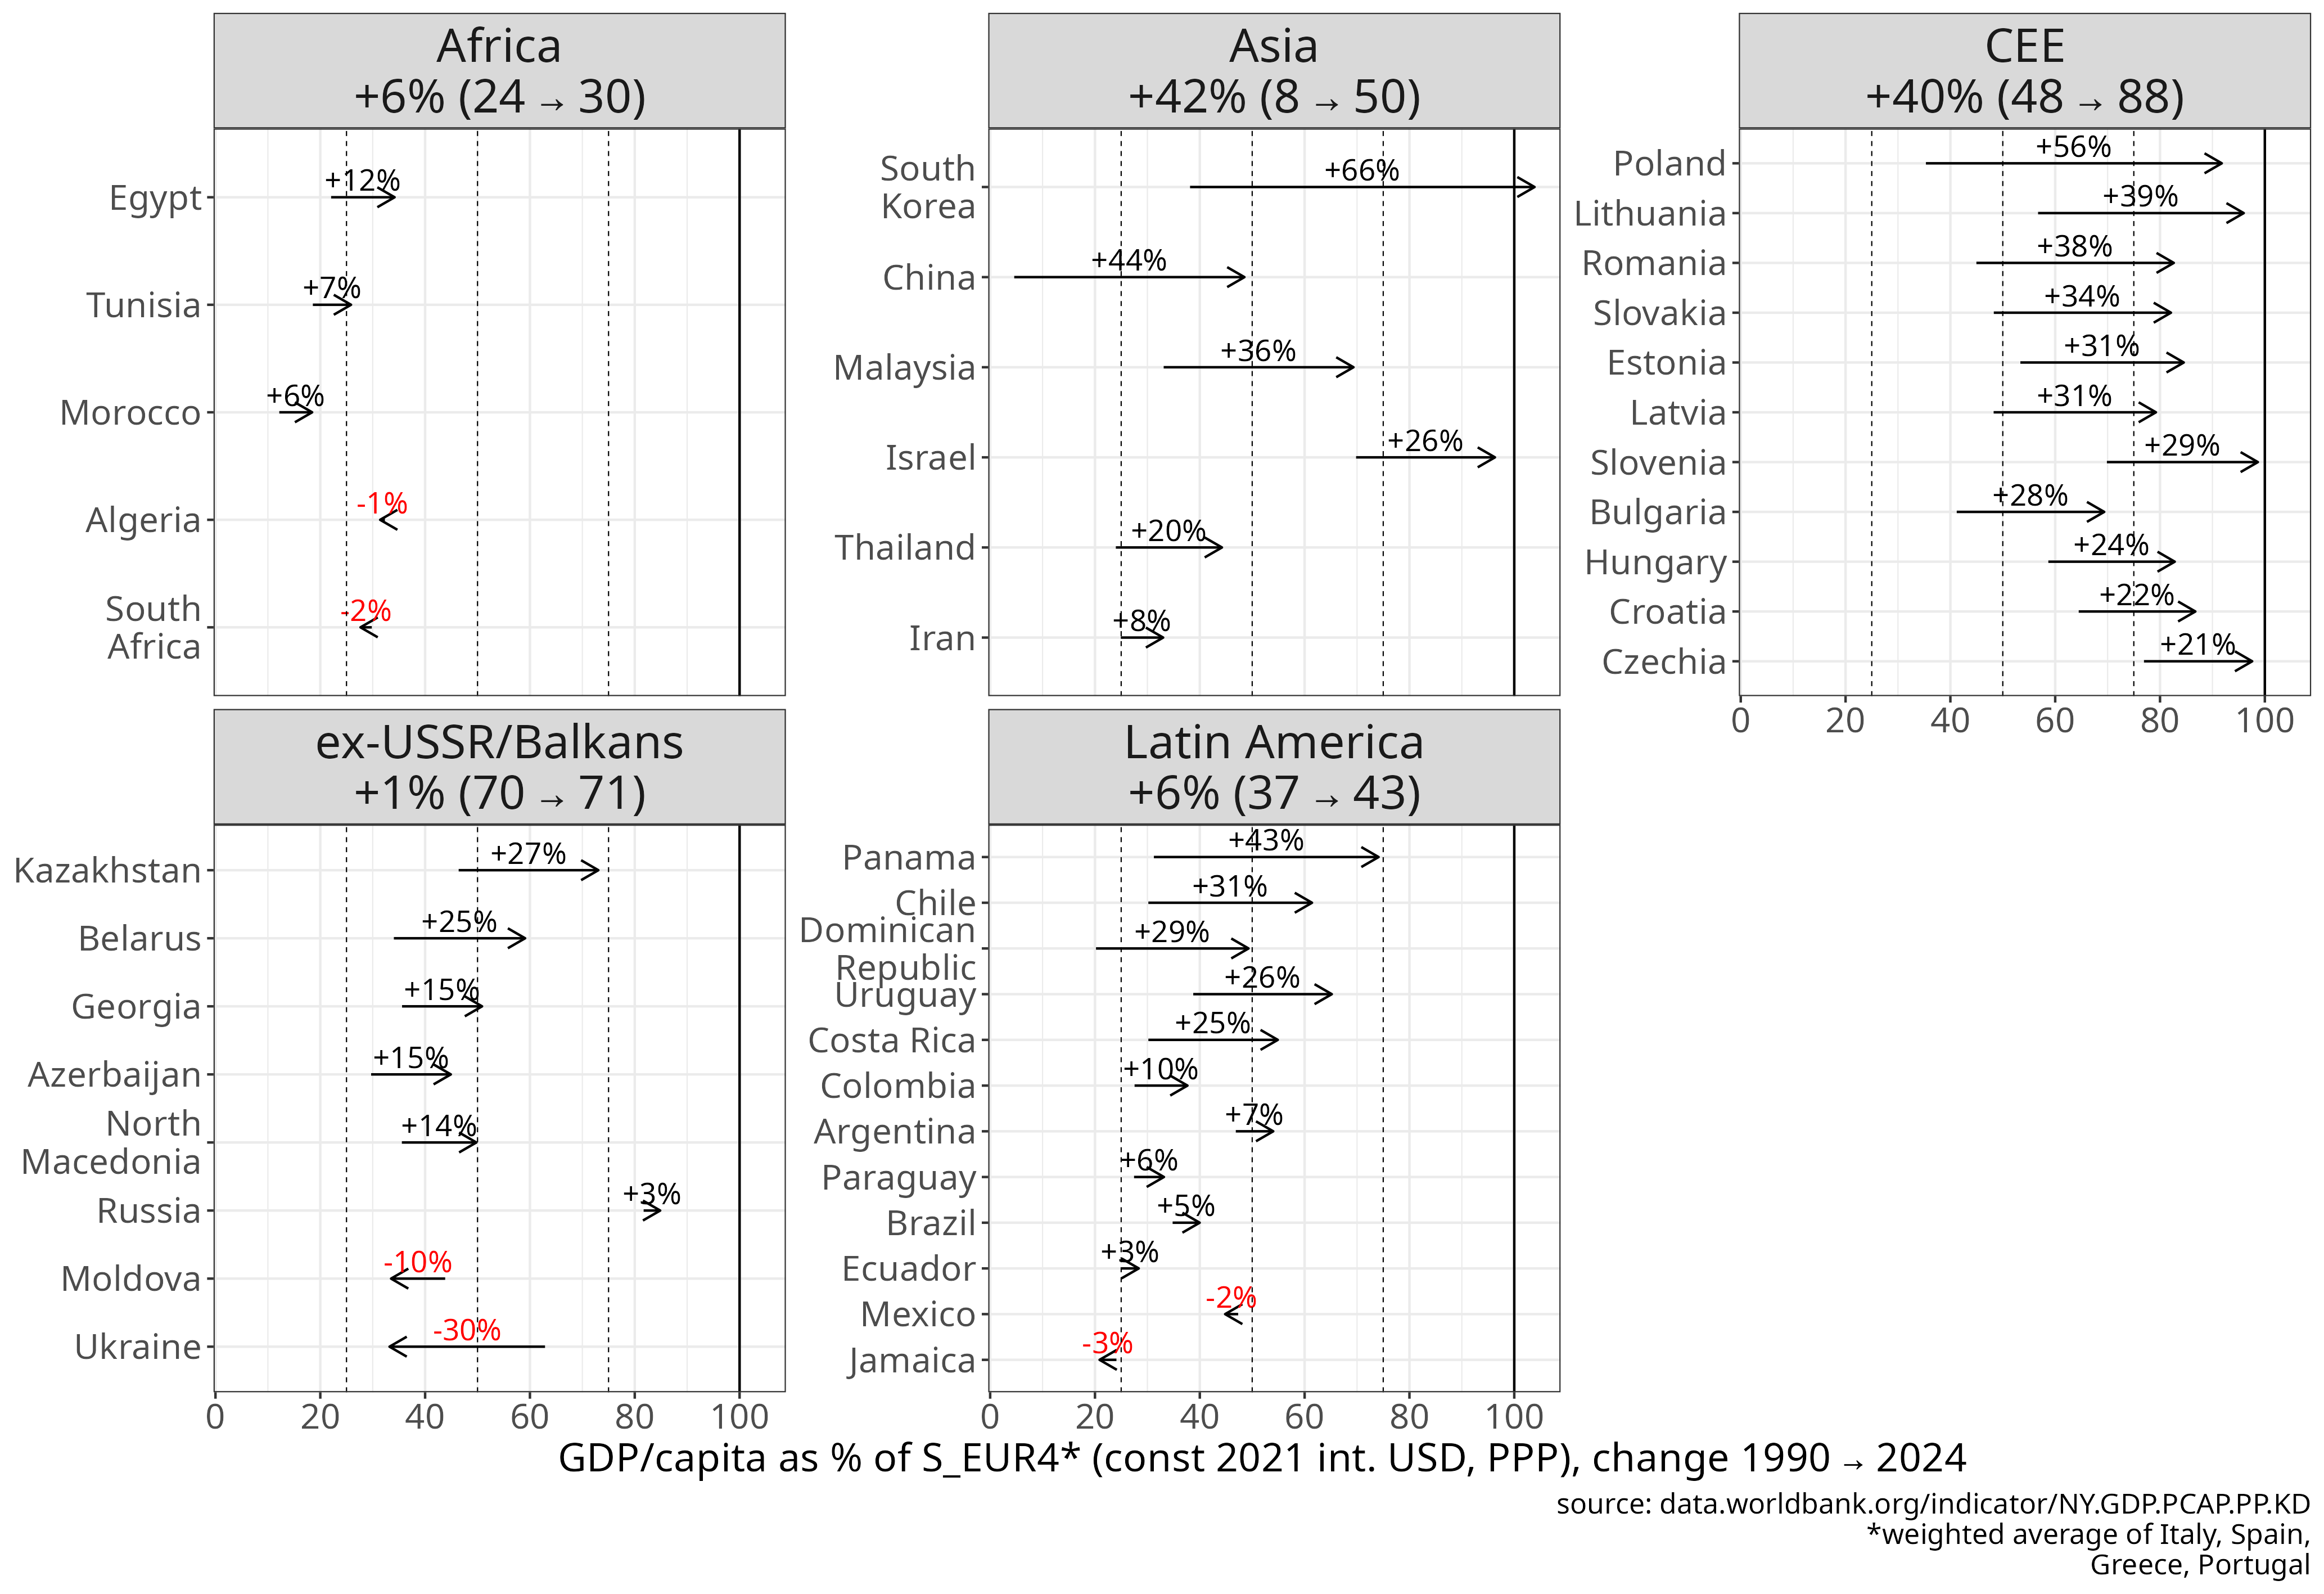
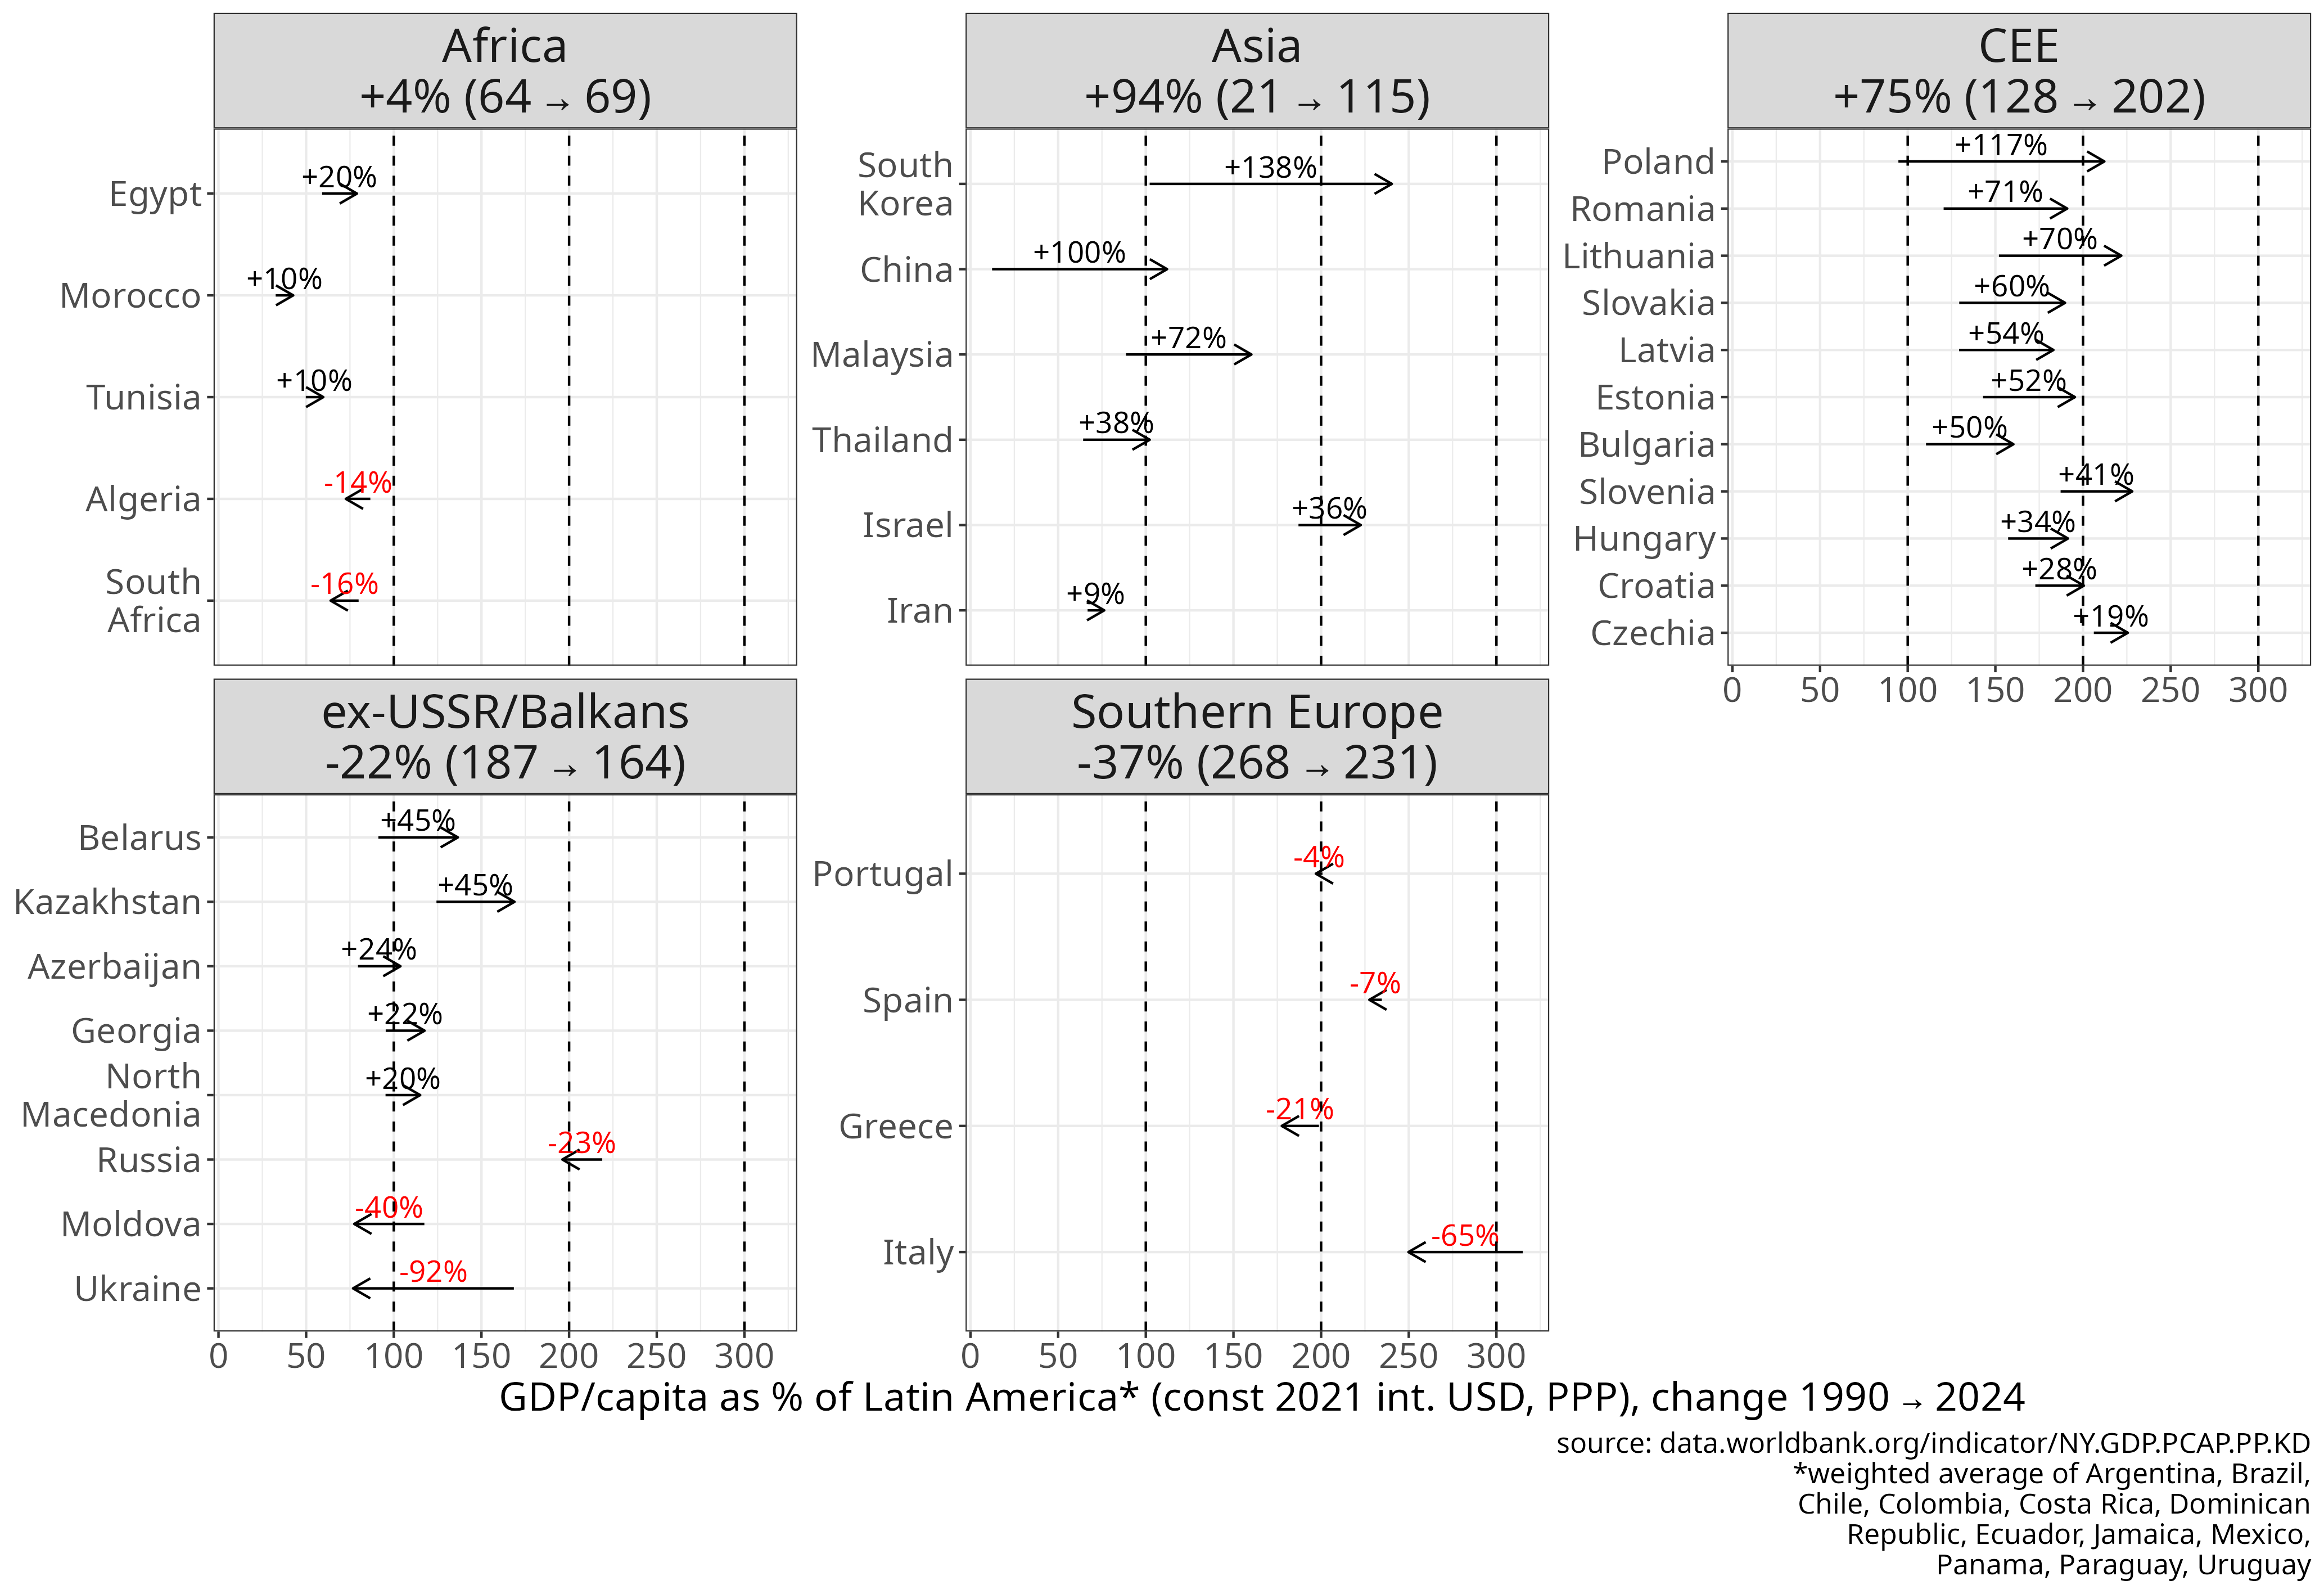
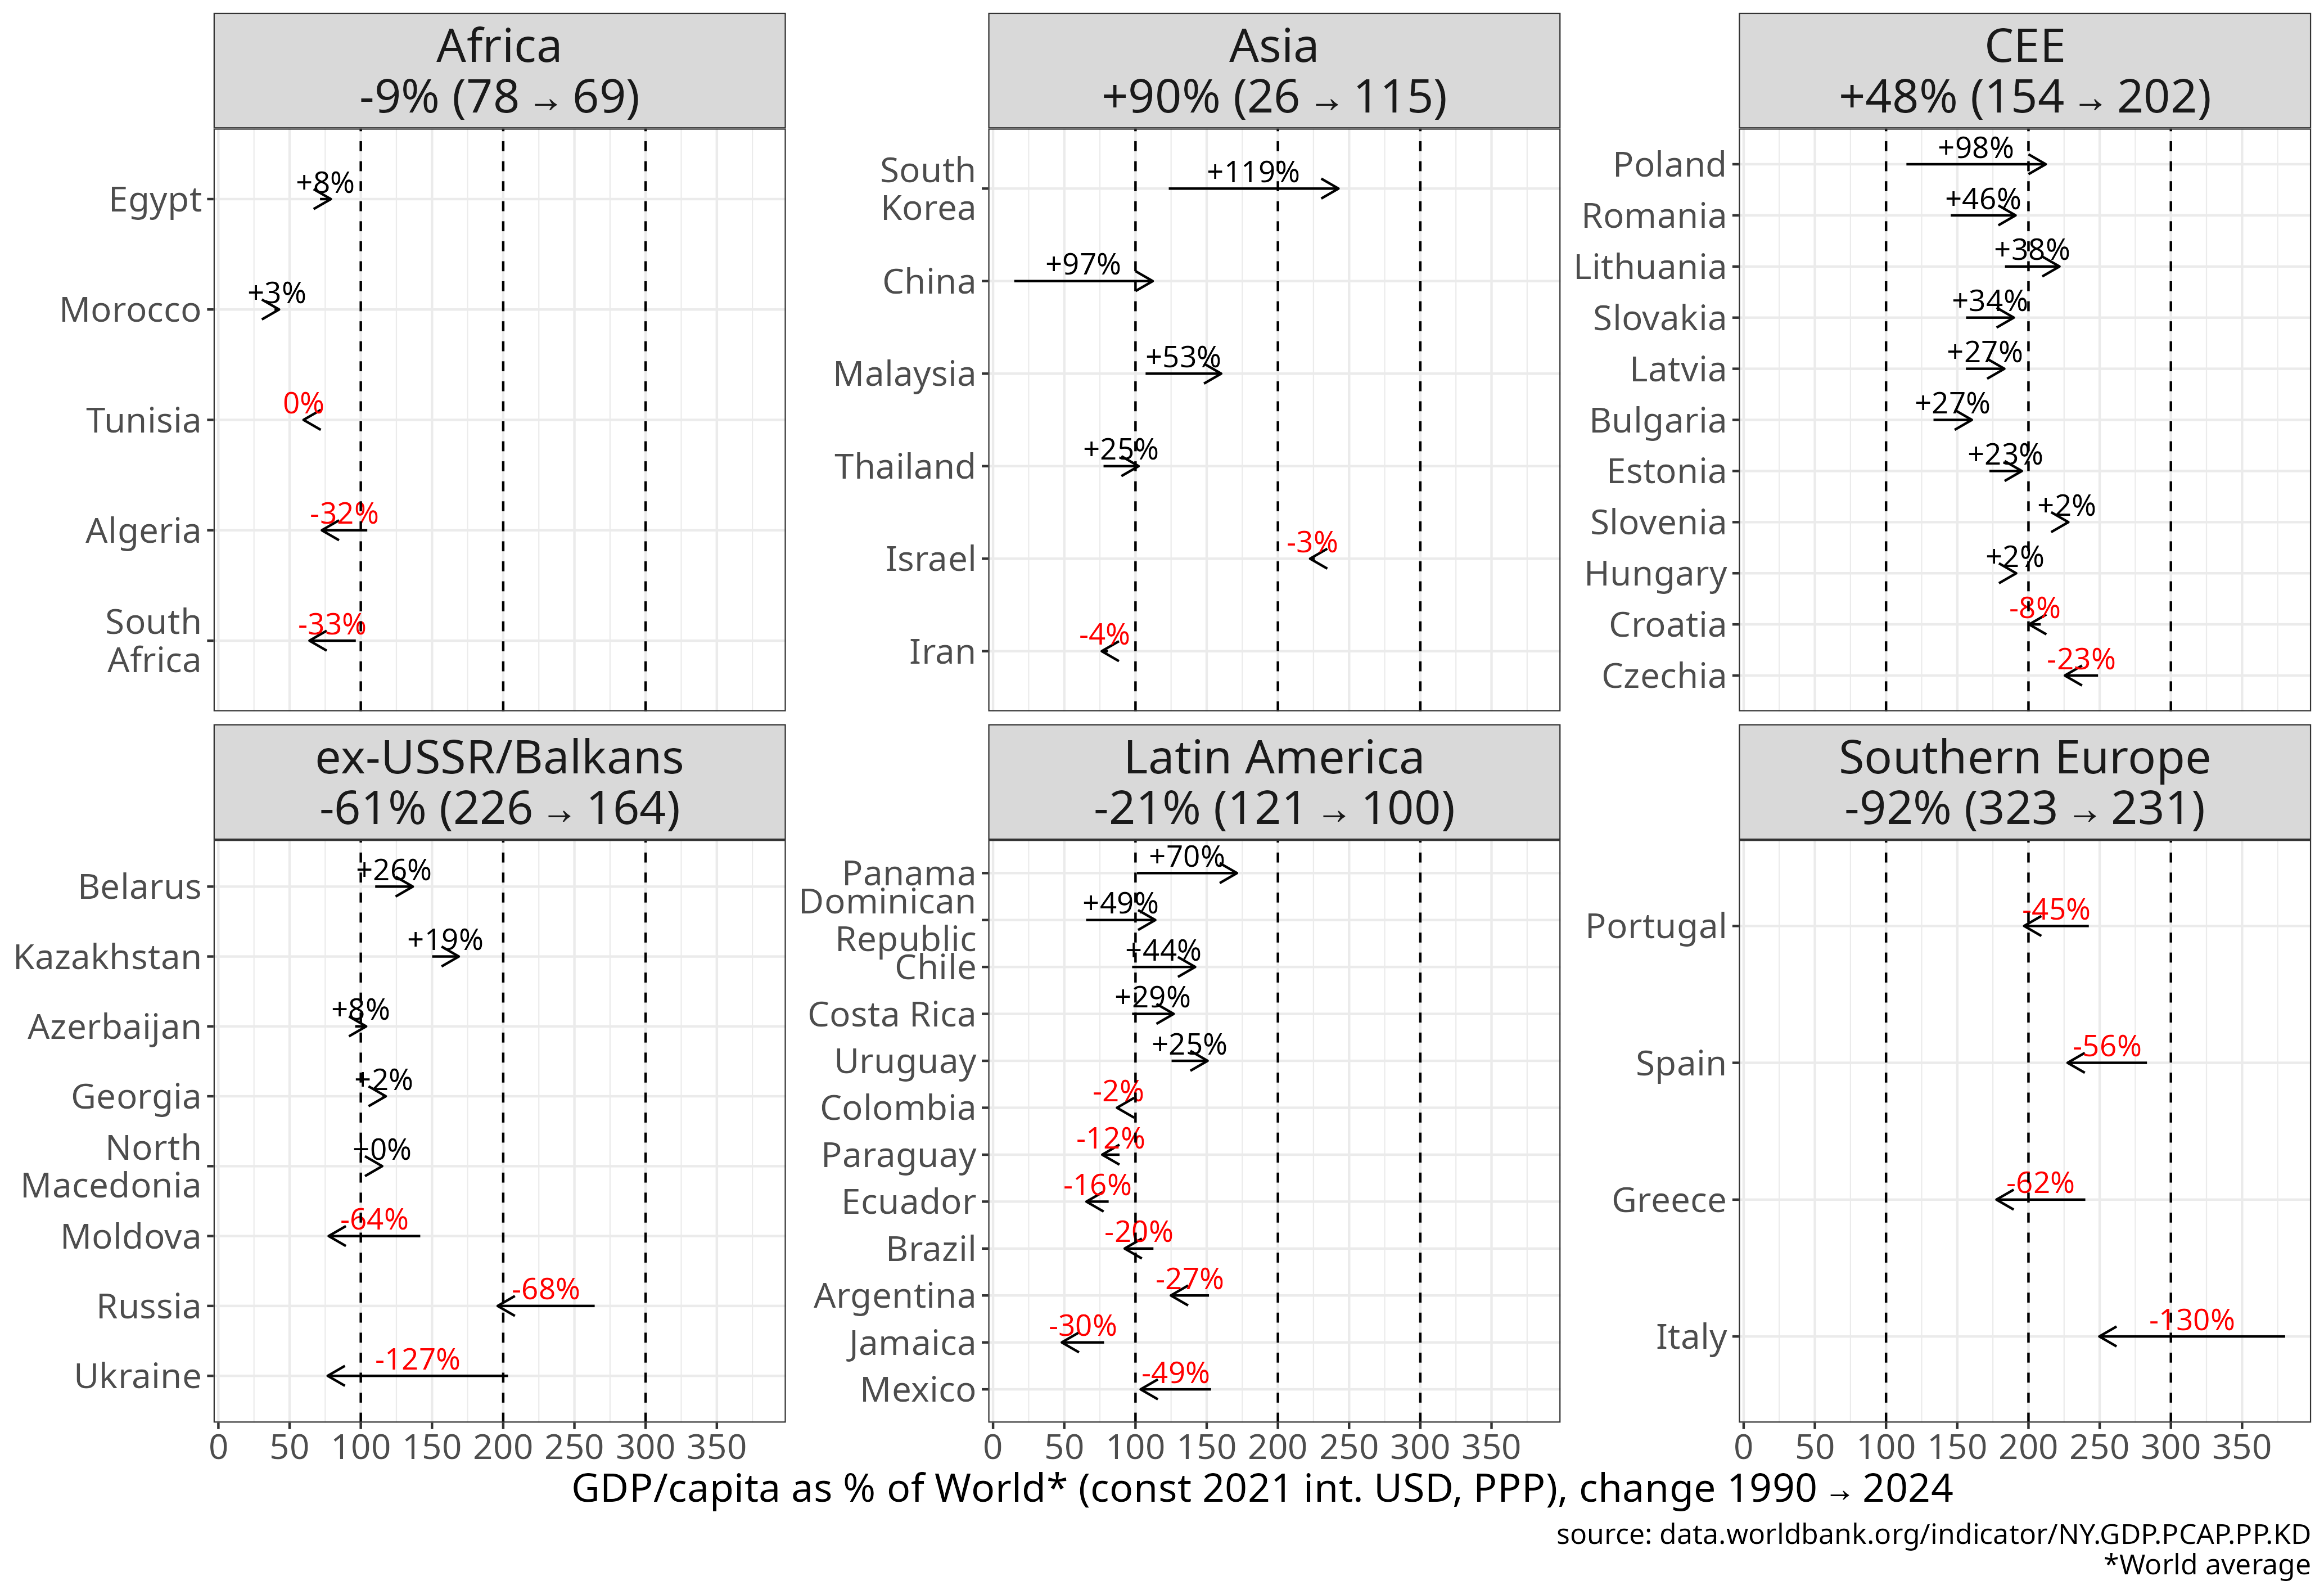
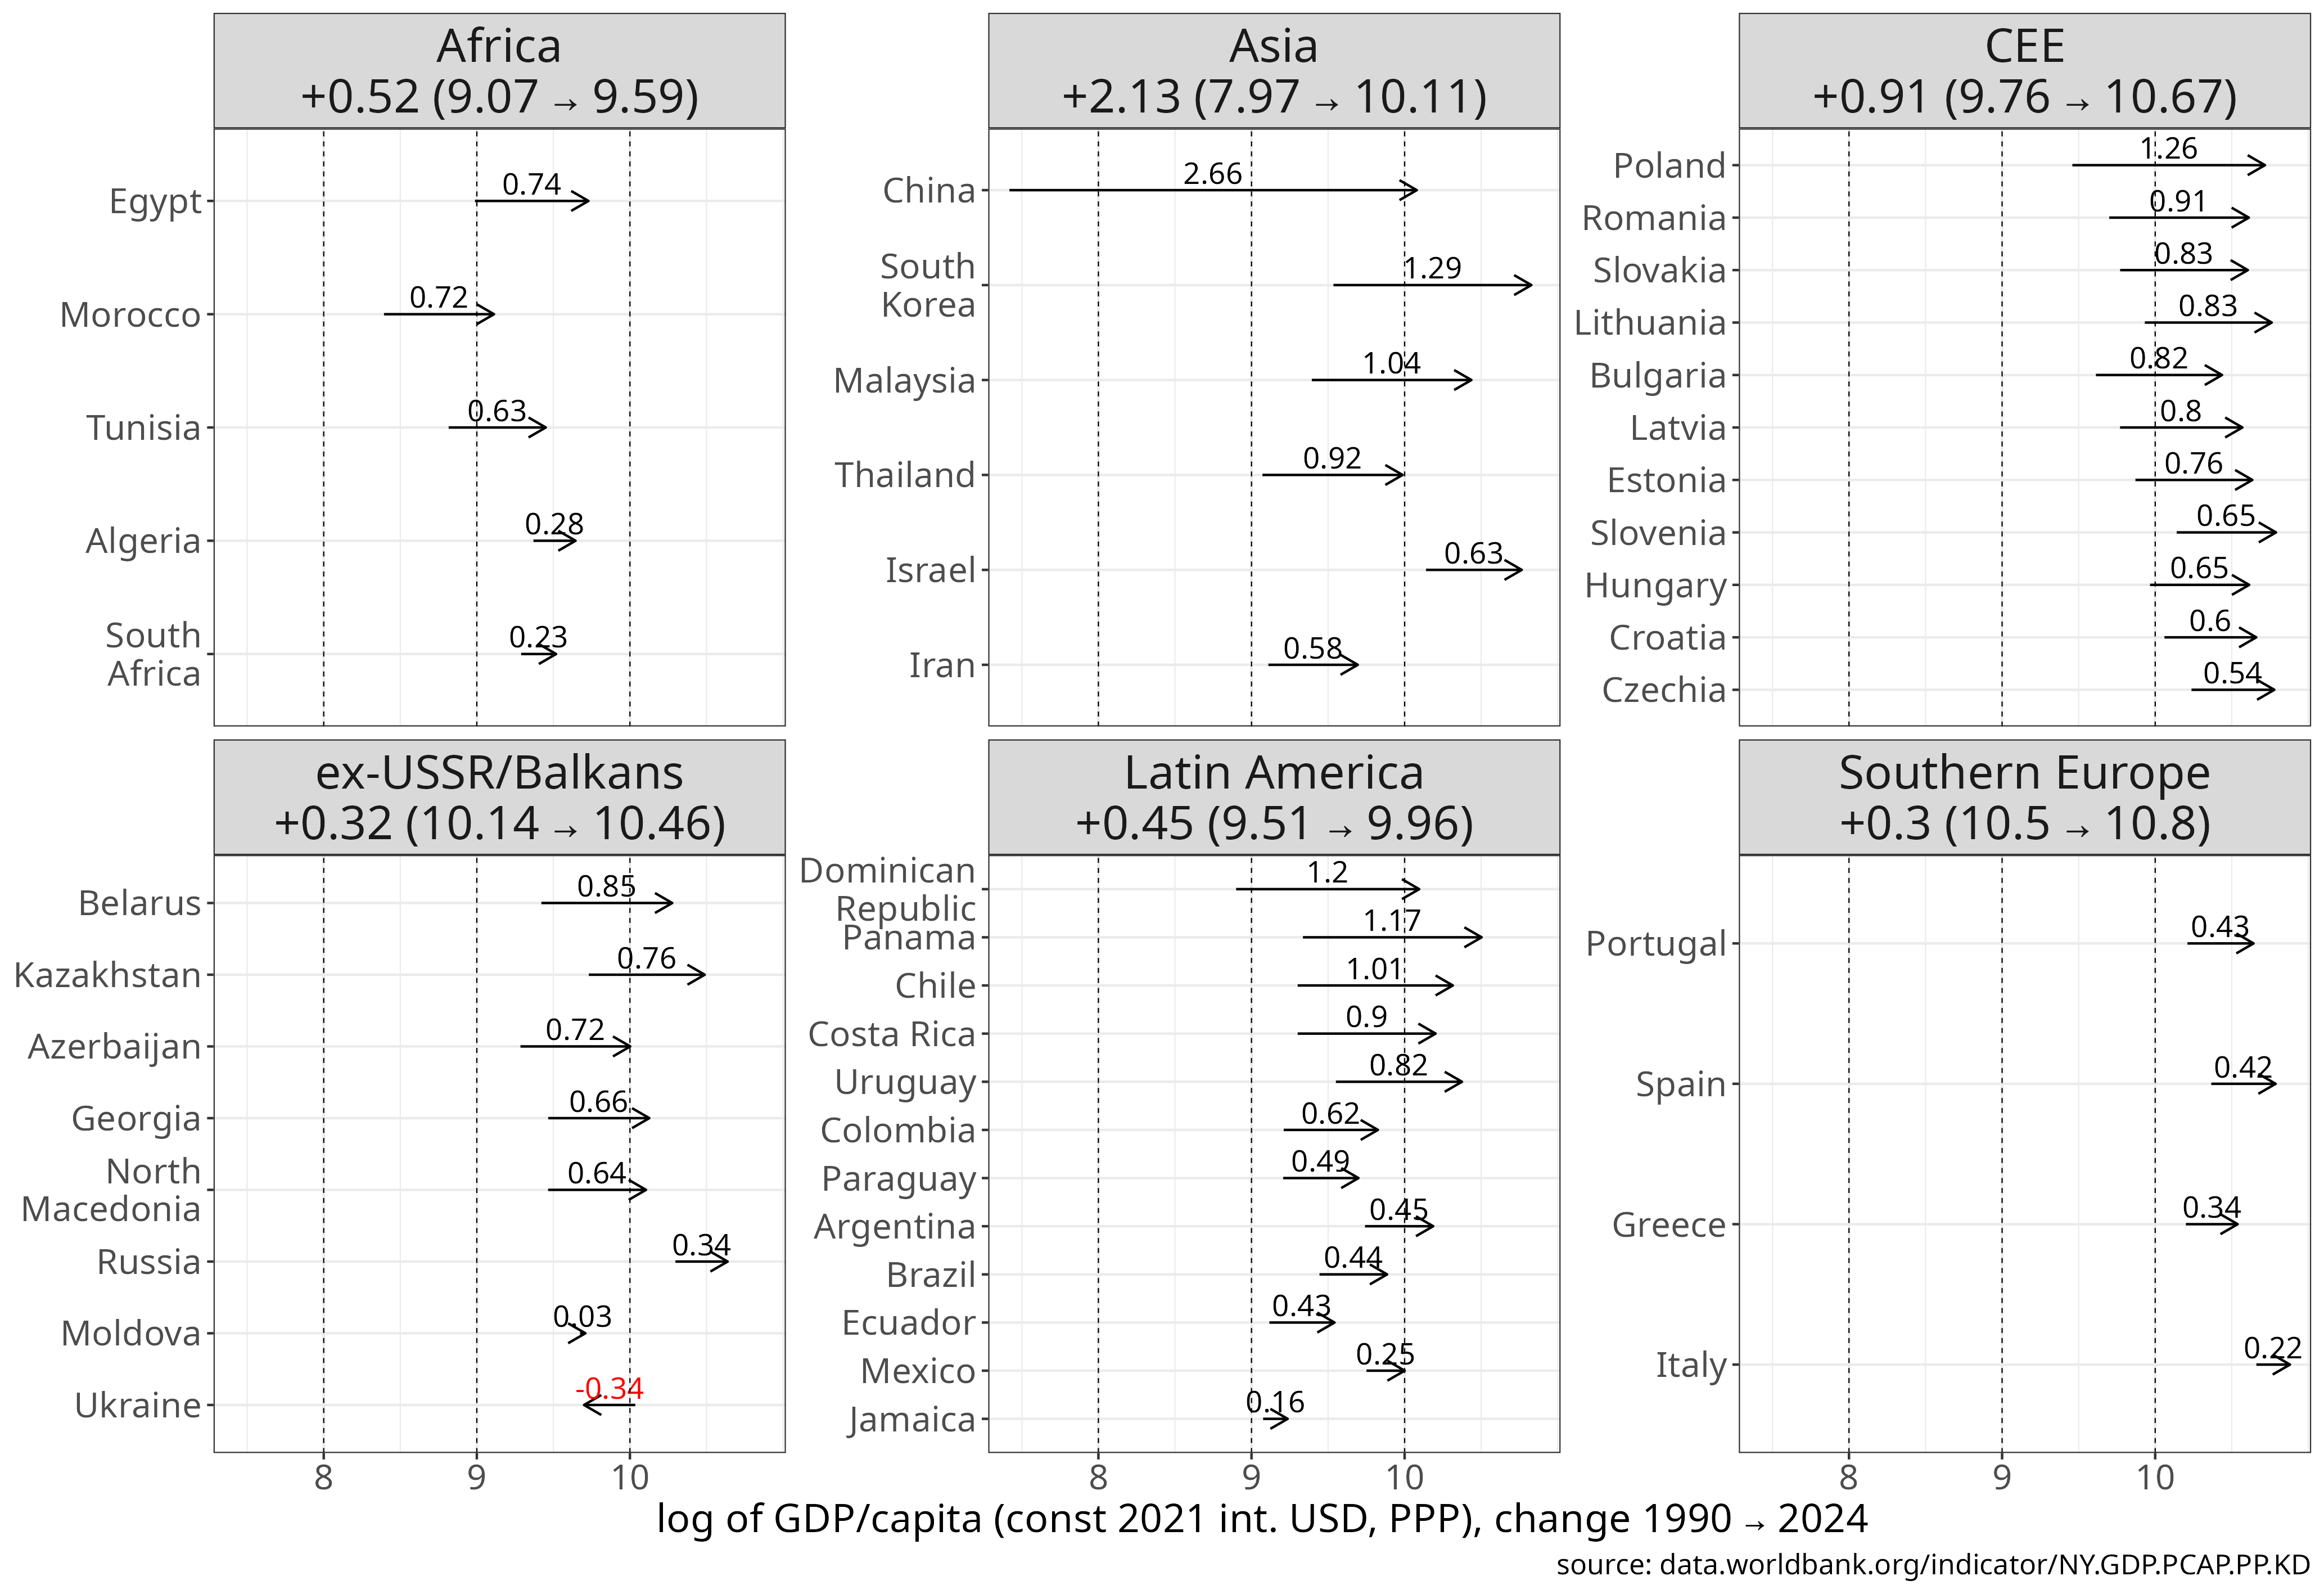
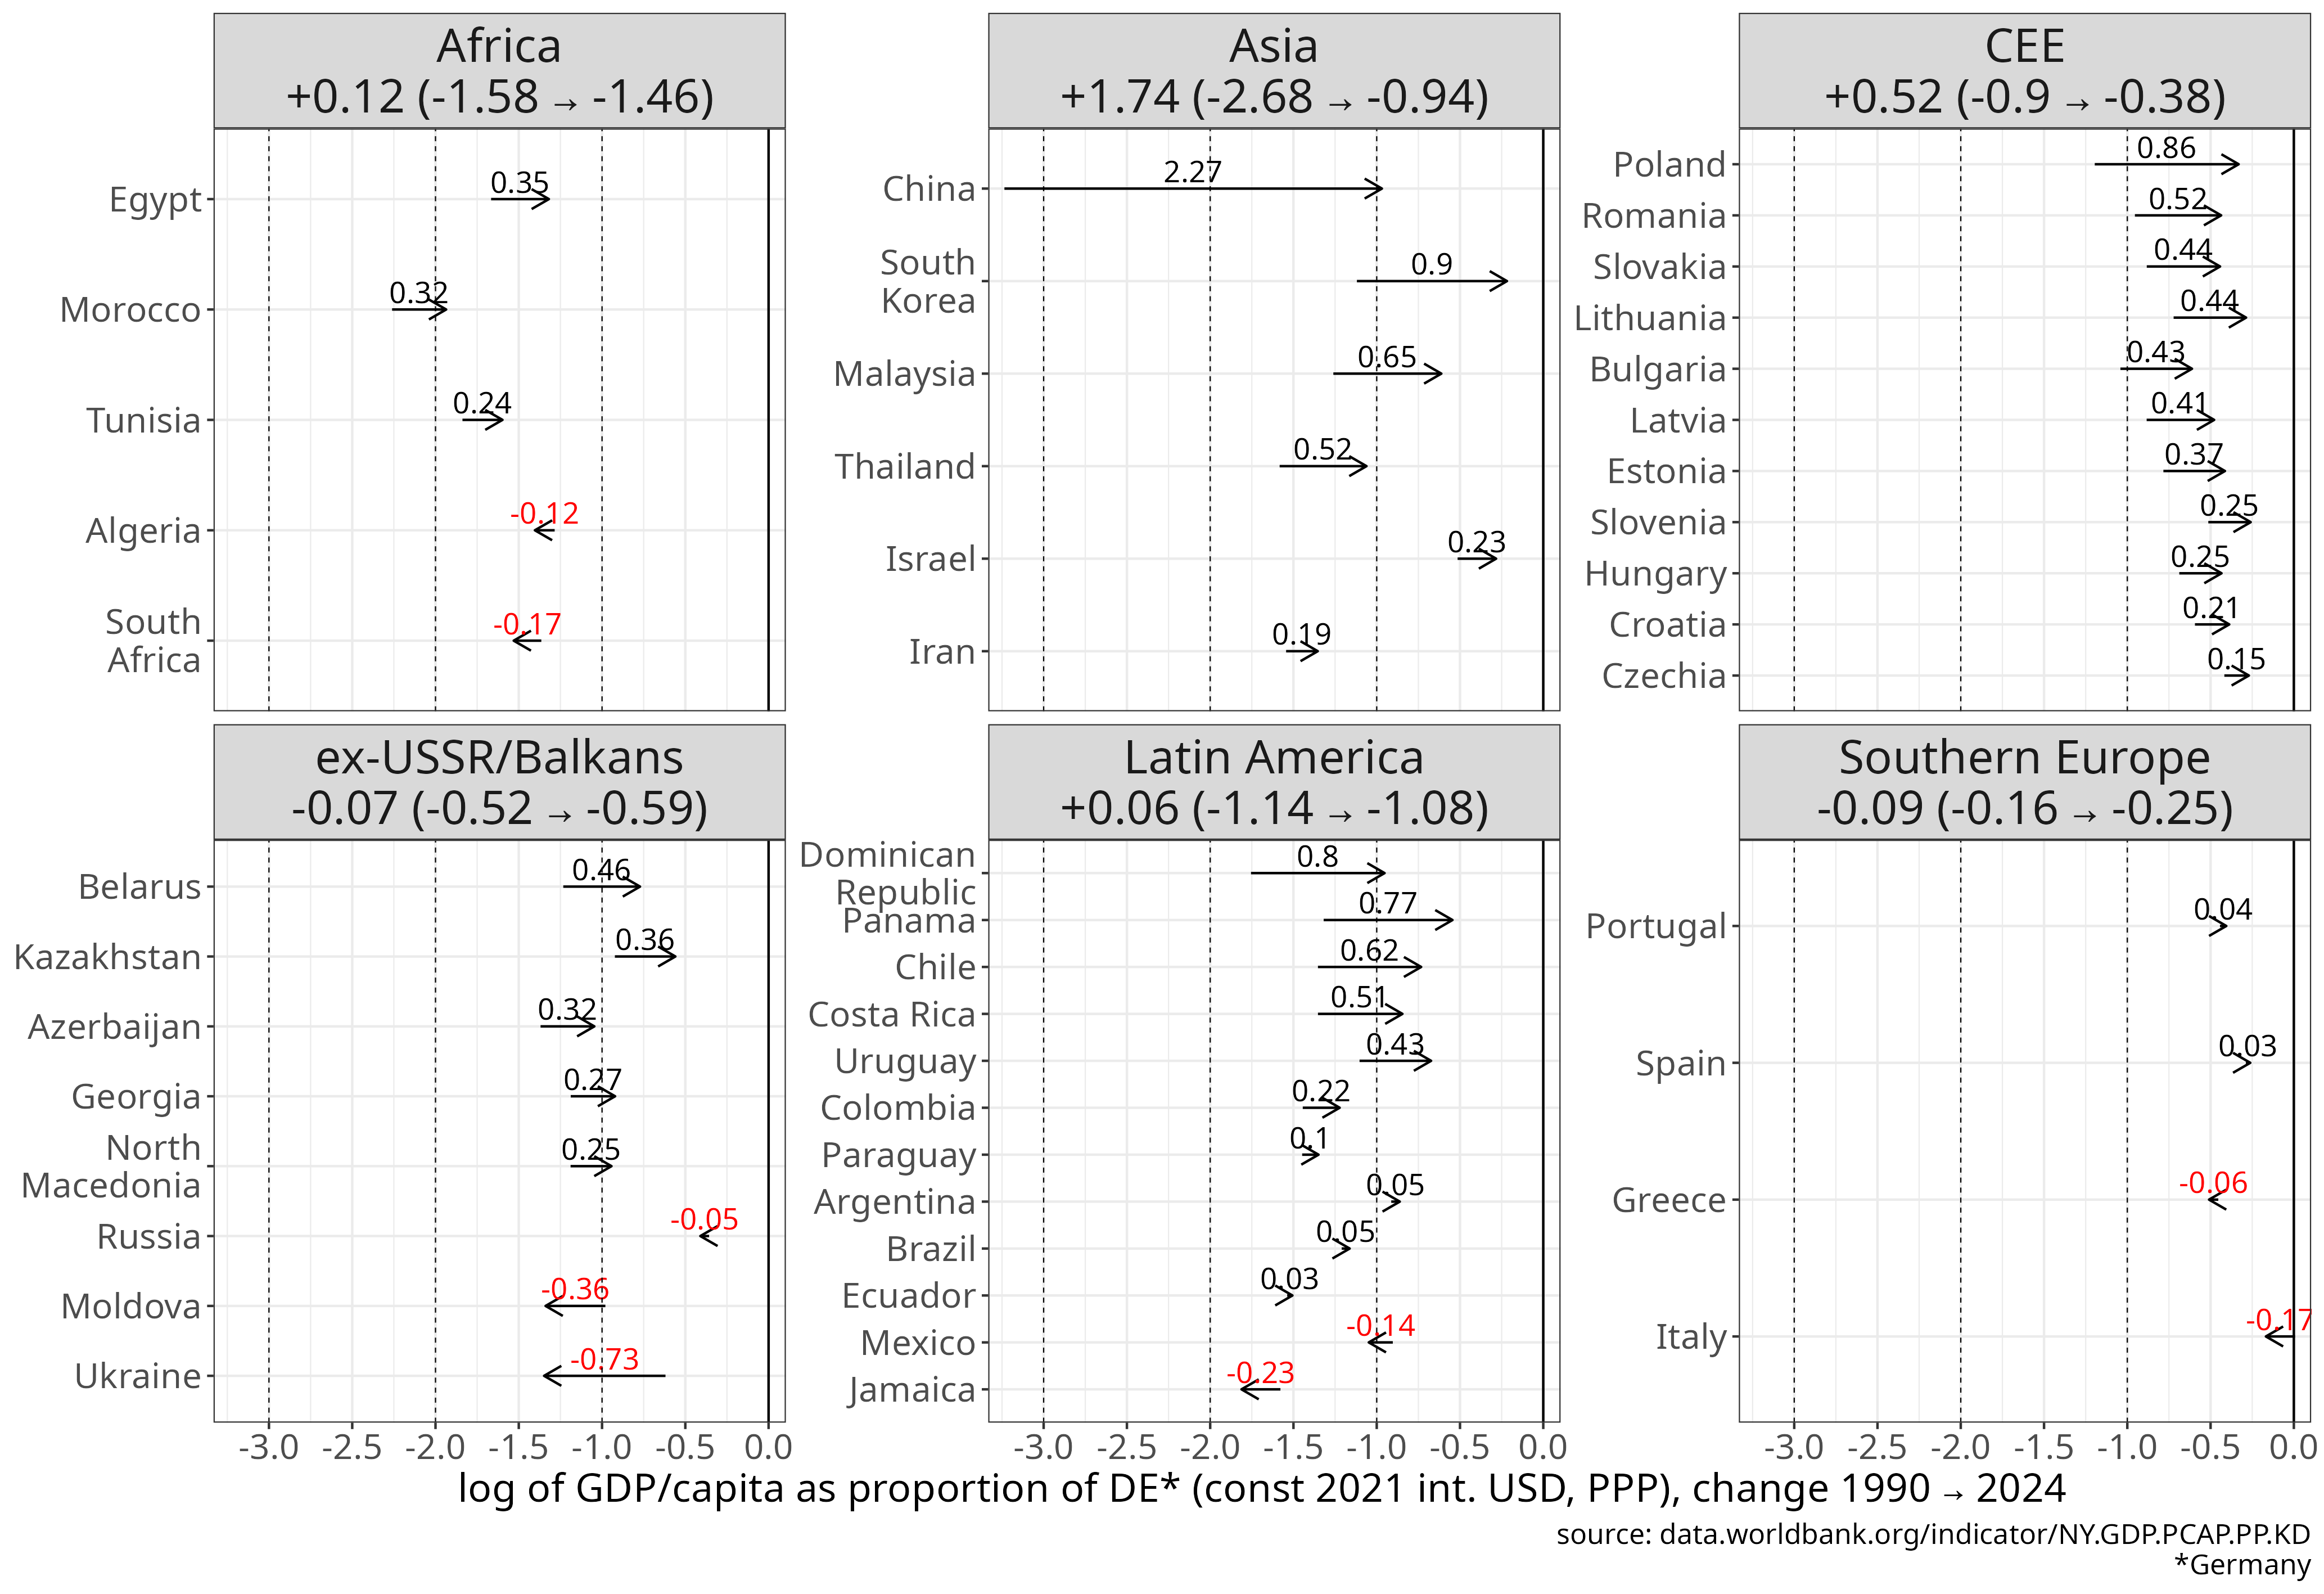
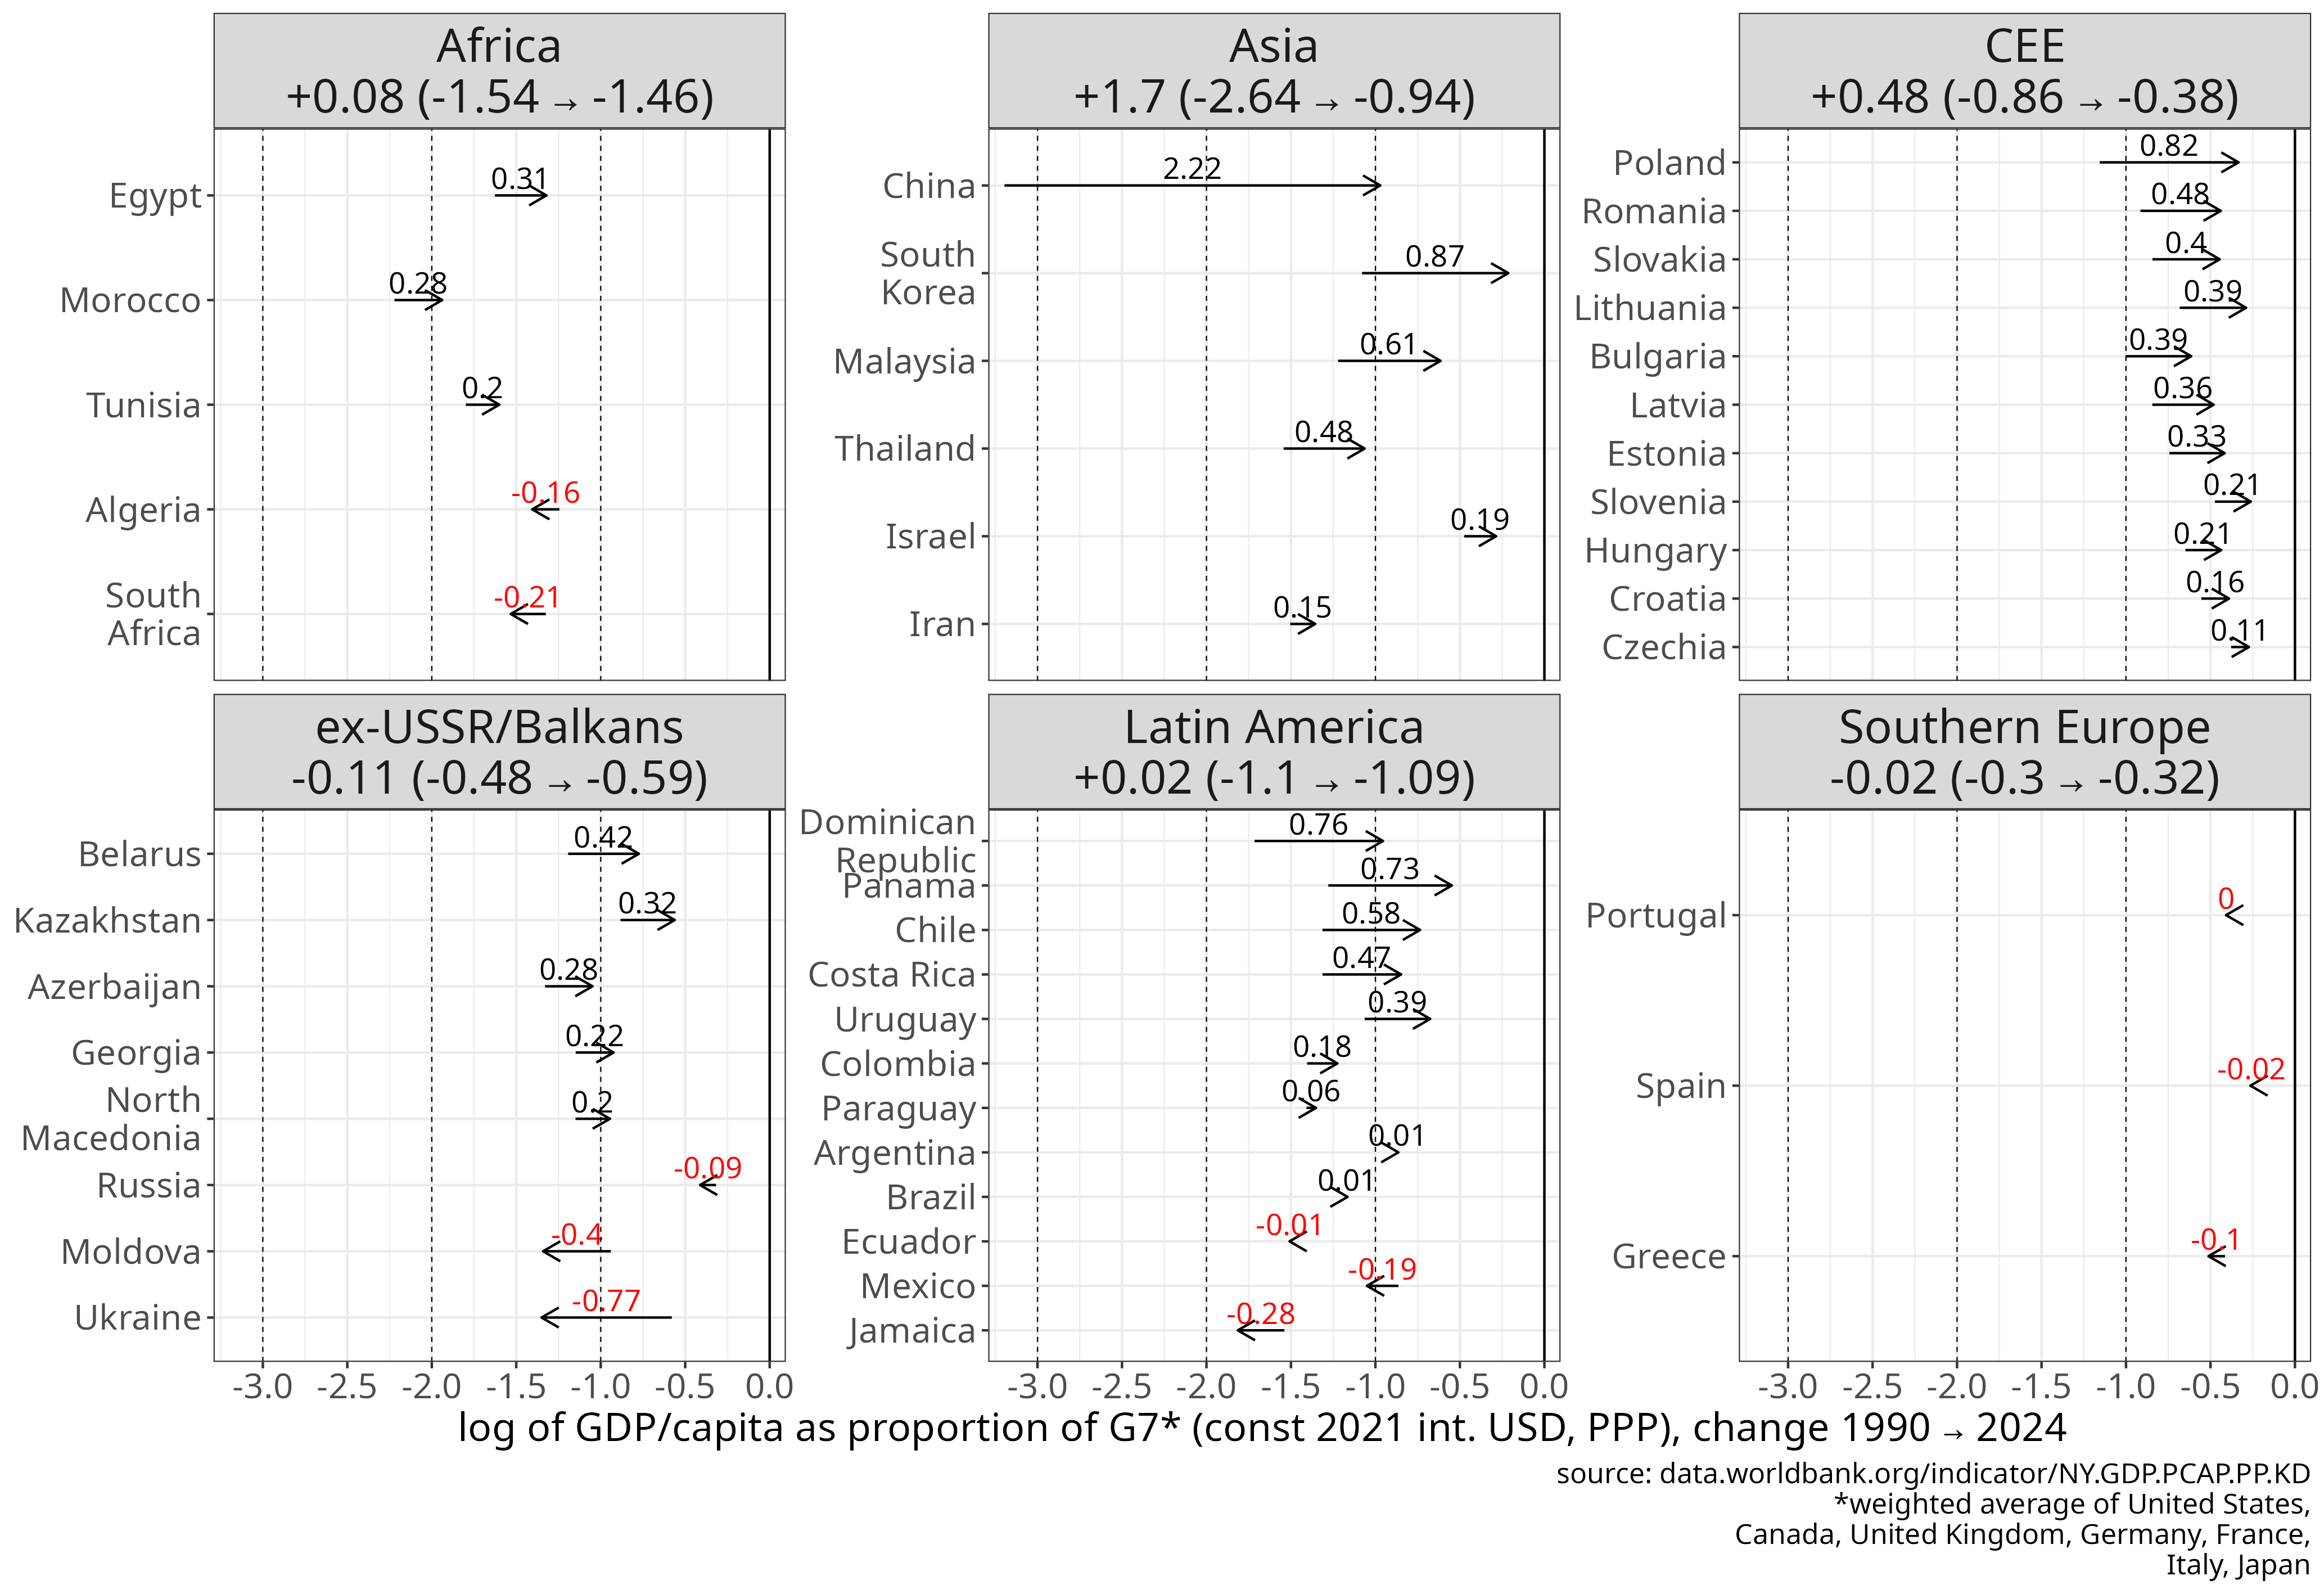
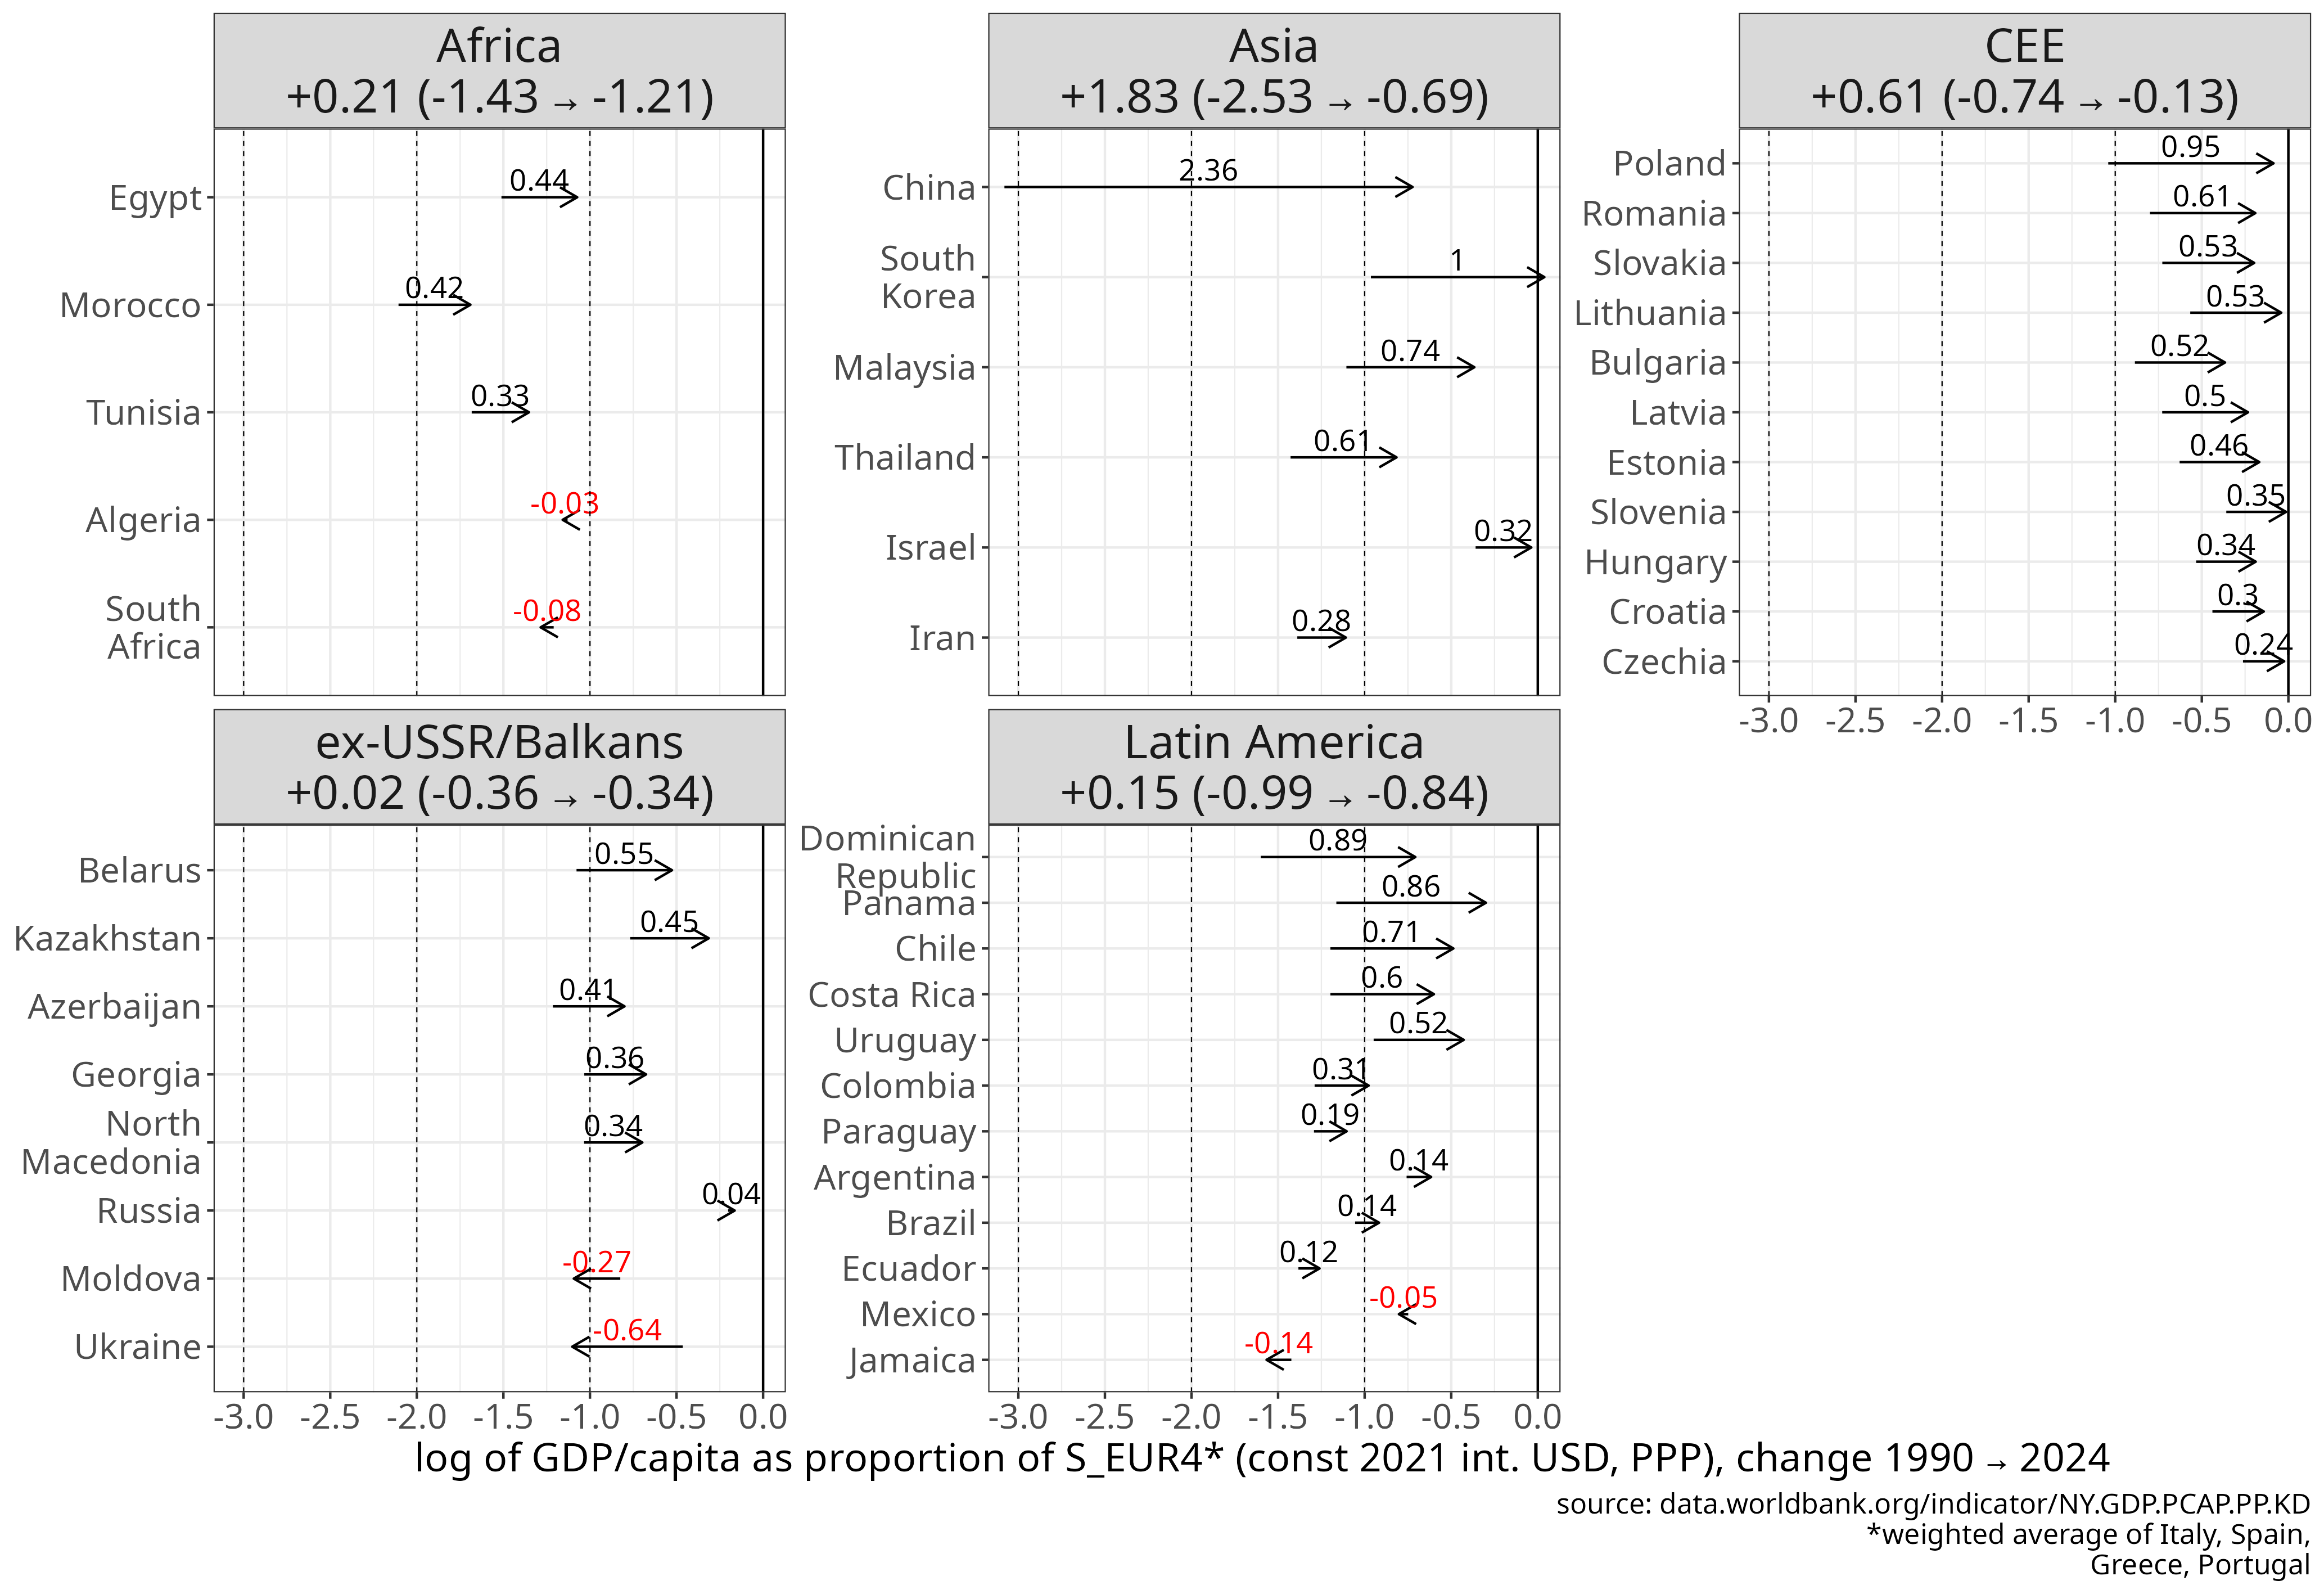
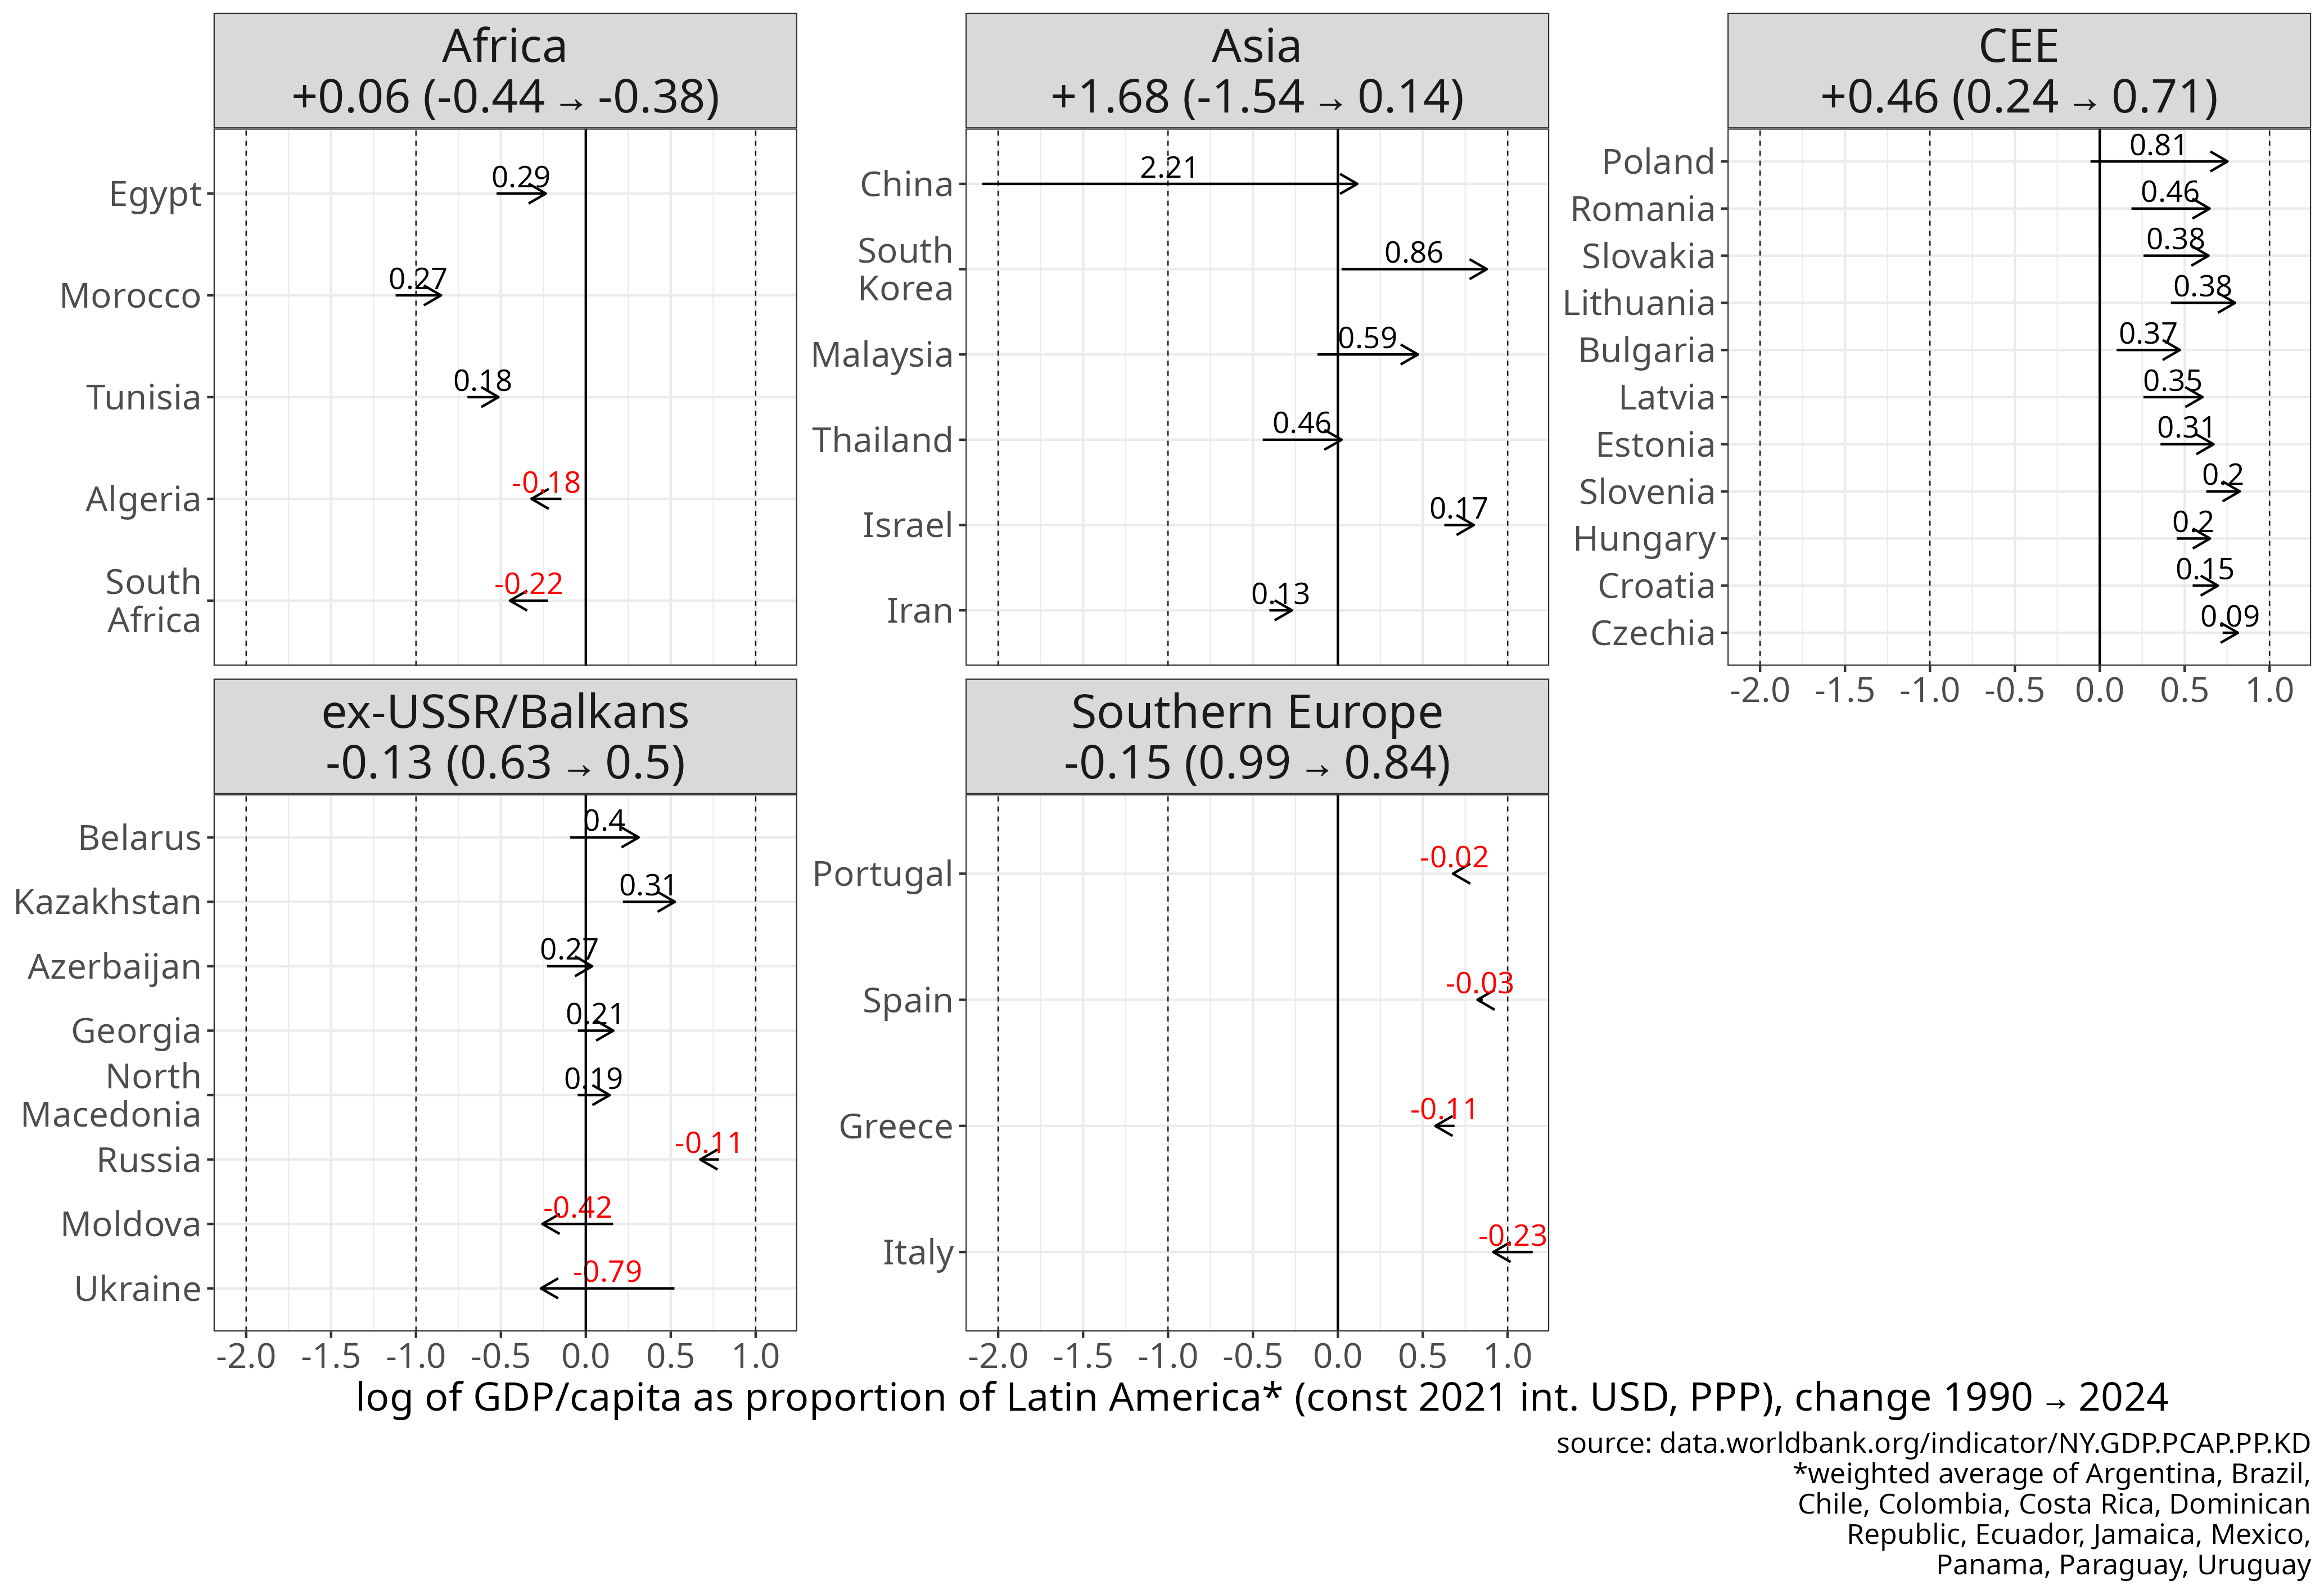
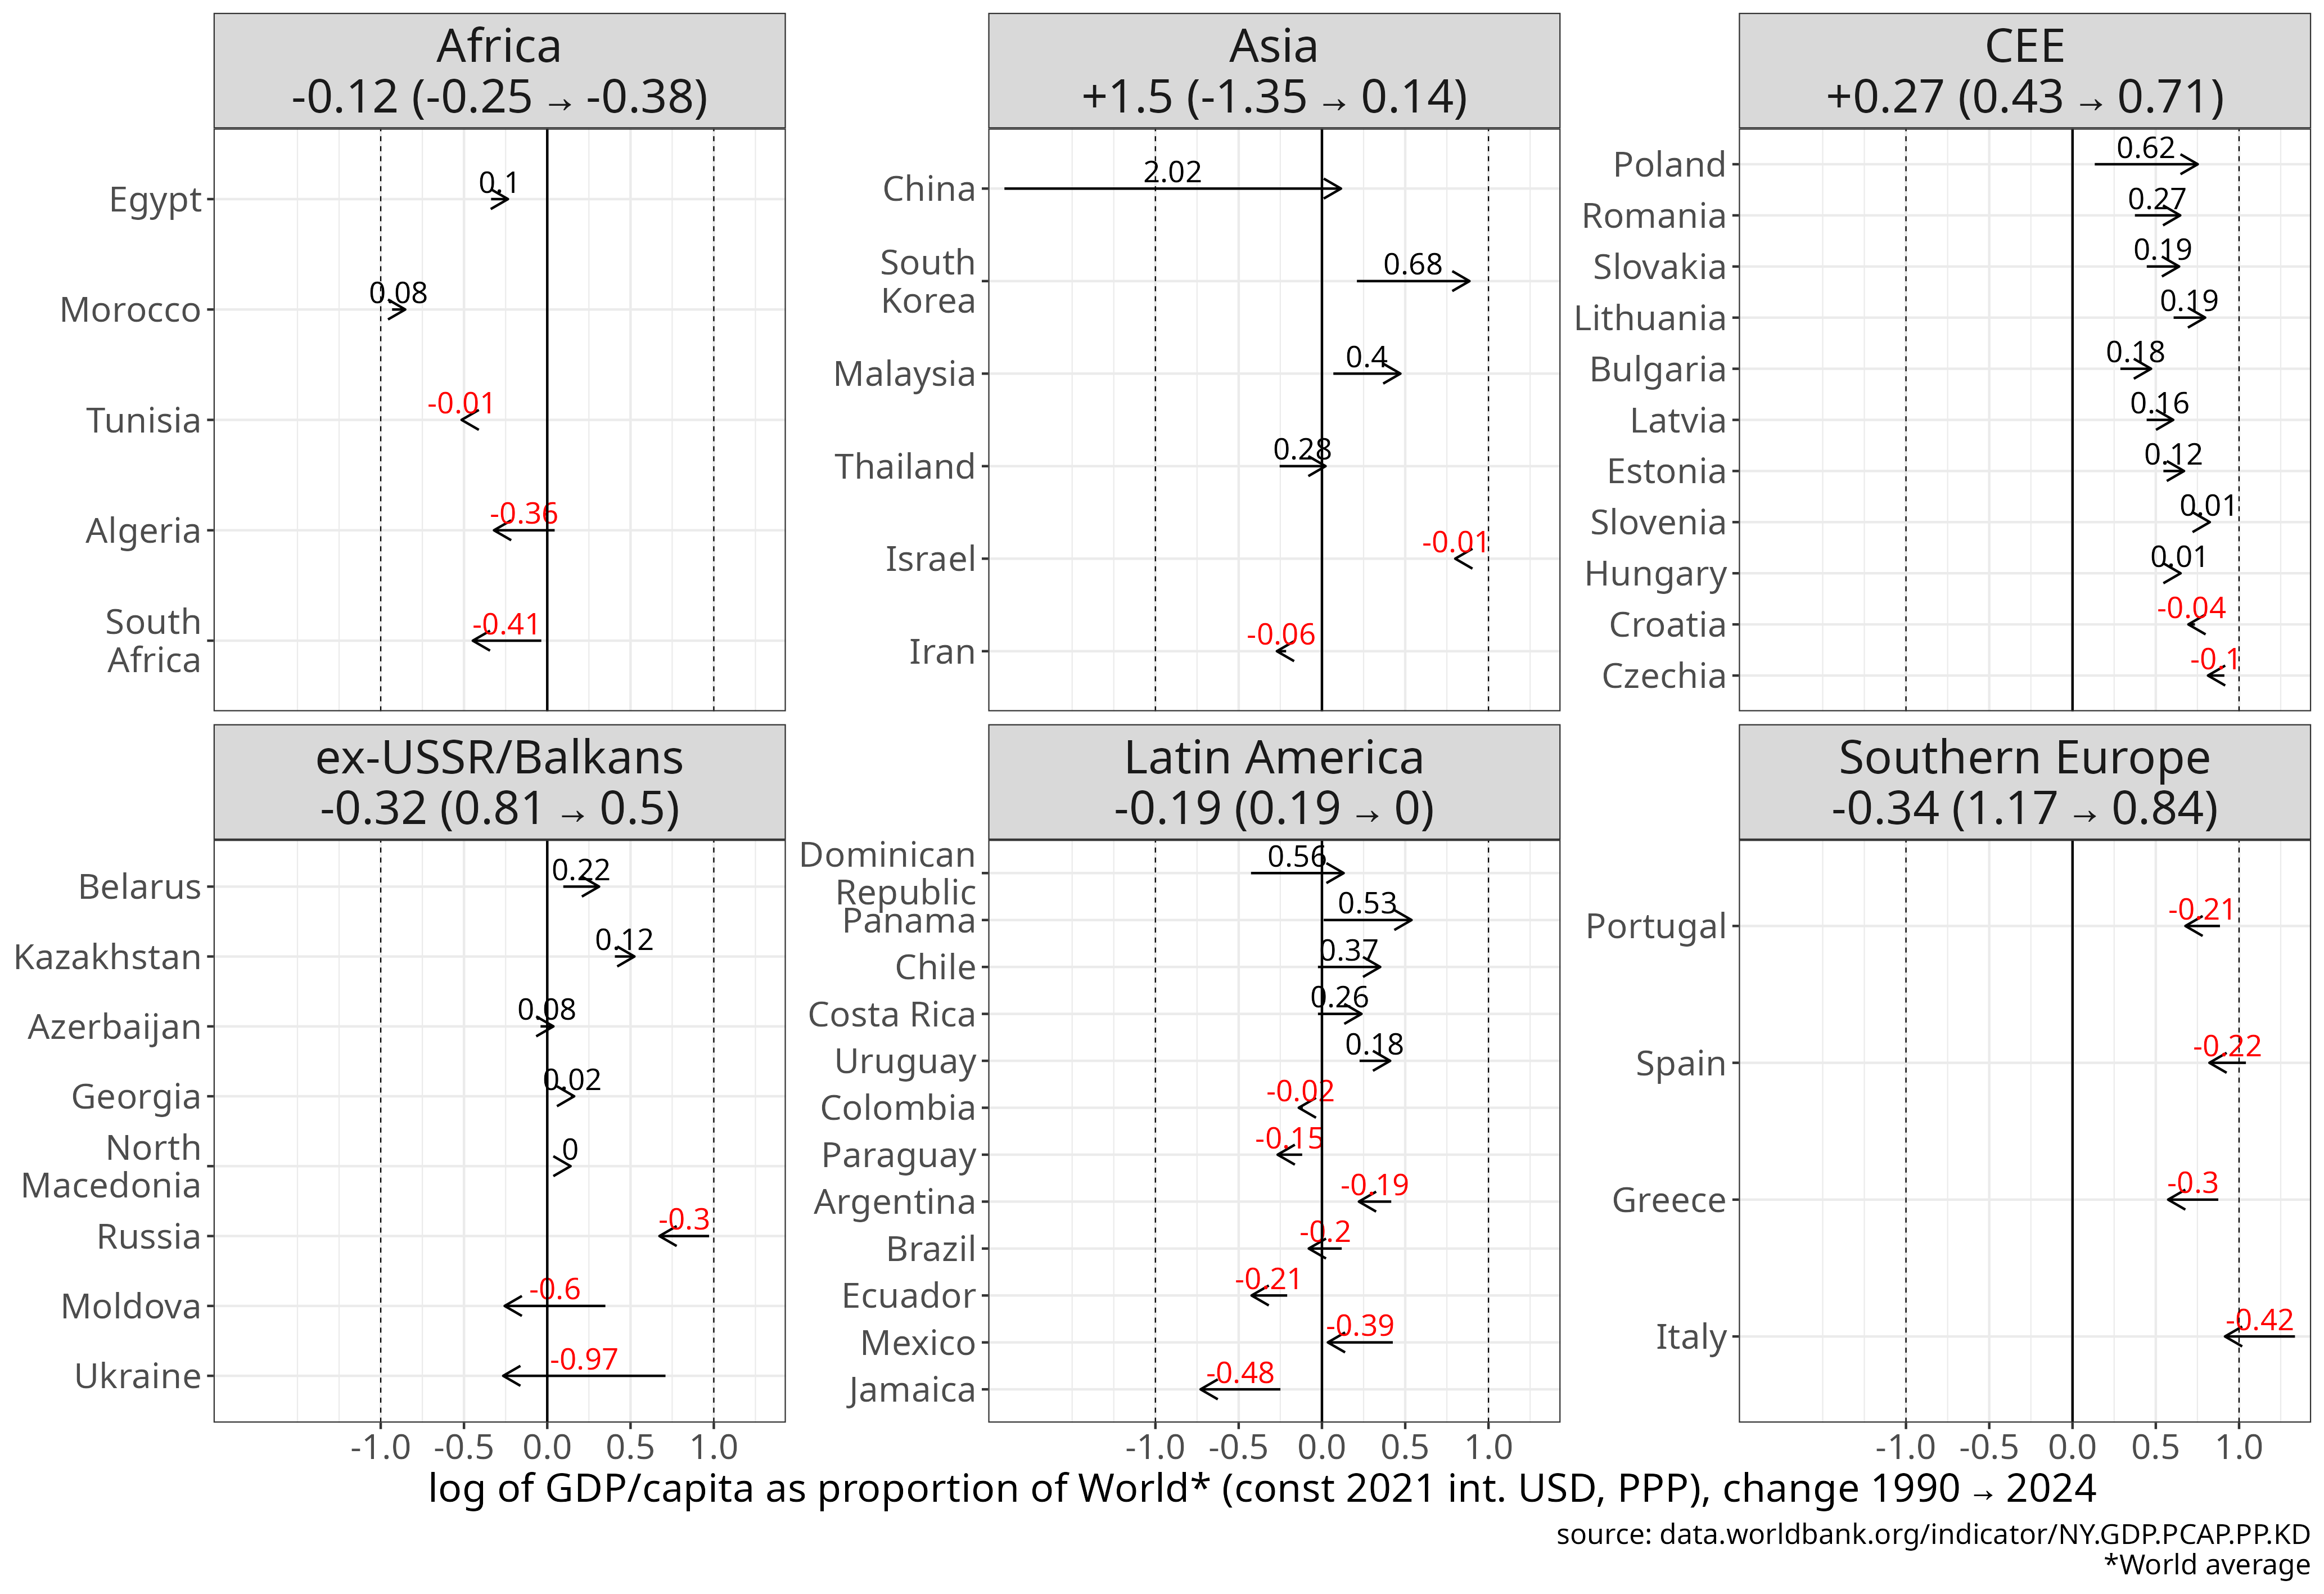
Figure 5
Change in GDP/capita by region since 1990.
Units: absolute values in PPP (constant 2021 international $) or relative to the Western core, Southern Europe, Latin America and World average. Linear scale shows the absolute difference between start and end point. Log scale show the (natural) logarithm of the ratio of the end to start value.
[download plot data]
[source]
If we look at absolute change in constant USD (PPP) first, the weighted average of the CEE region showed the biggest increase in GDP per capita level in the world, going from 17 thousand to 43 thousand USD per capita, an increase of approximately 26k USD.
This is closely followed by the East Asian countries, primarily driven by China’s massive growth from a very low basis.
Expressed as a percentage of the core’s level East Asia’s convergence is marginally larger (31 and 32% compared to DE or the G7) but closely followed by CEE (25 and 27%).
CEE went from approximately 40% of the German level to almost 70% from 1990 to 2024. There are large differences between CEE countries.
Poland (+42% as % of DE), Romania and Lithuania showed the largest increments, while Slovenia and Czechia relatively smaller, but from a higher 1990 baseline, reaching 75% of the German level by 2024.
The gap in convergence with regard to the other world regions is quite dramatic.
East Asia (mainly China, South Korea and Malaysia, to some extent Thailand) and the CEE region showed strong convergence, both climbing approximately 30% closer to the core. In contrast, Africa and Latin America showed almost no convergence at all (+2% in 35 years), while the ex-USSR and Southern European countries actually fell behind; in the ex-USSR region the negative figure is mainly driven by a large fall in Ukraine, but also Russia slowly falling behind.
If we look at relative (fold) change (click on Log) compared to the 1990 baseline, then East Asia’s performance is the strongest, but CEE also showed strong convergence, a 2.5-fold increase in constant USD or 1.6-fold compared to Germany’s level.
Logically, if we use the Latin American or the World average as a benchmark than the Asian and CEE region pulled away: CEE going from roughly parity with Latin America in 1990 to 200% by 2024, and from 150% to 200% of the World average.
In short, measured by GDP per capita, East Asia and CEE showed strong convergence toward the rich core and pulled away from other comparable regions.
In the case of CEE, roughly half of the gap with the Western European core has been closed: the difference was about 60% in 1990 relative to the German reference level, and today it is about 30%.
Meanwhile, East Asia moved from around 10% of the same benchmark to 40%, driven primarily by China.
Over the same period, middle-income Africa has remained stuck at approximately 20%, Latin America at around 30–35%, while the ex-USSR and Southern European regions declined somewhat.
To note, some smaller Latin American countries (Panama, Chile, Dom. Republic, Uruguay and Costa Rica) also showed convergence (from around 25-30% to the 50-60% range), but the weighted average of Latin America was held back by the relative stagnation (Brazil, Argentina) or even decline (Mexico) of its largest econonomies.
But, one might ask, is there perhaps a big difference between GDP and GNI (gross national income)? GNI could be considered a more appropriate measure of economic development, as it takes into account the net (primary) income balance, ie. it only measures the income earned by a country’s residents rather than the value produced within the country’s borders (GDP). The difference can be significant if there are significant foreign investments within a country that result in large outflows of profits, or vice versa if a country receives substantial income on its residents’ investments outside the country. Figure 6 shows the same metrics as Figure 5 for GNI per capita.
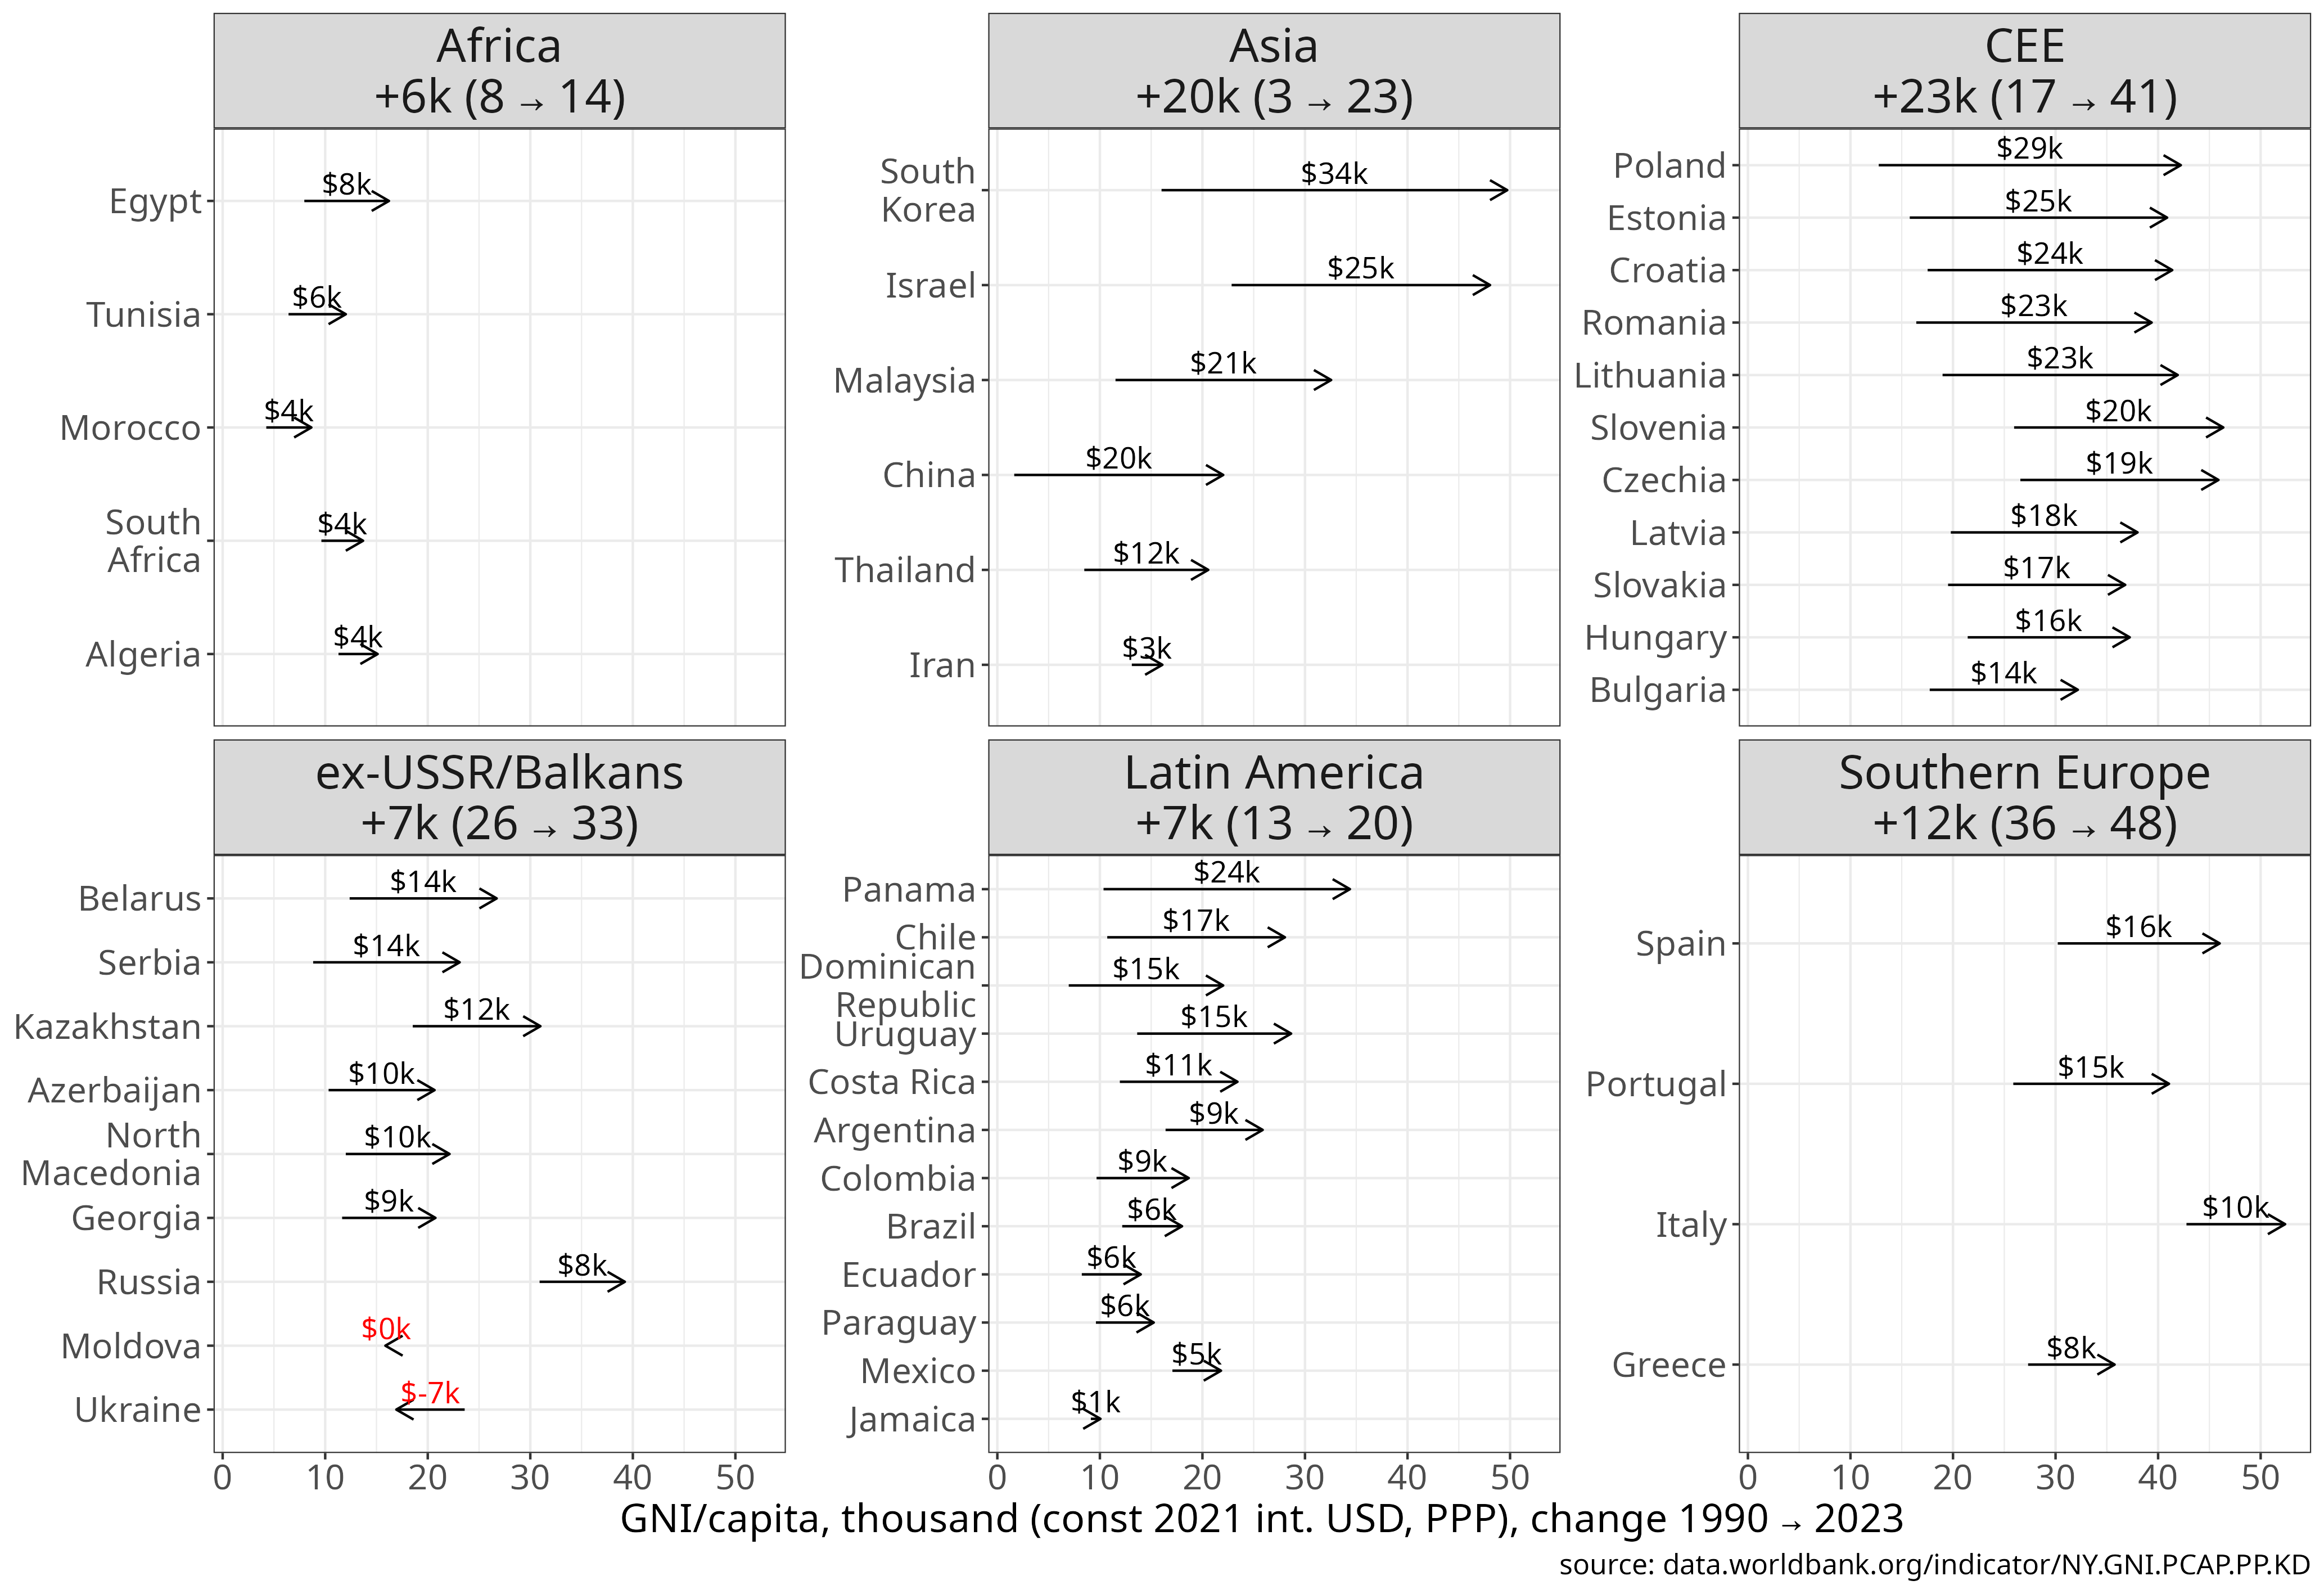
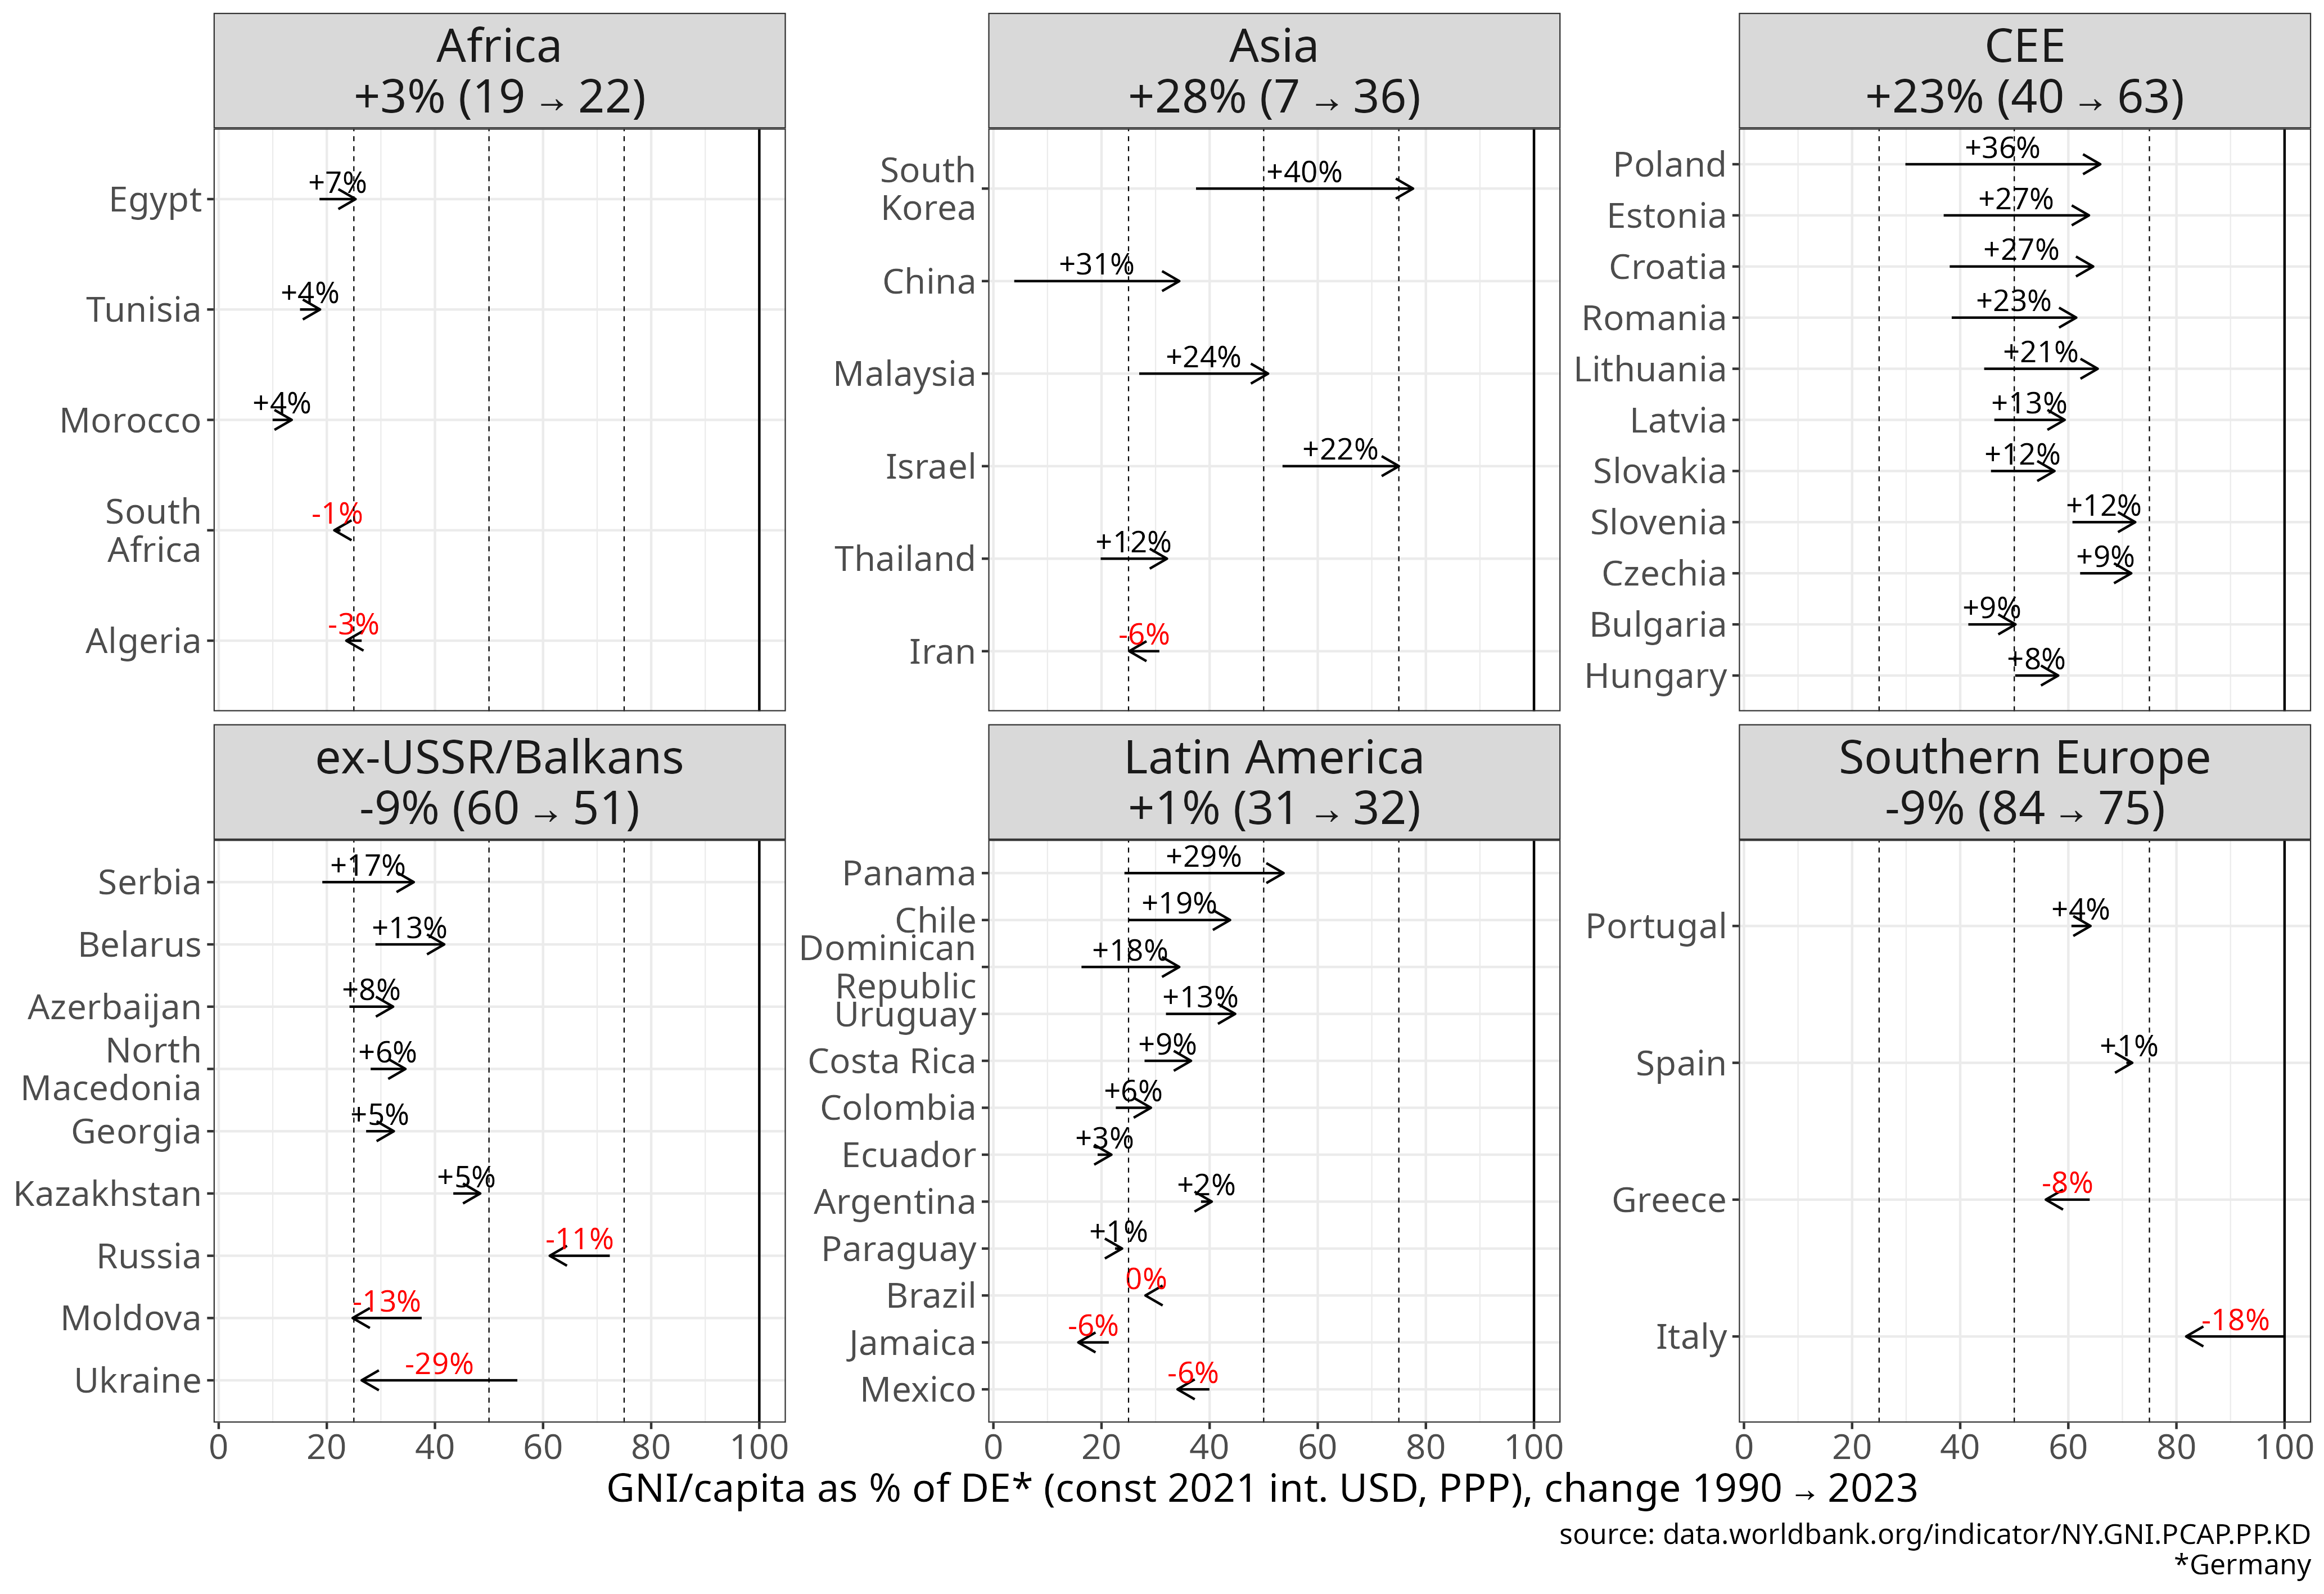
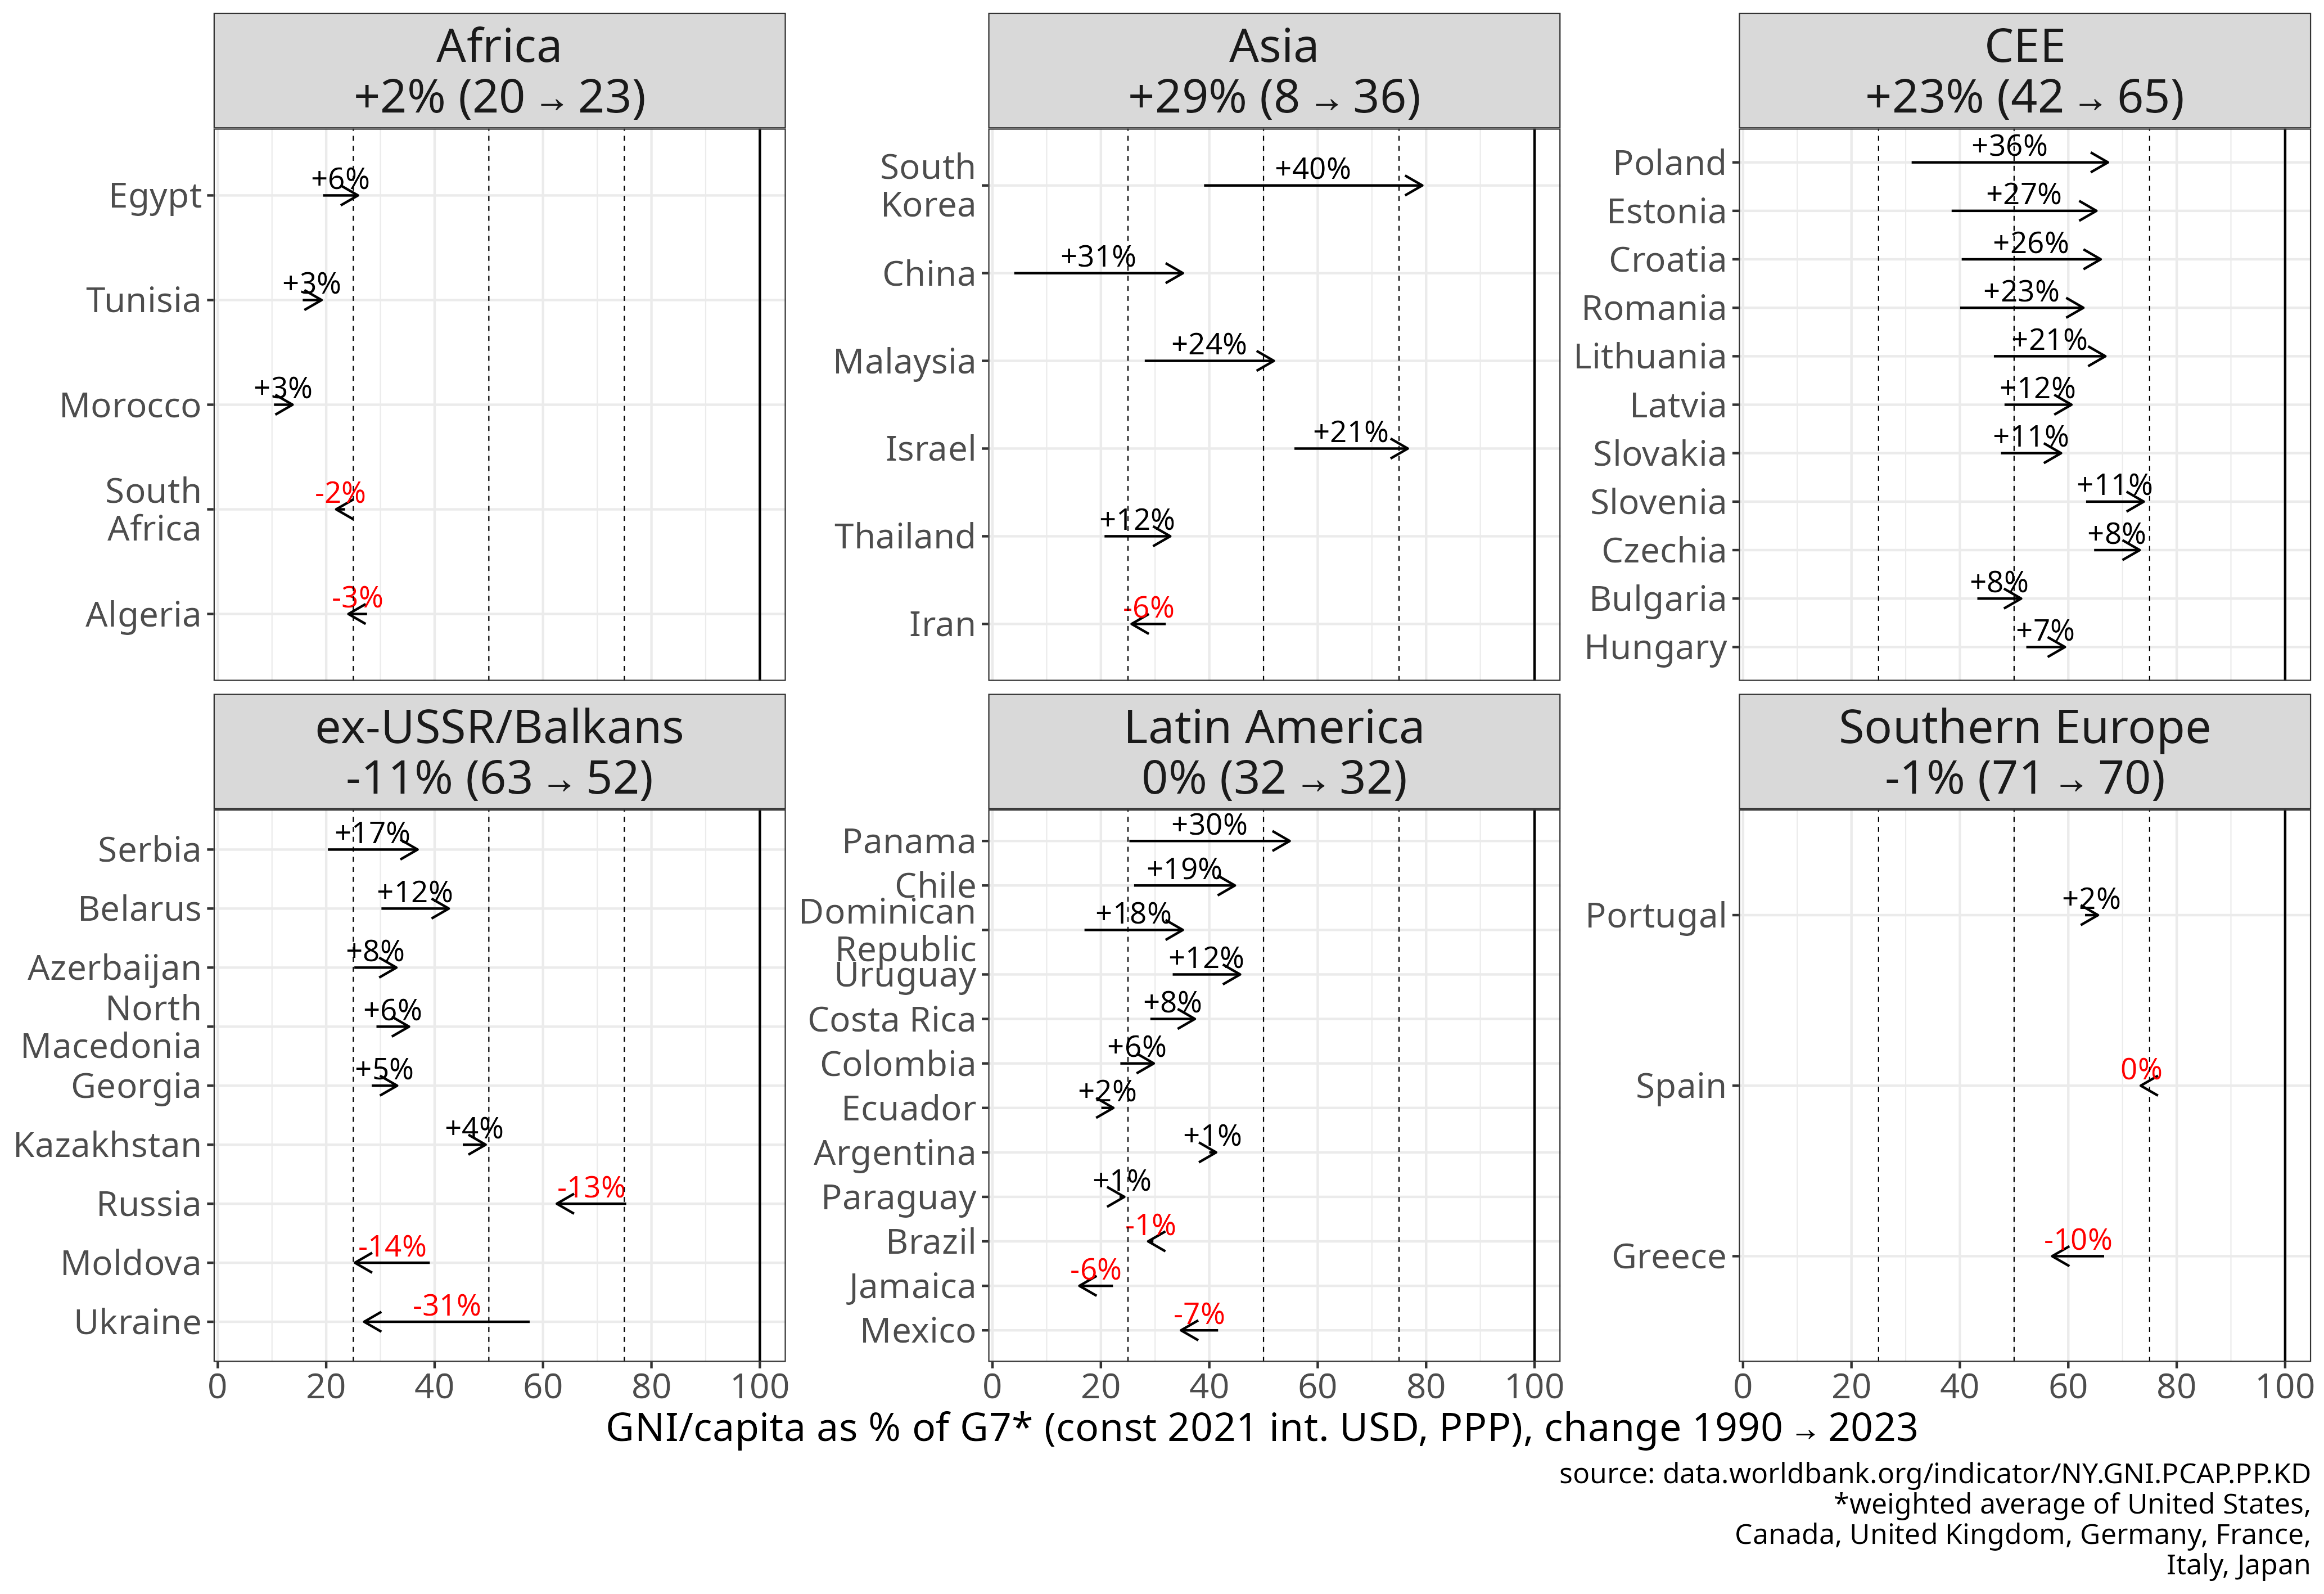
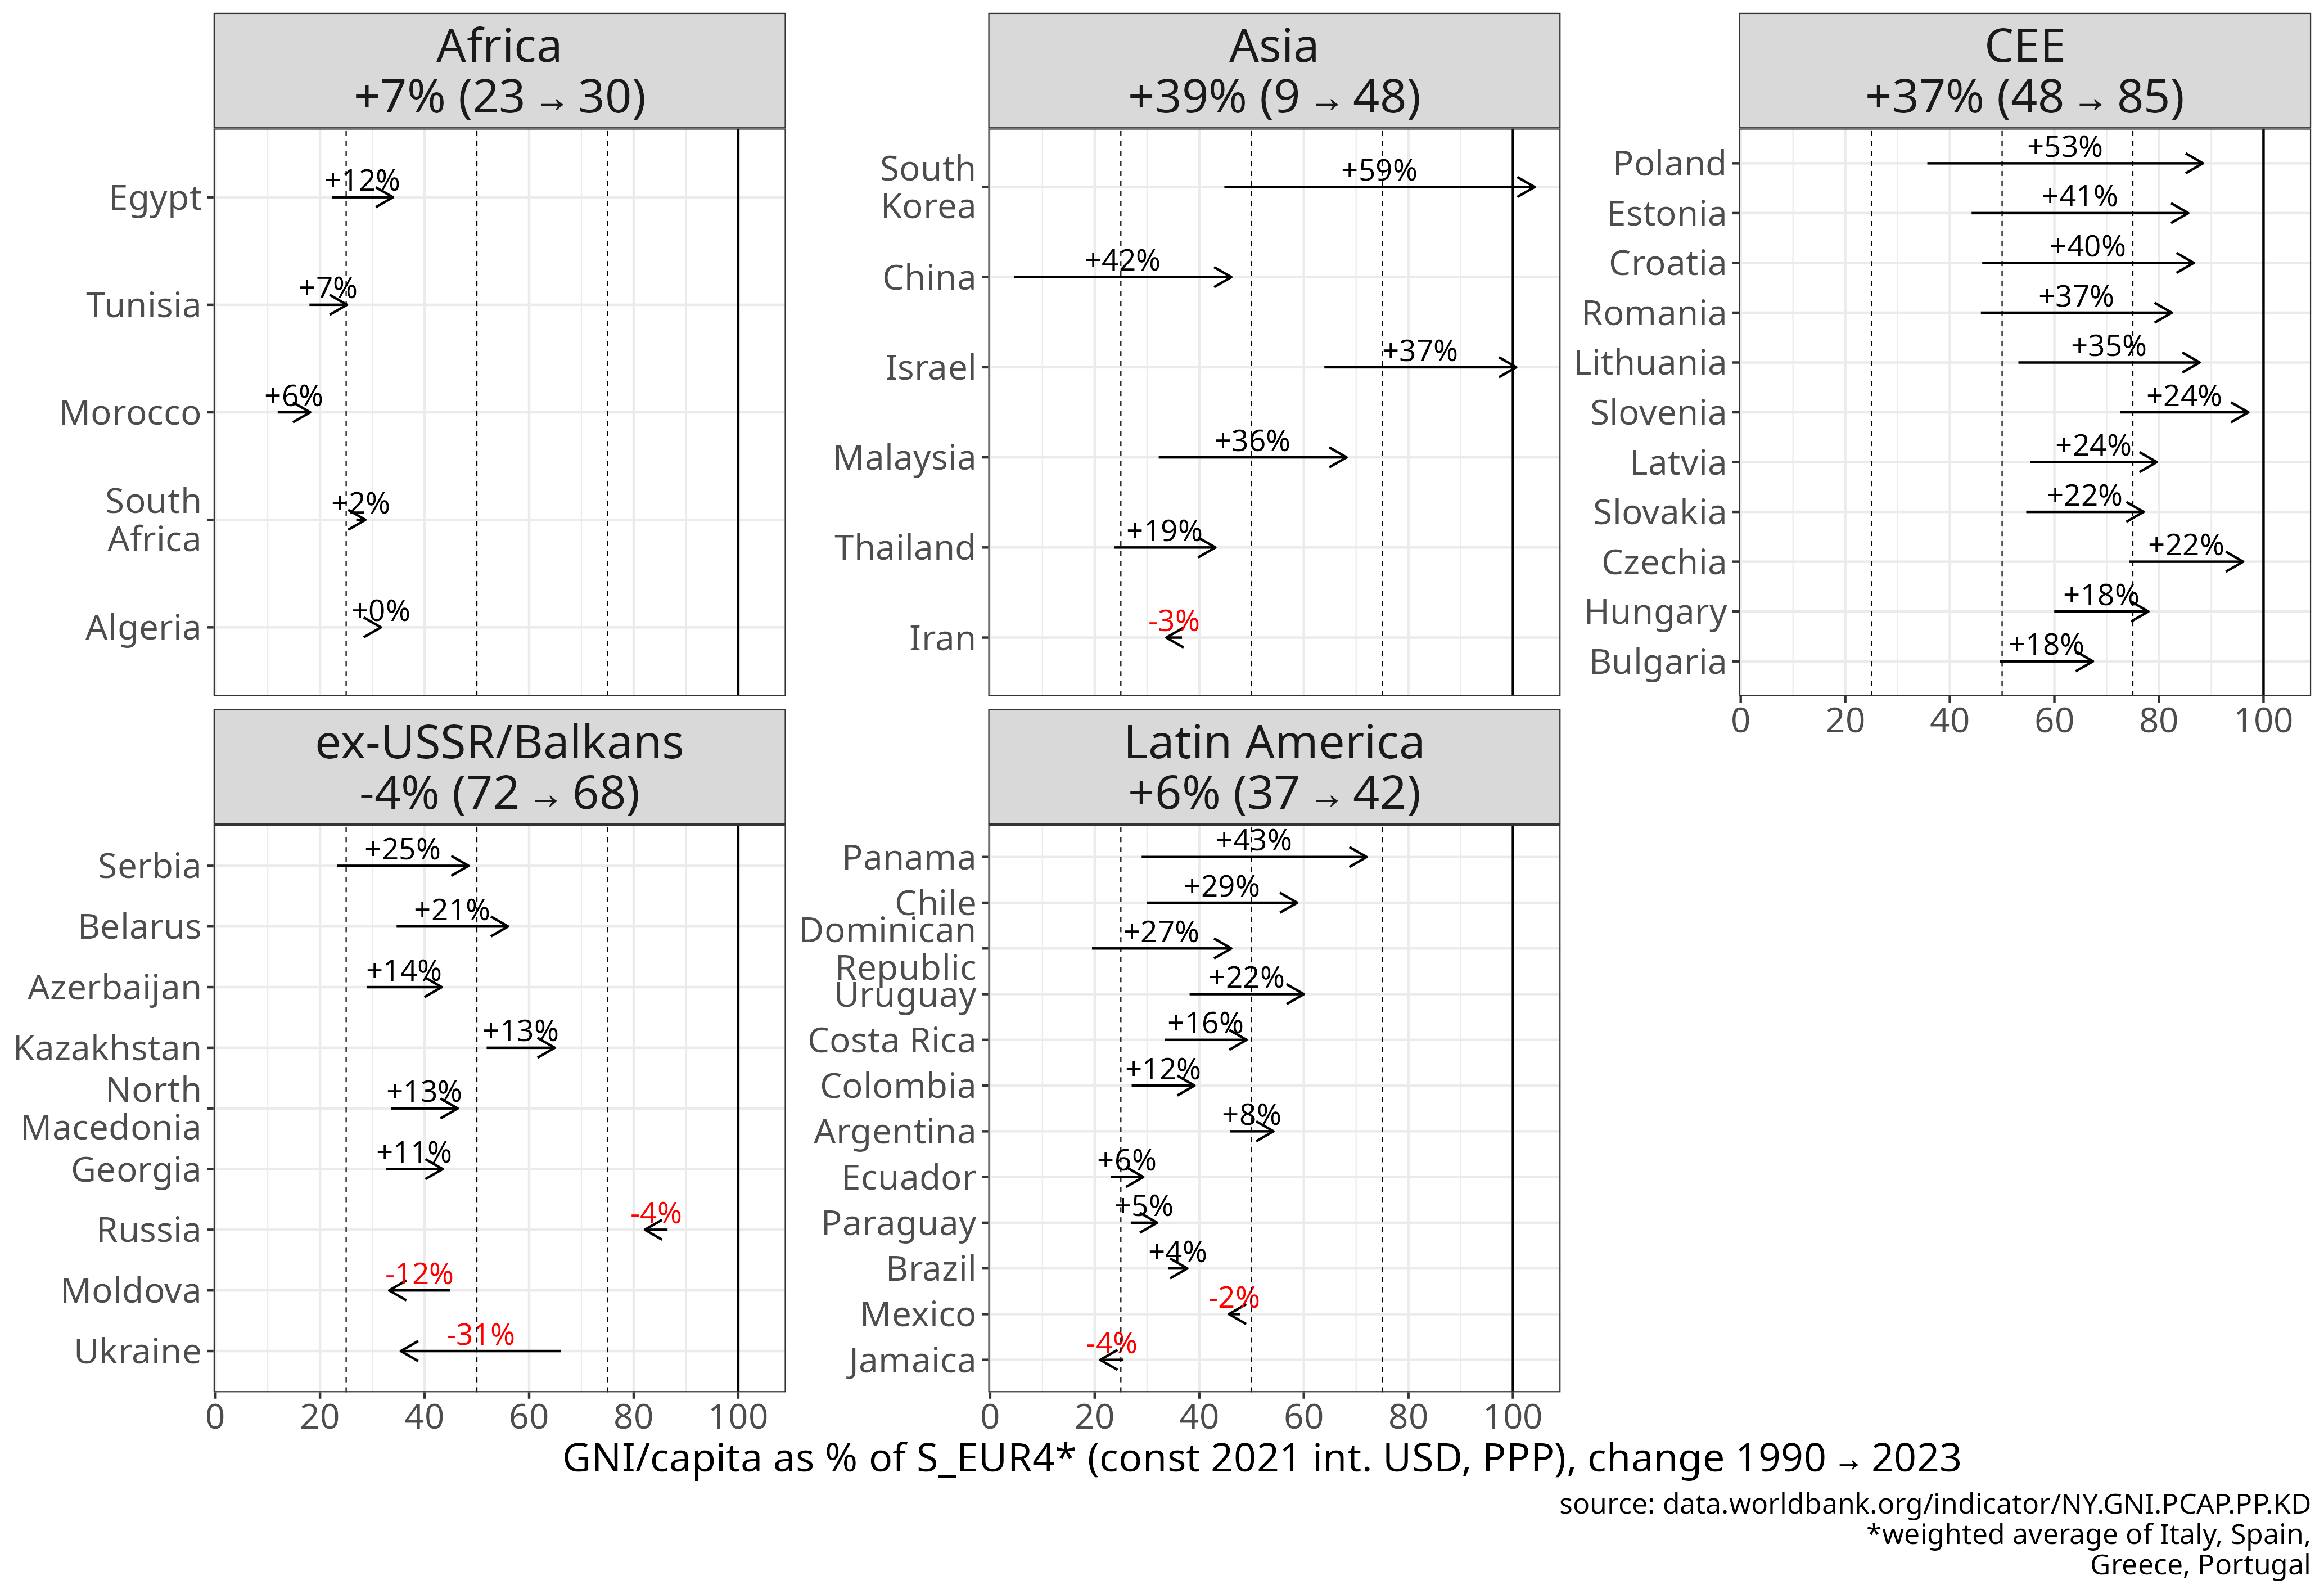
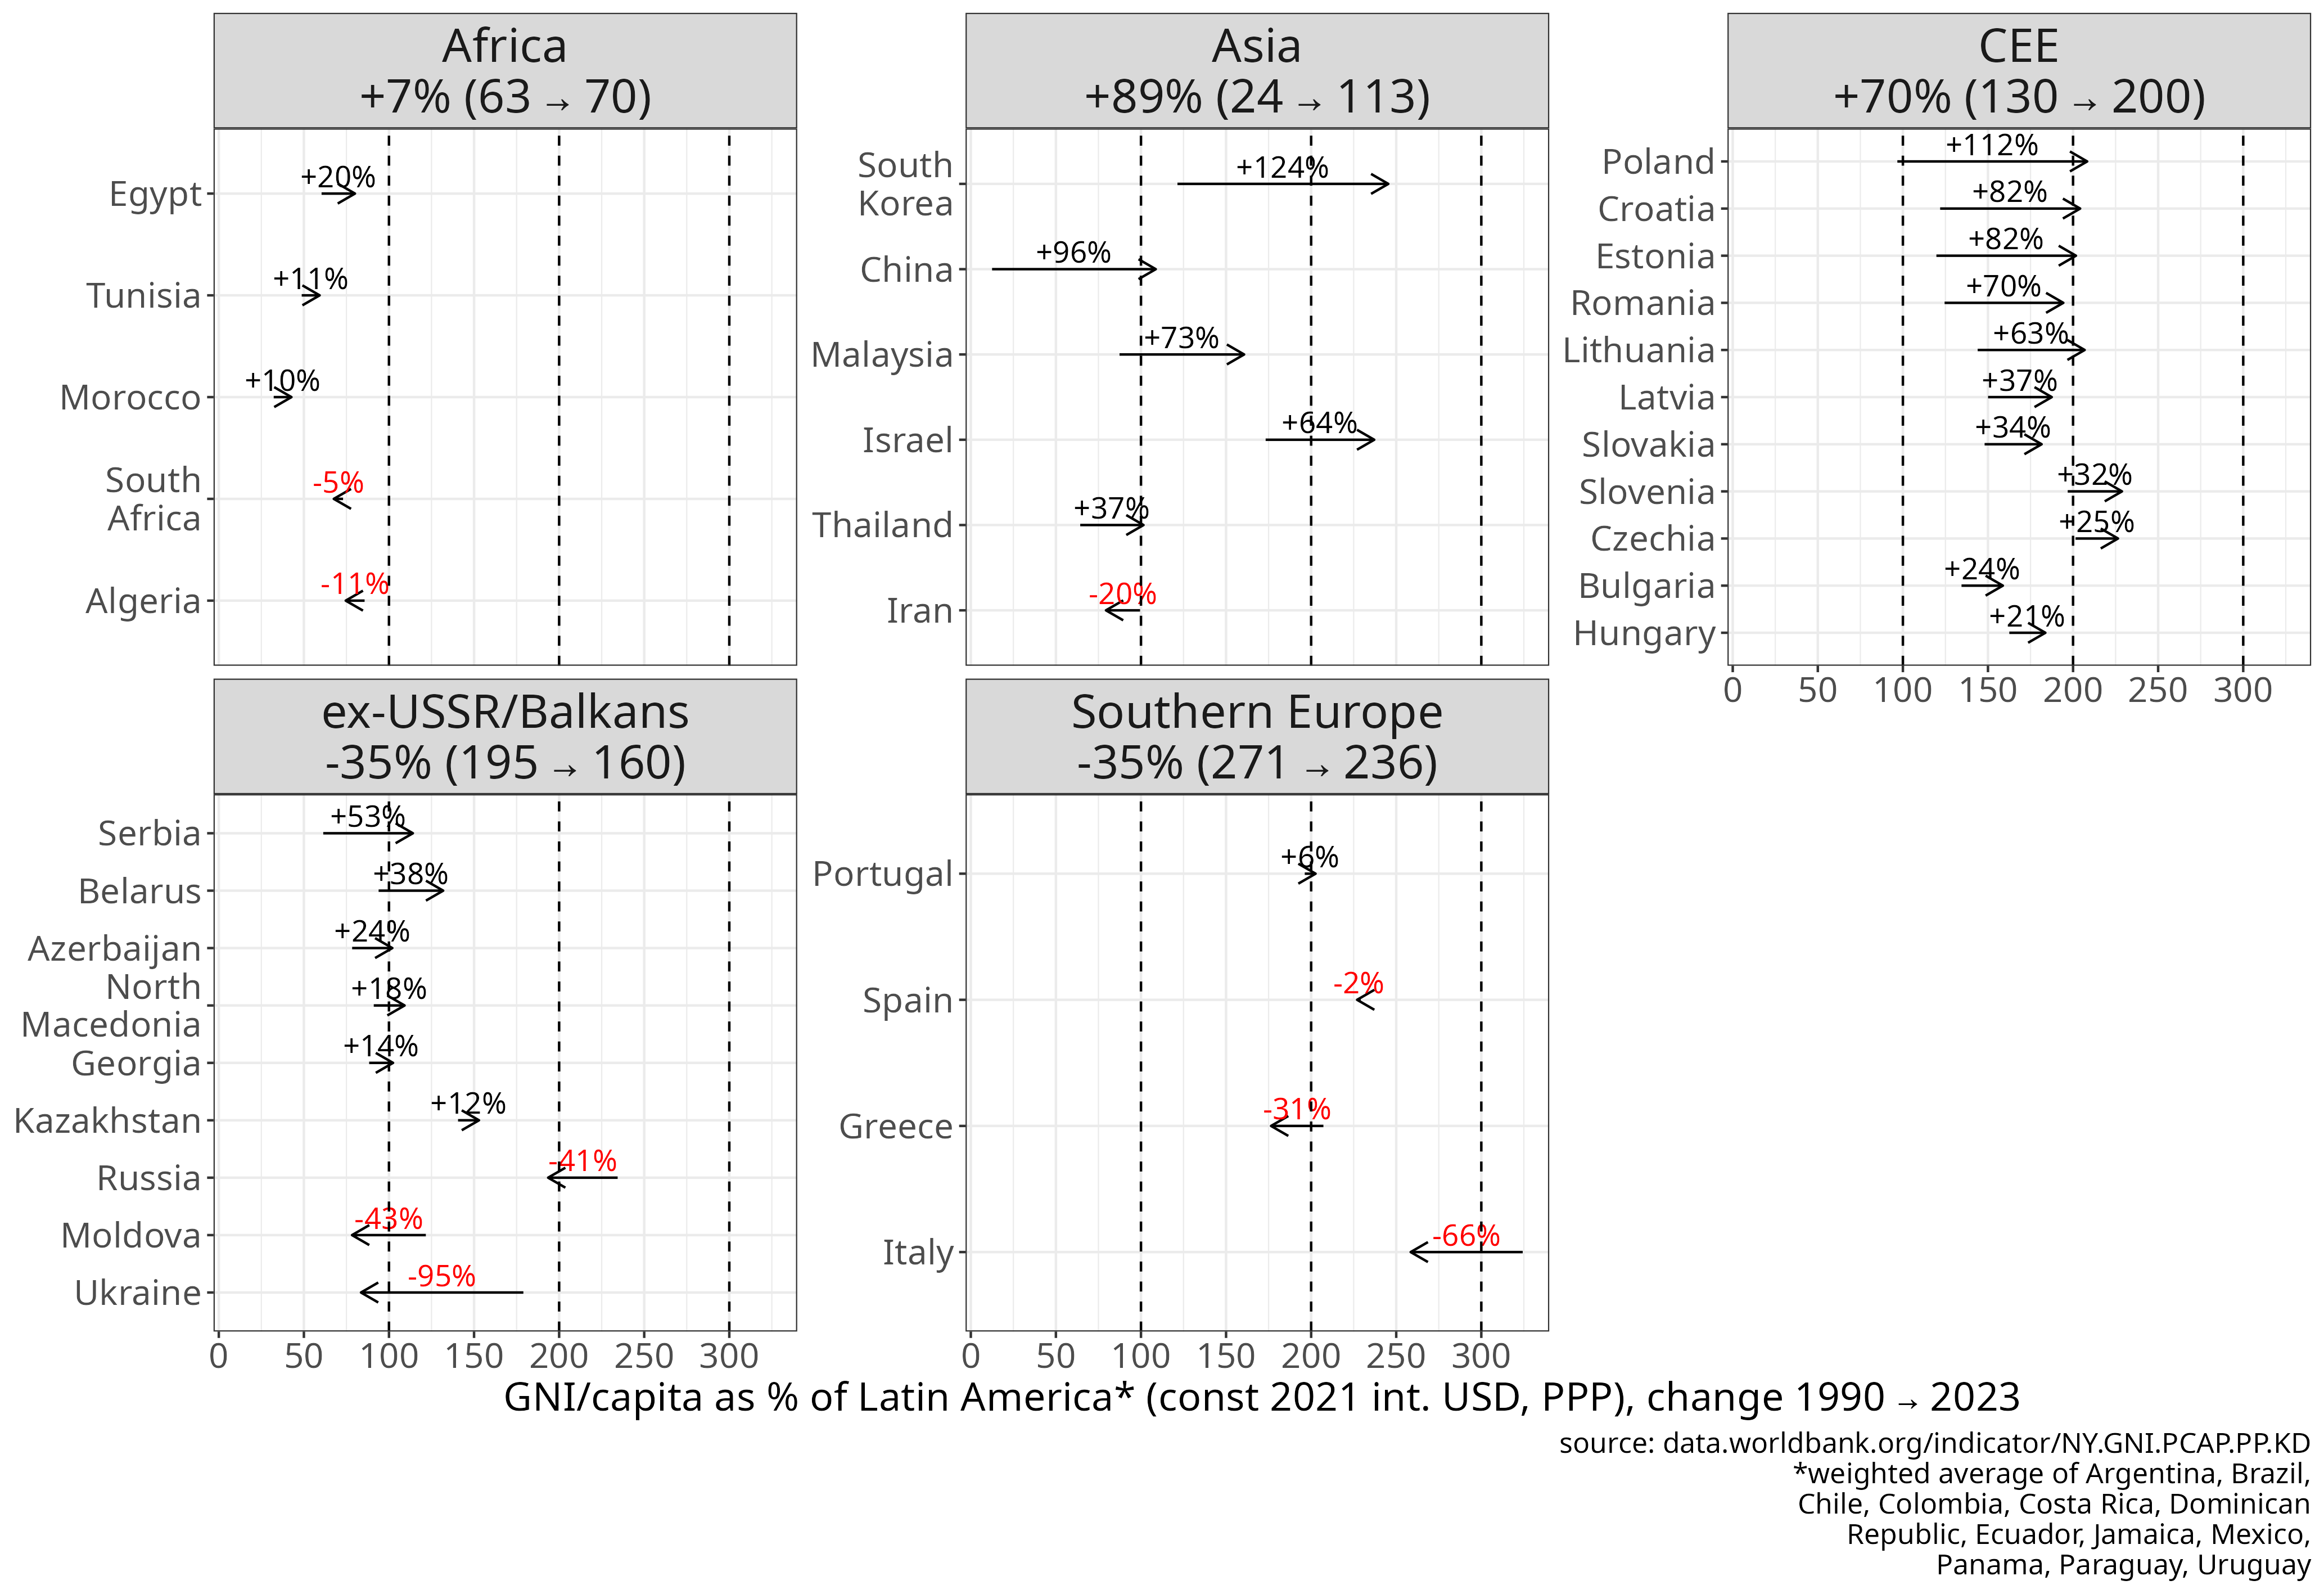
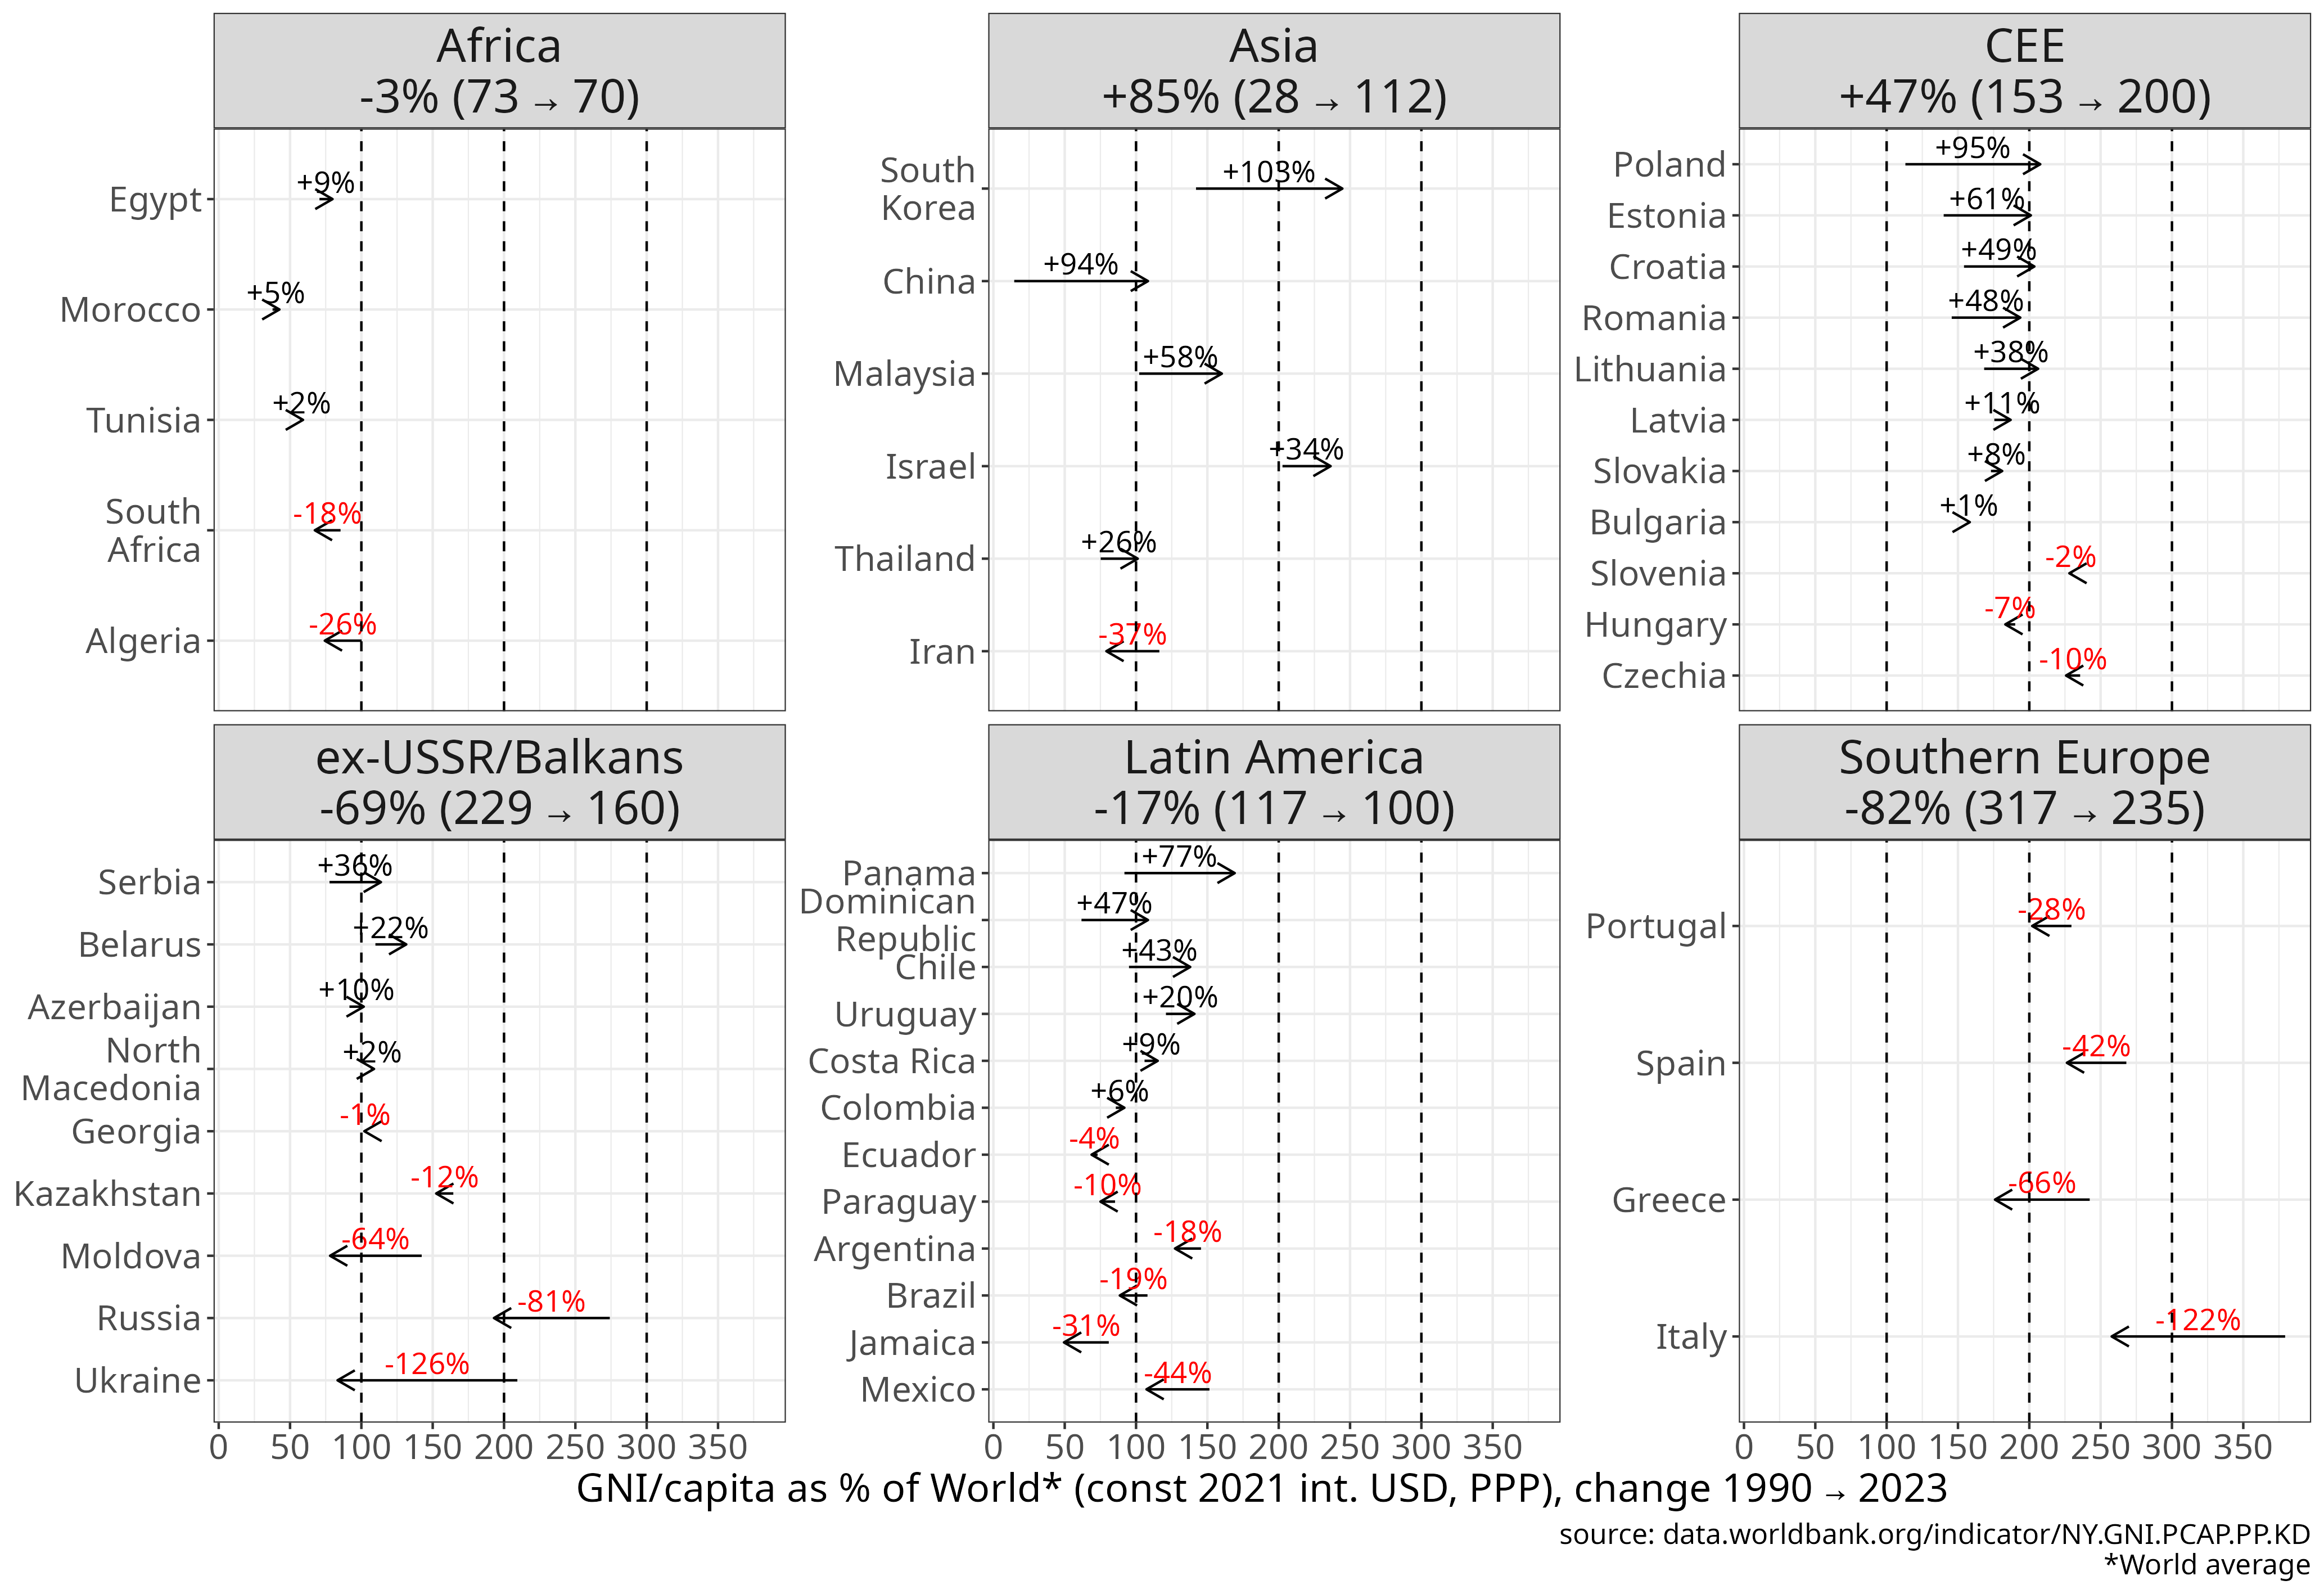
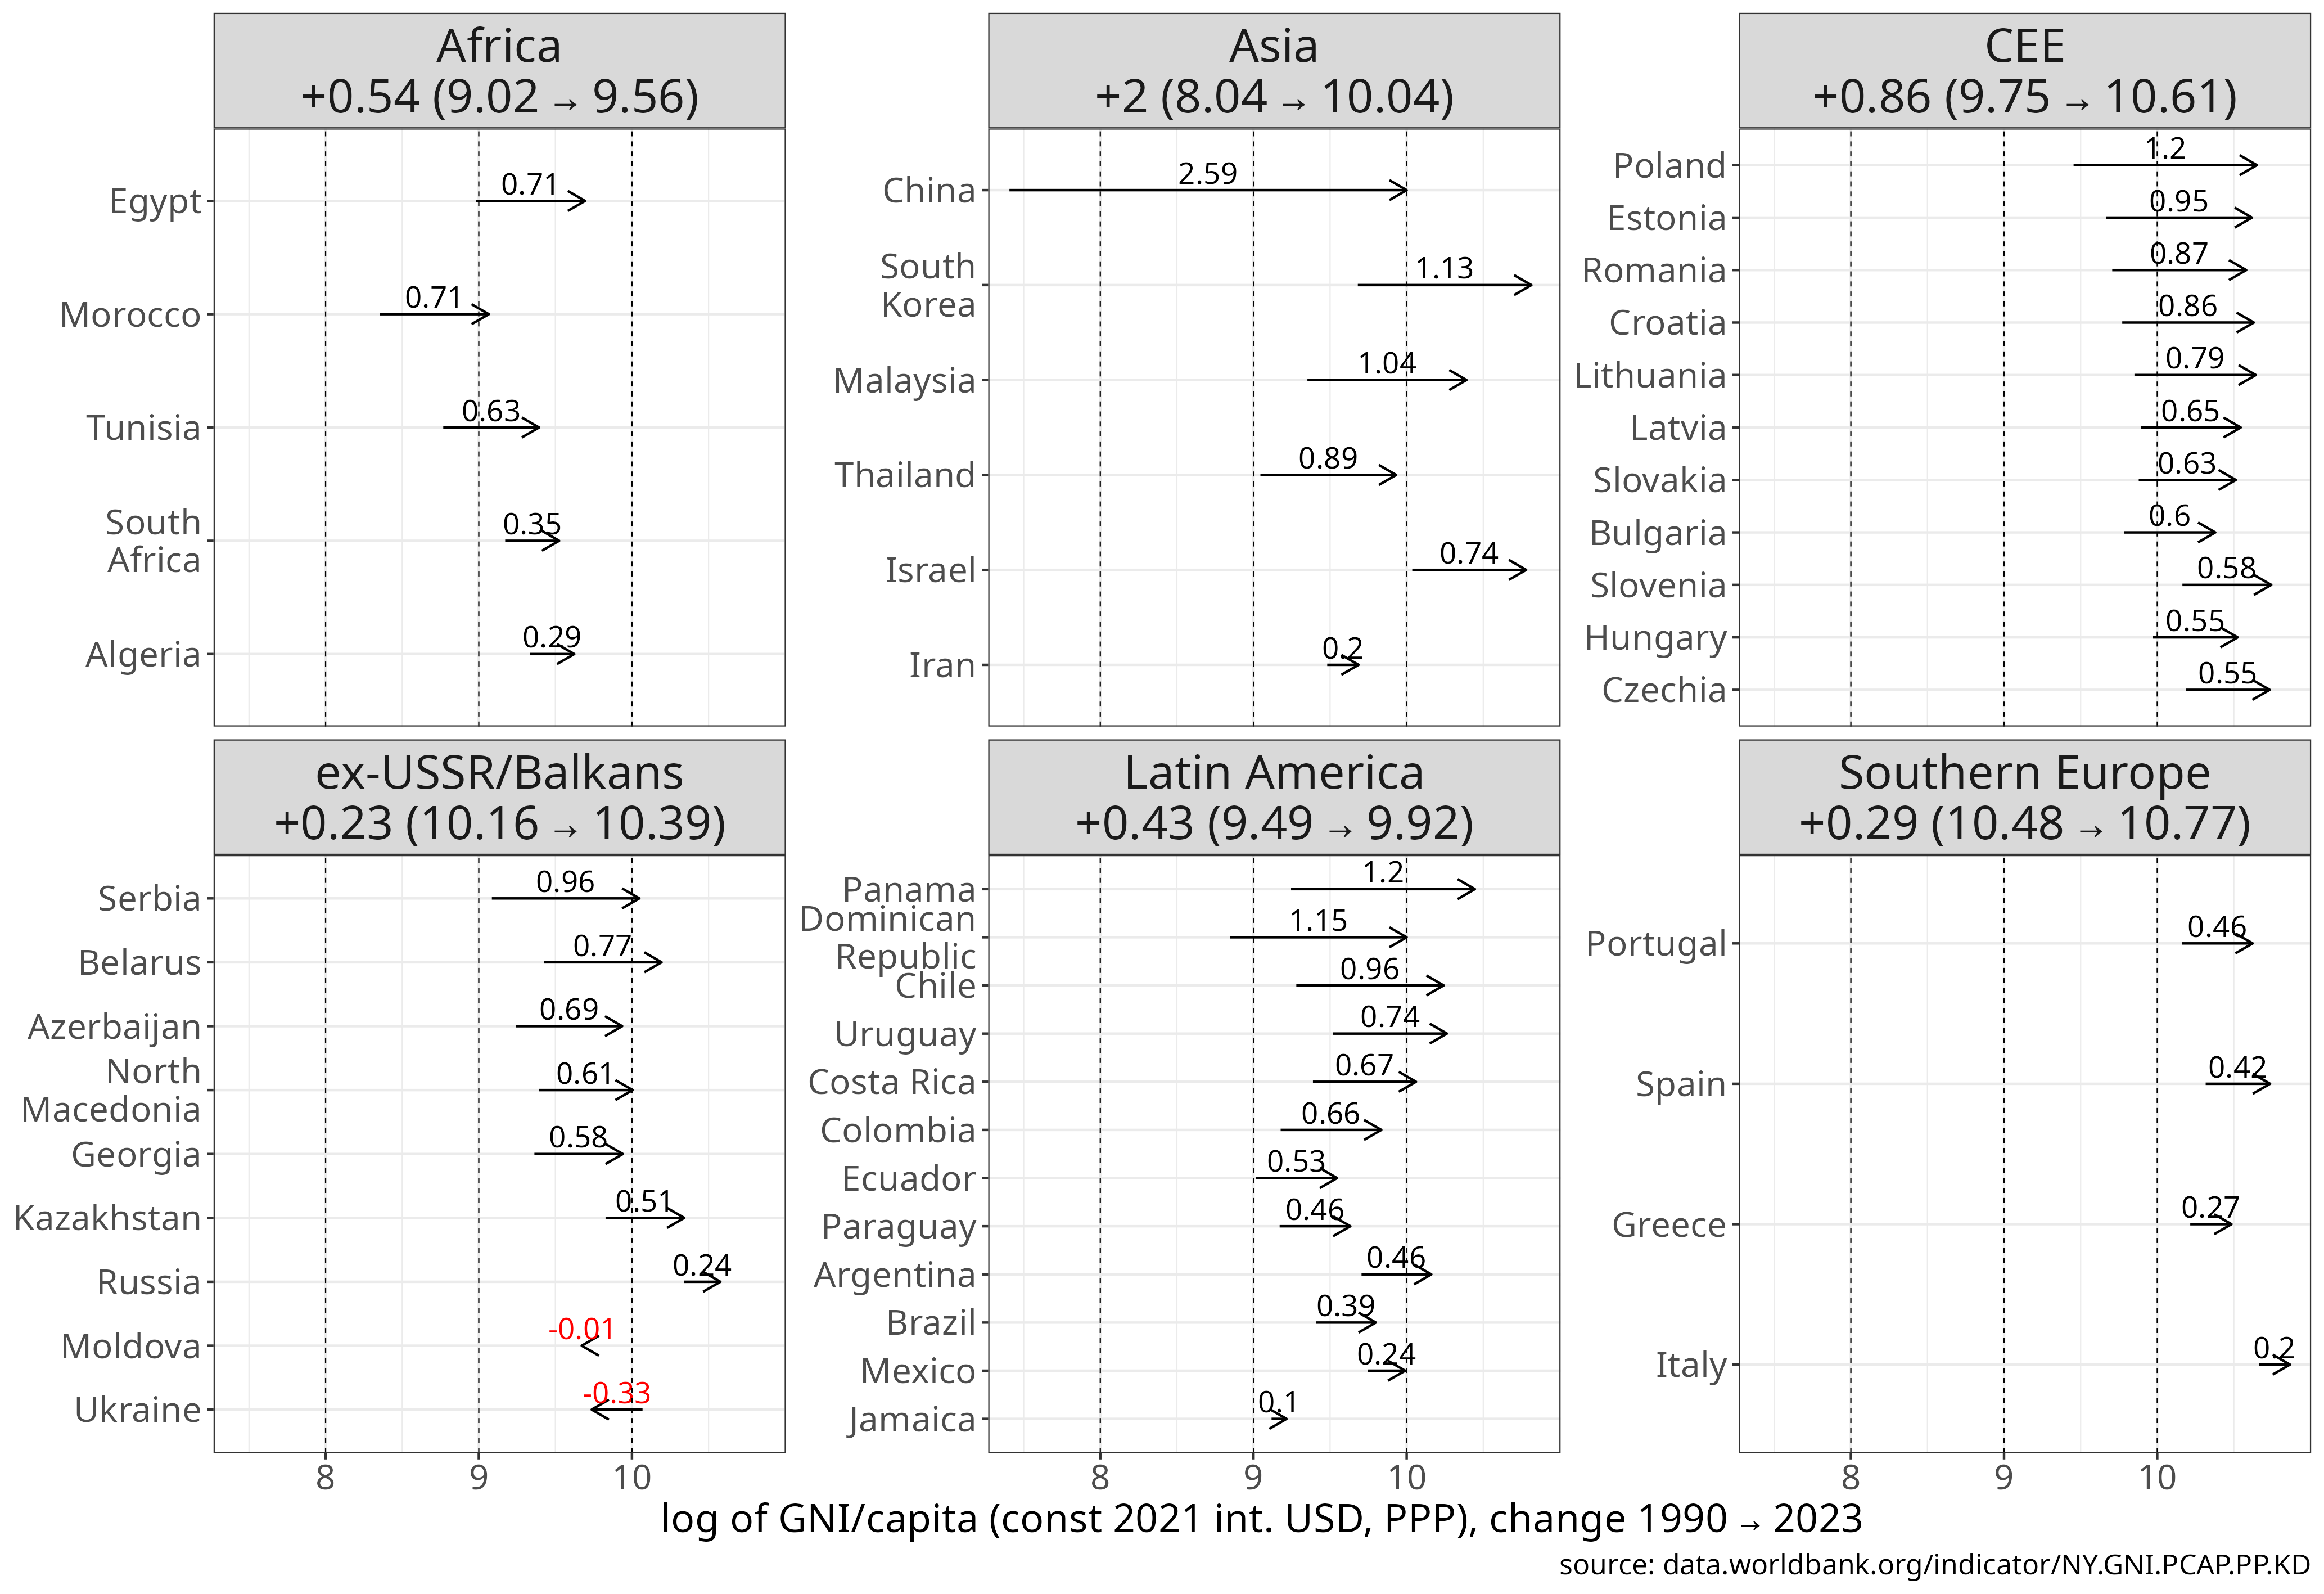
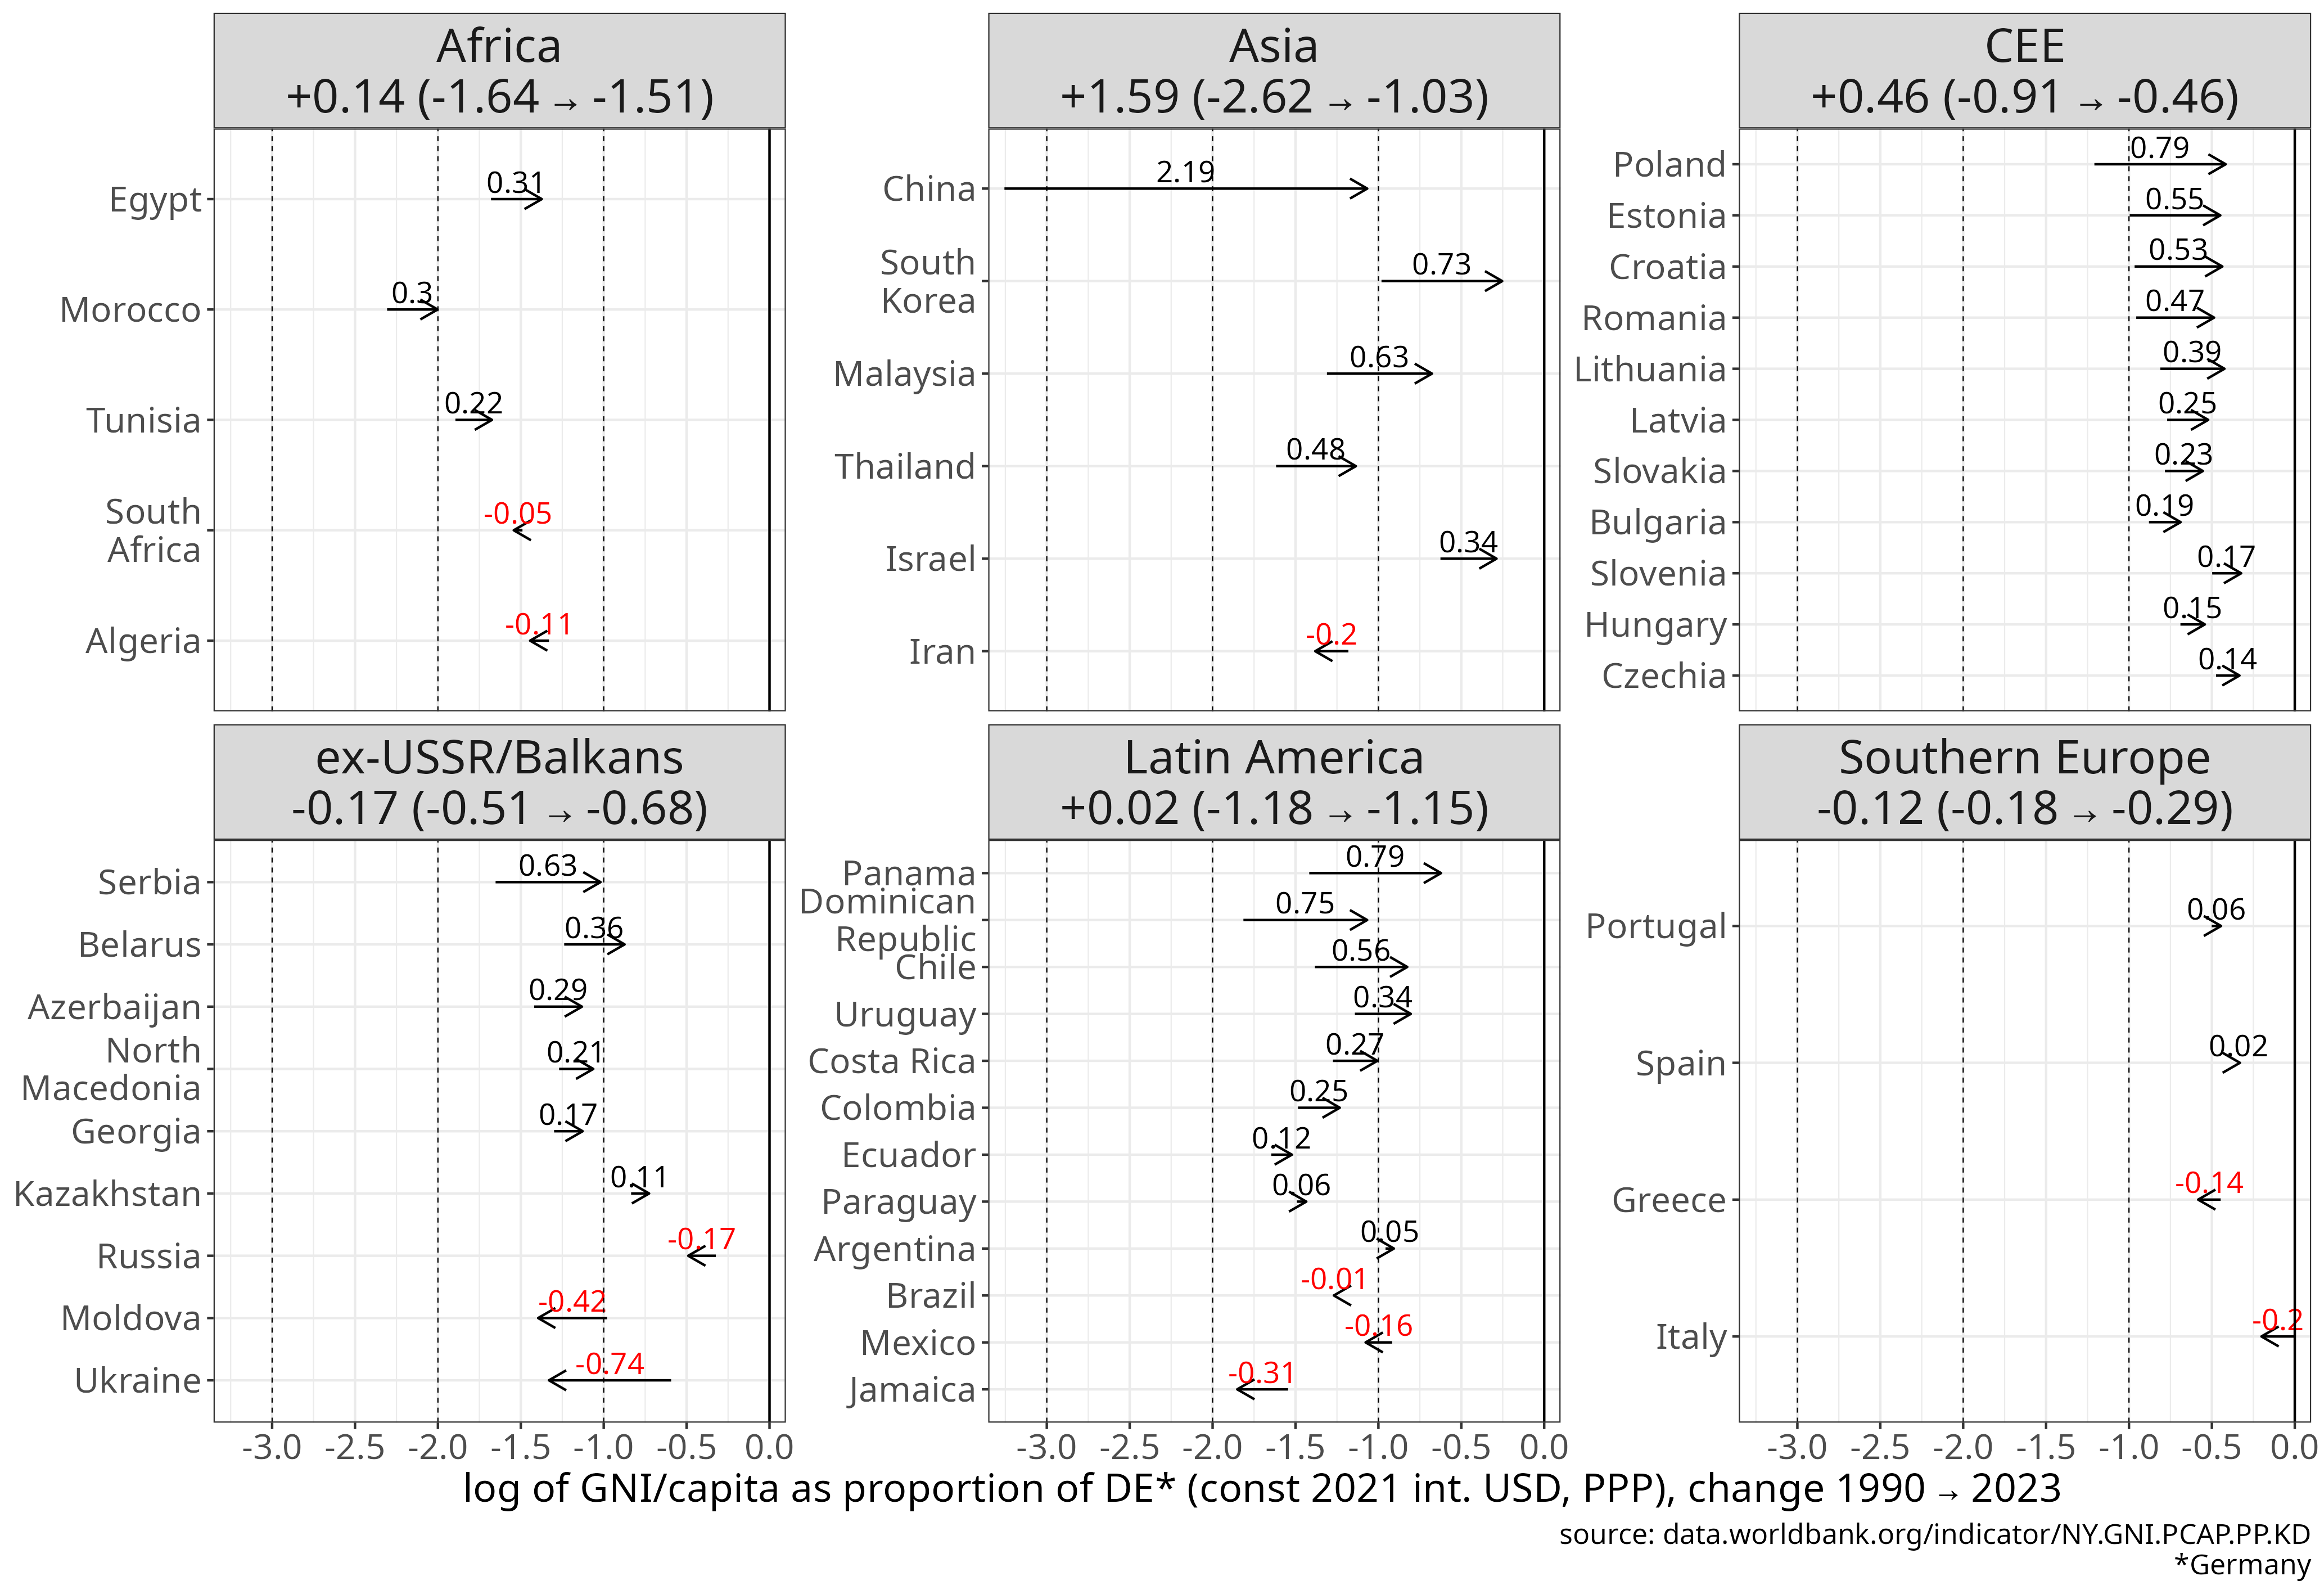
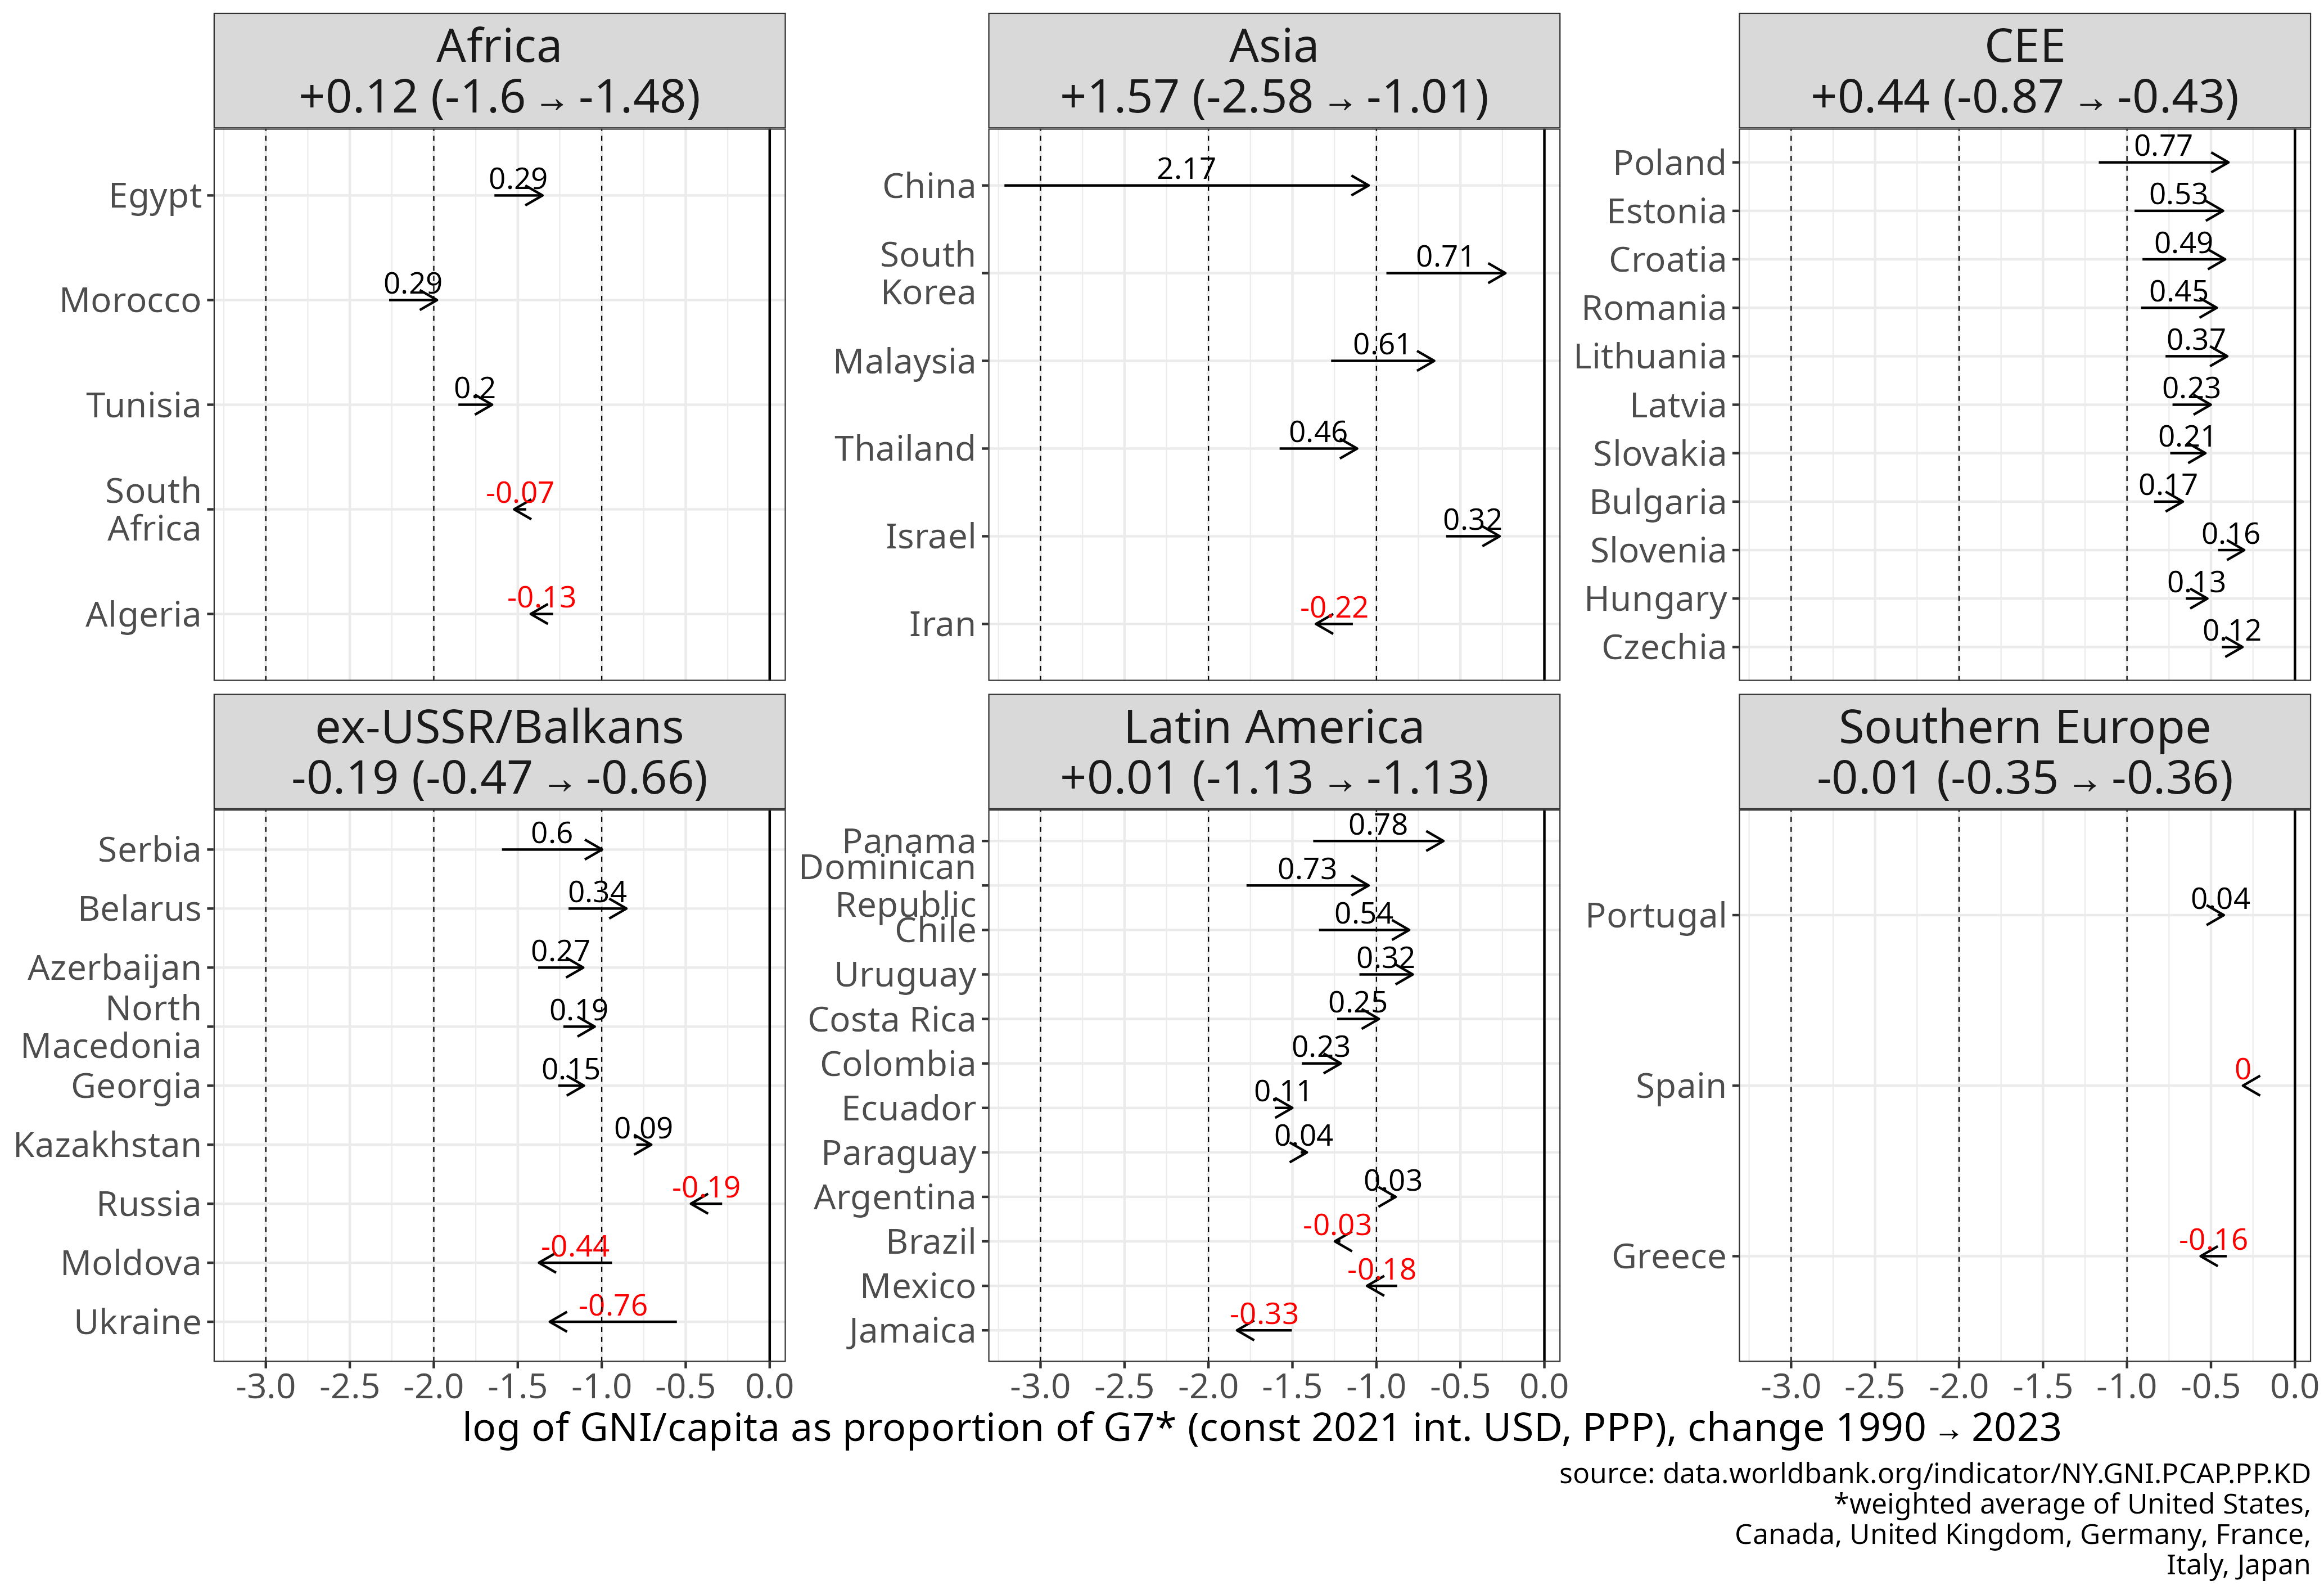
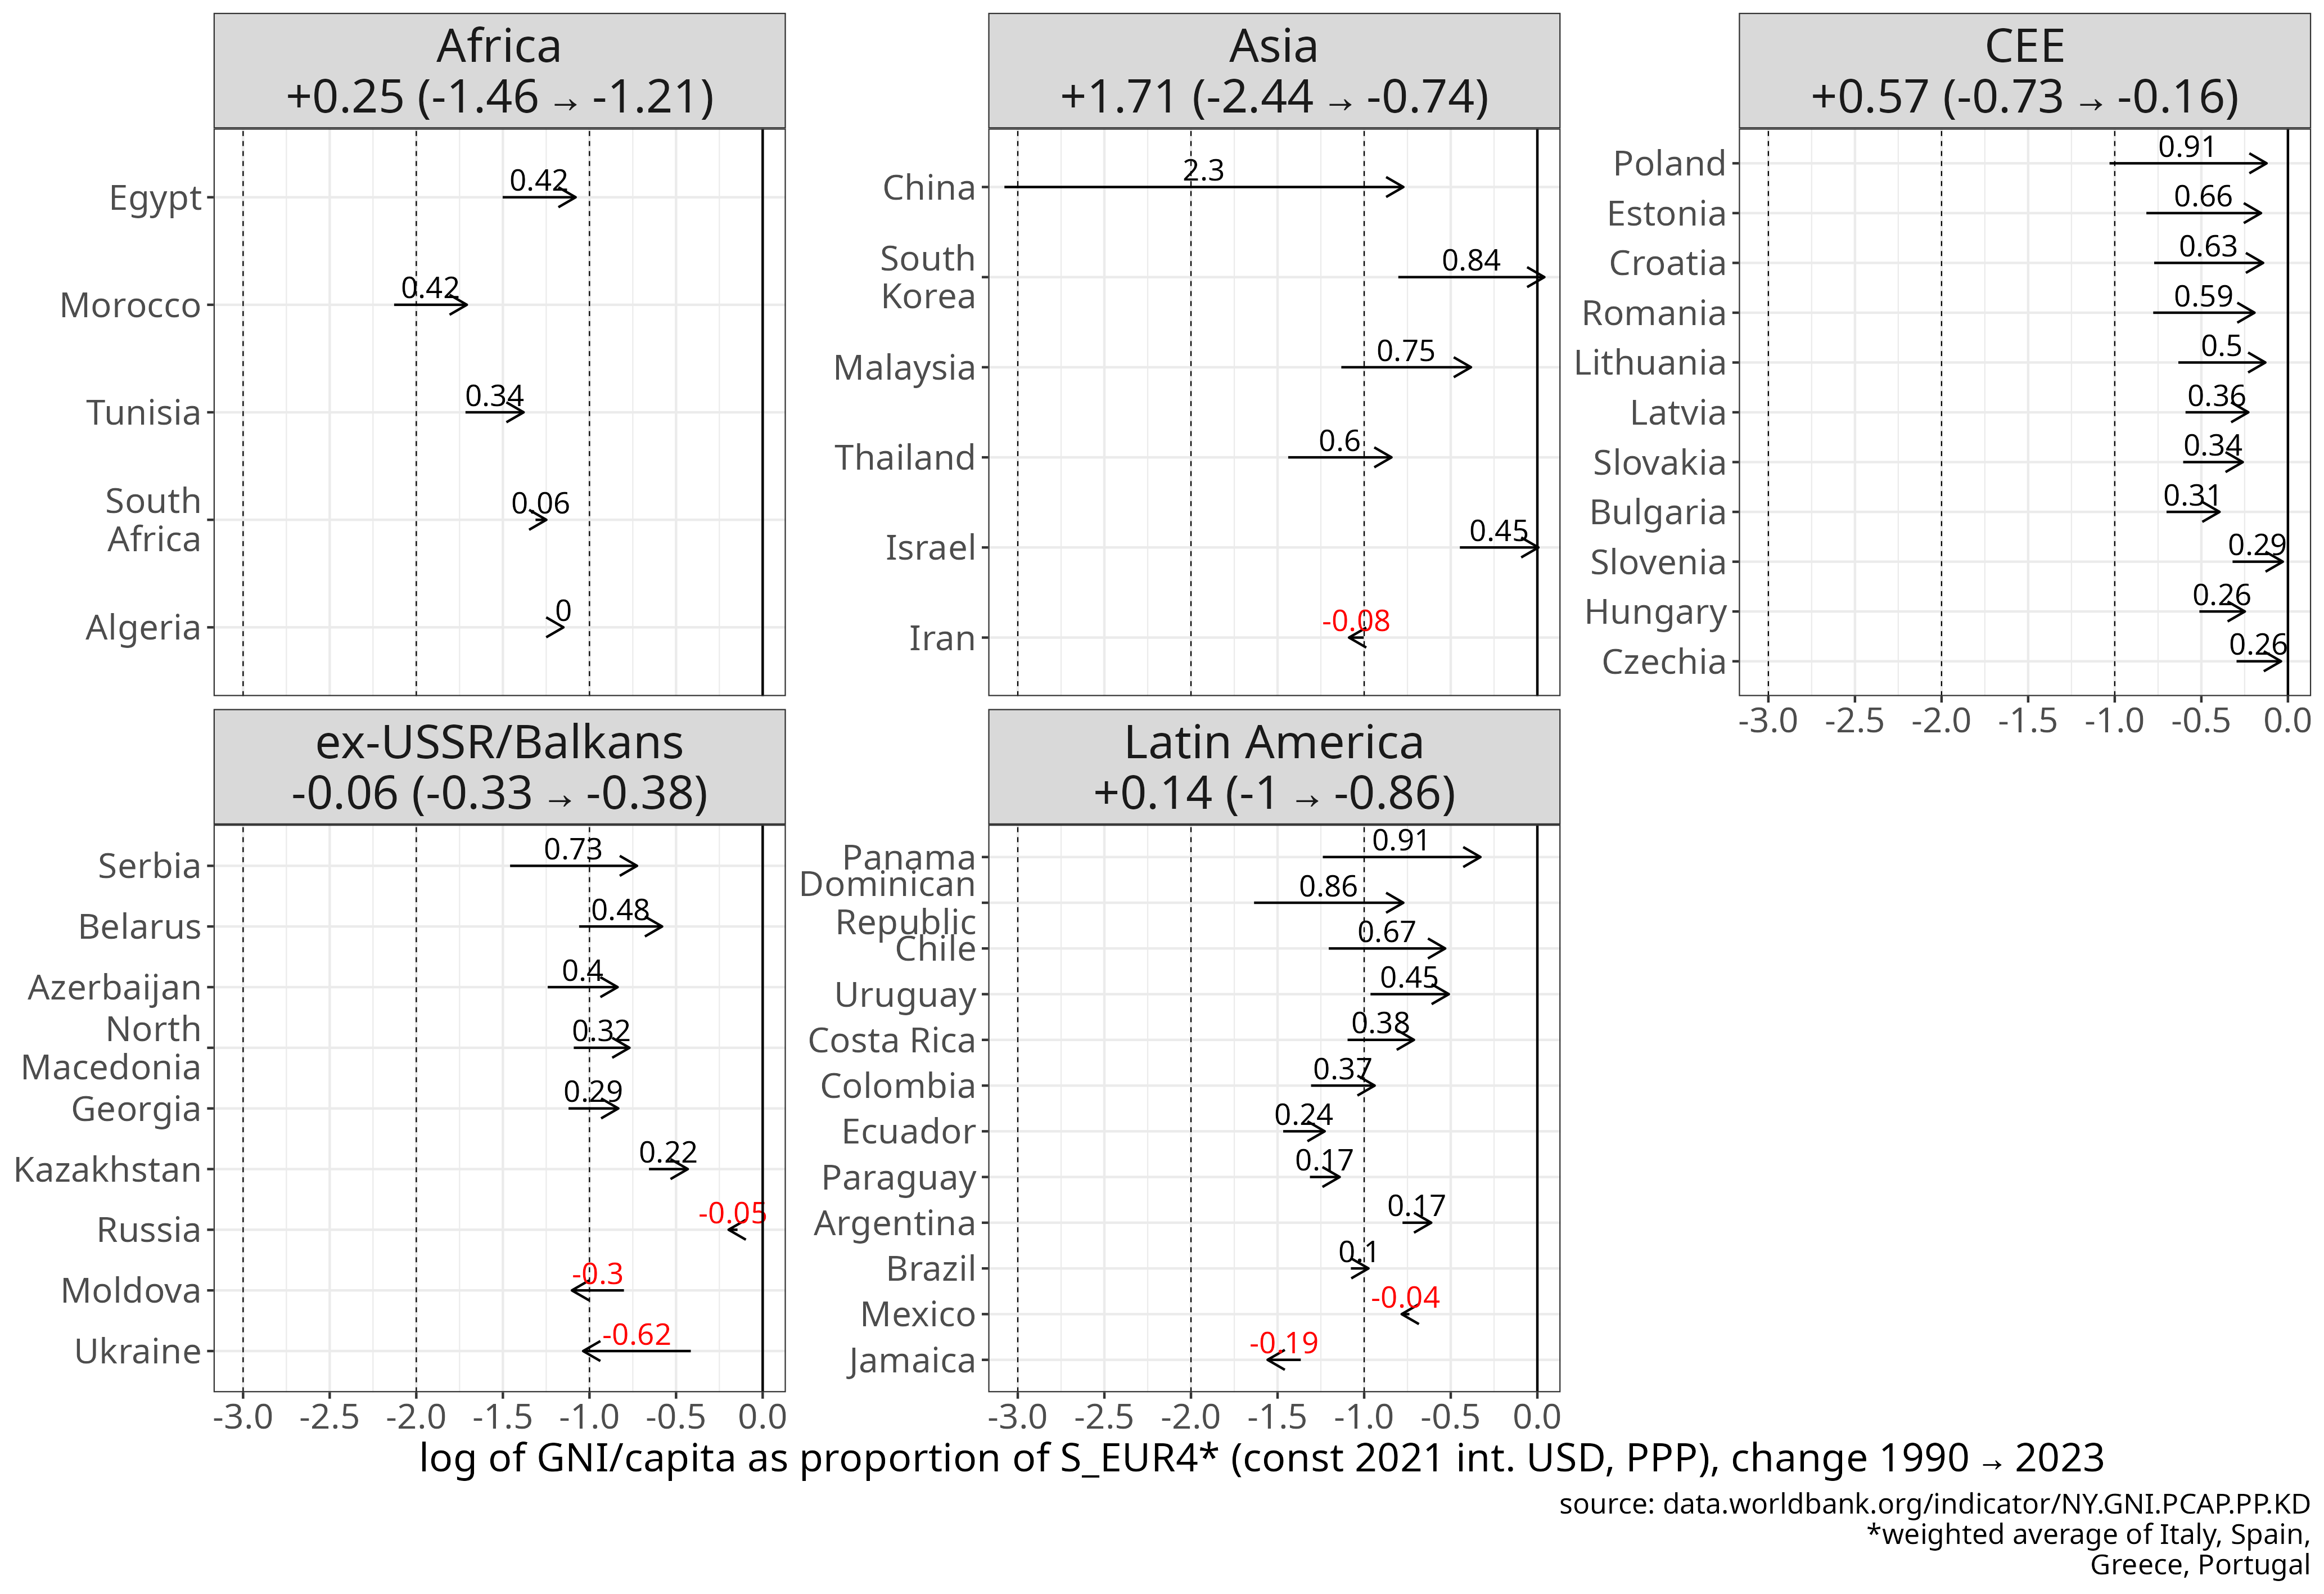
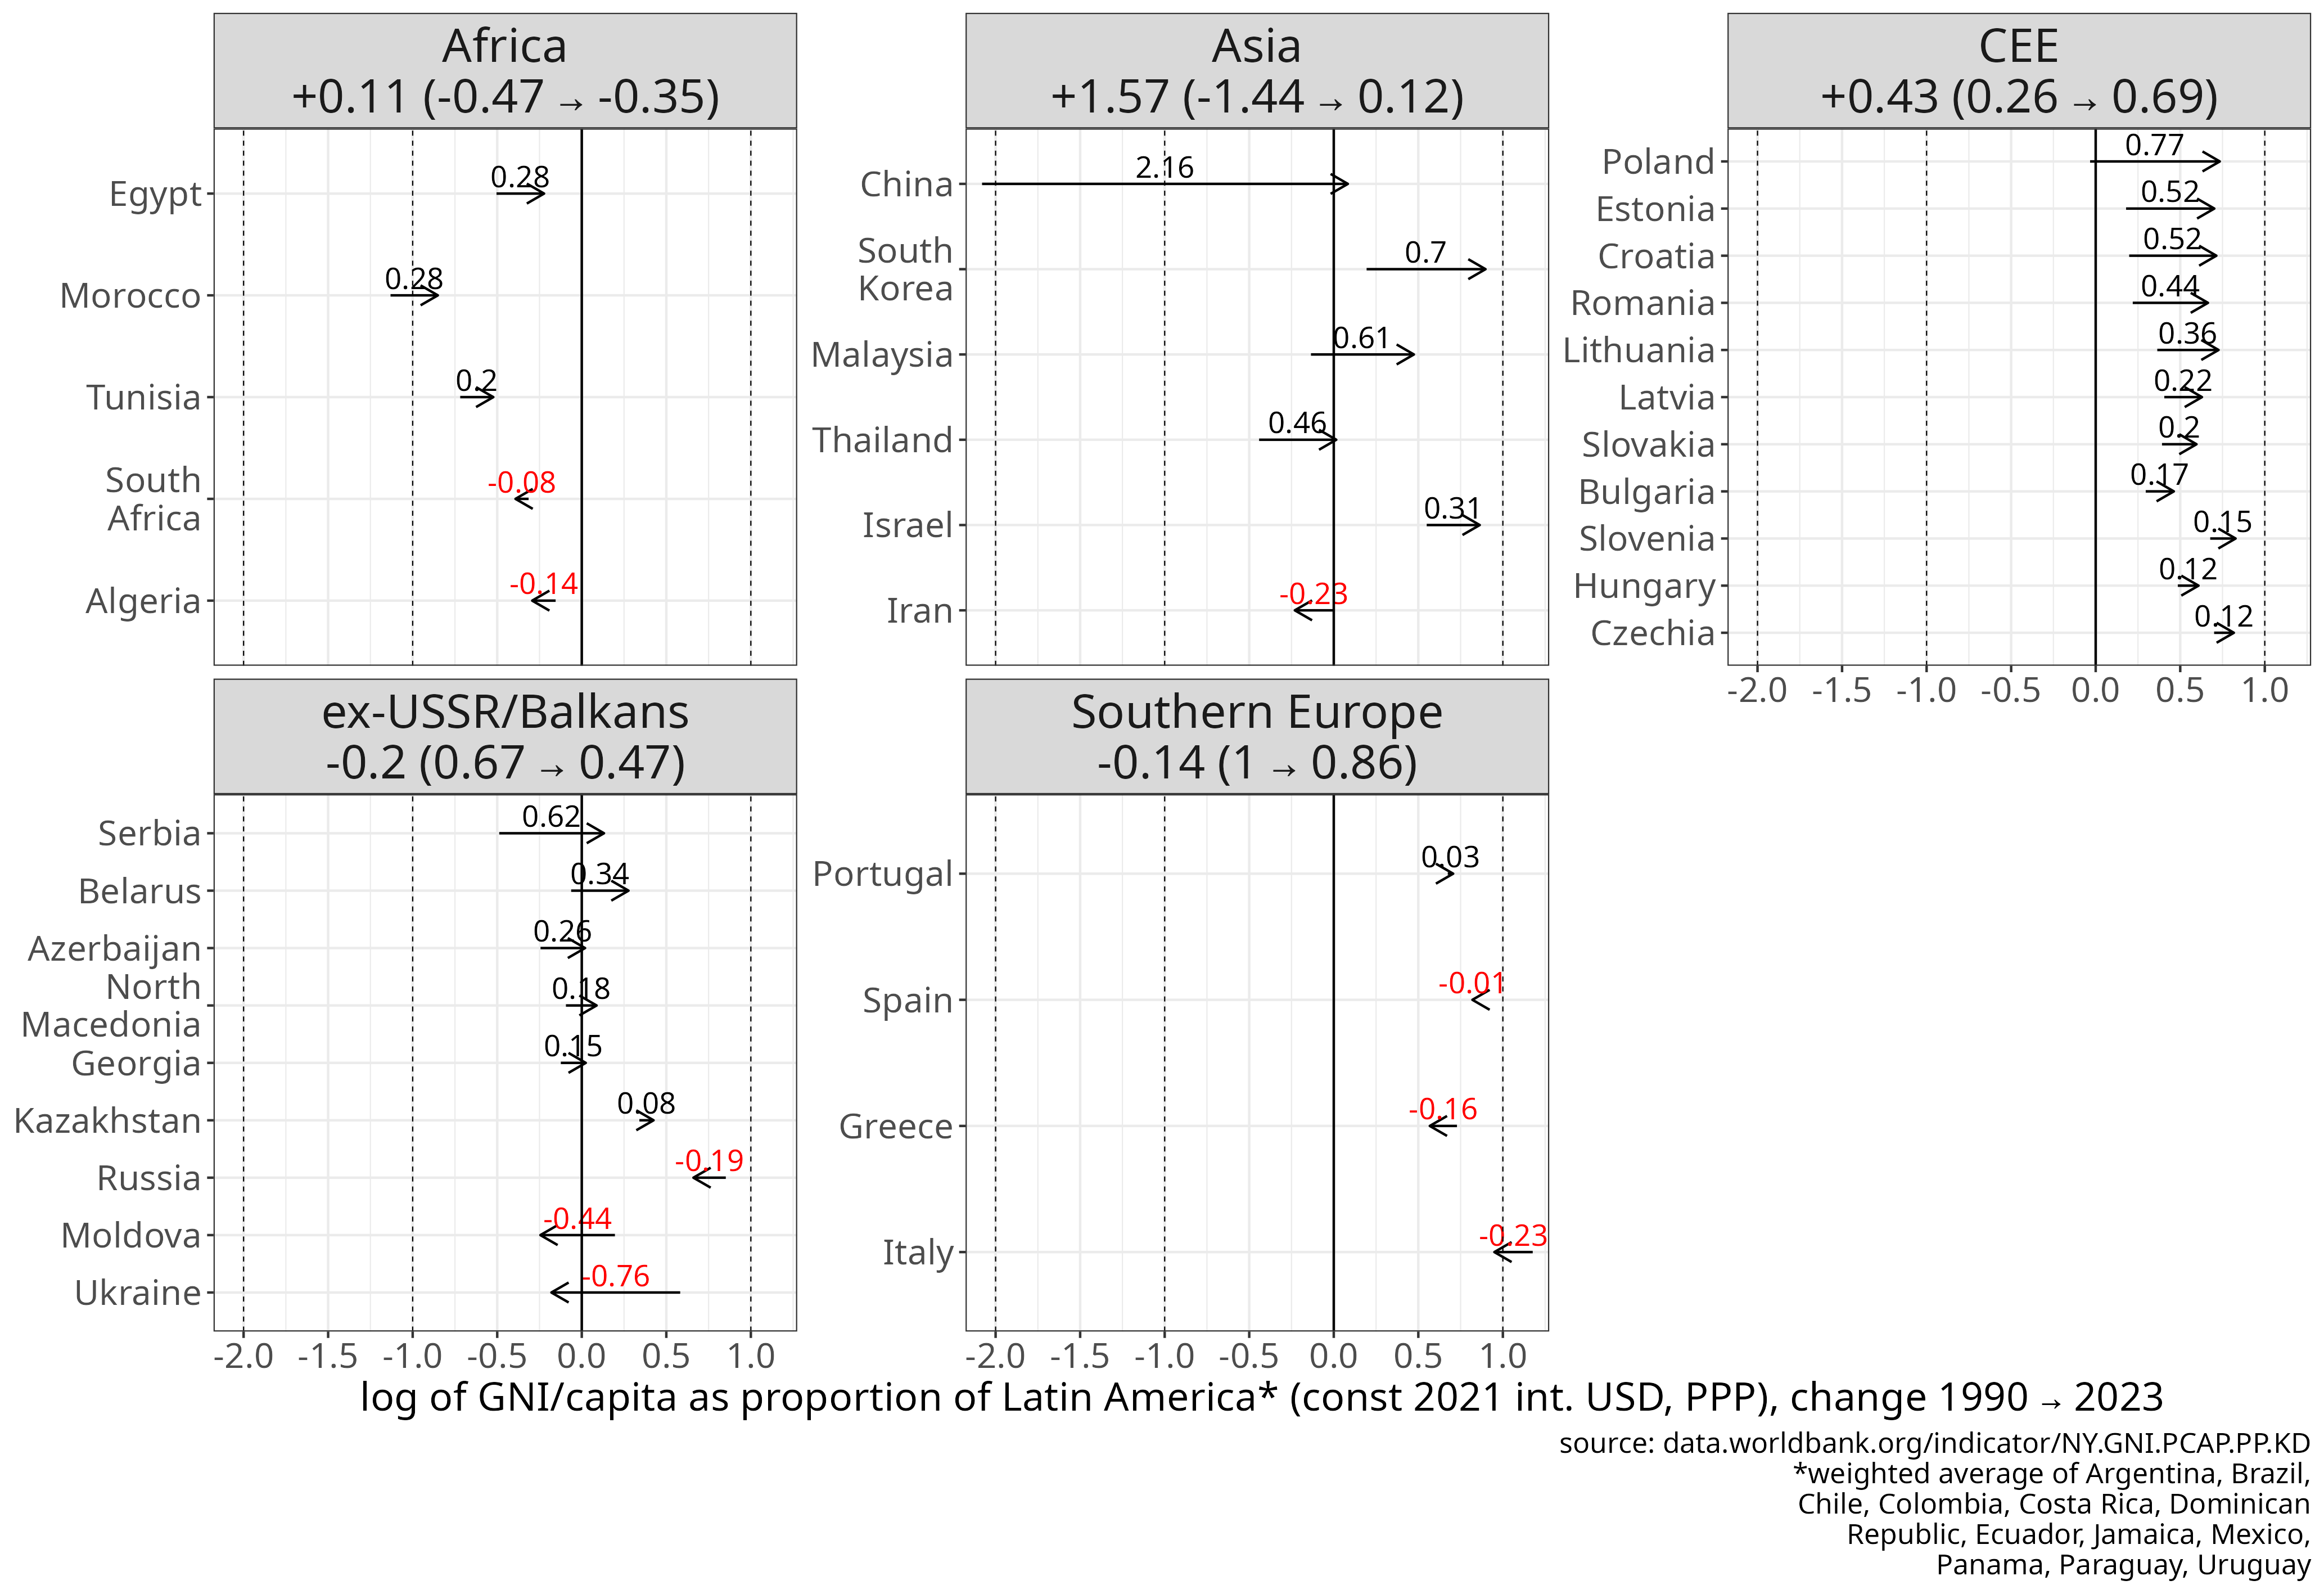
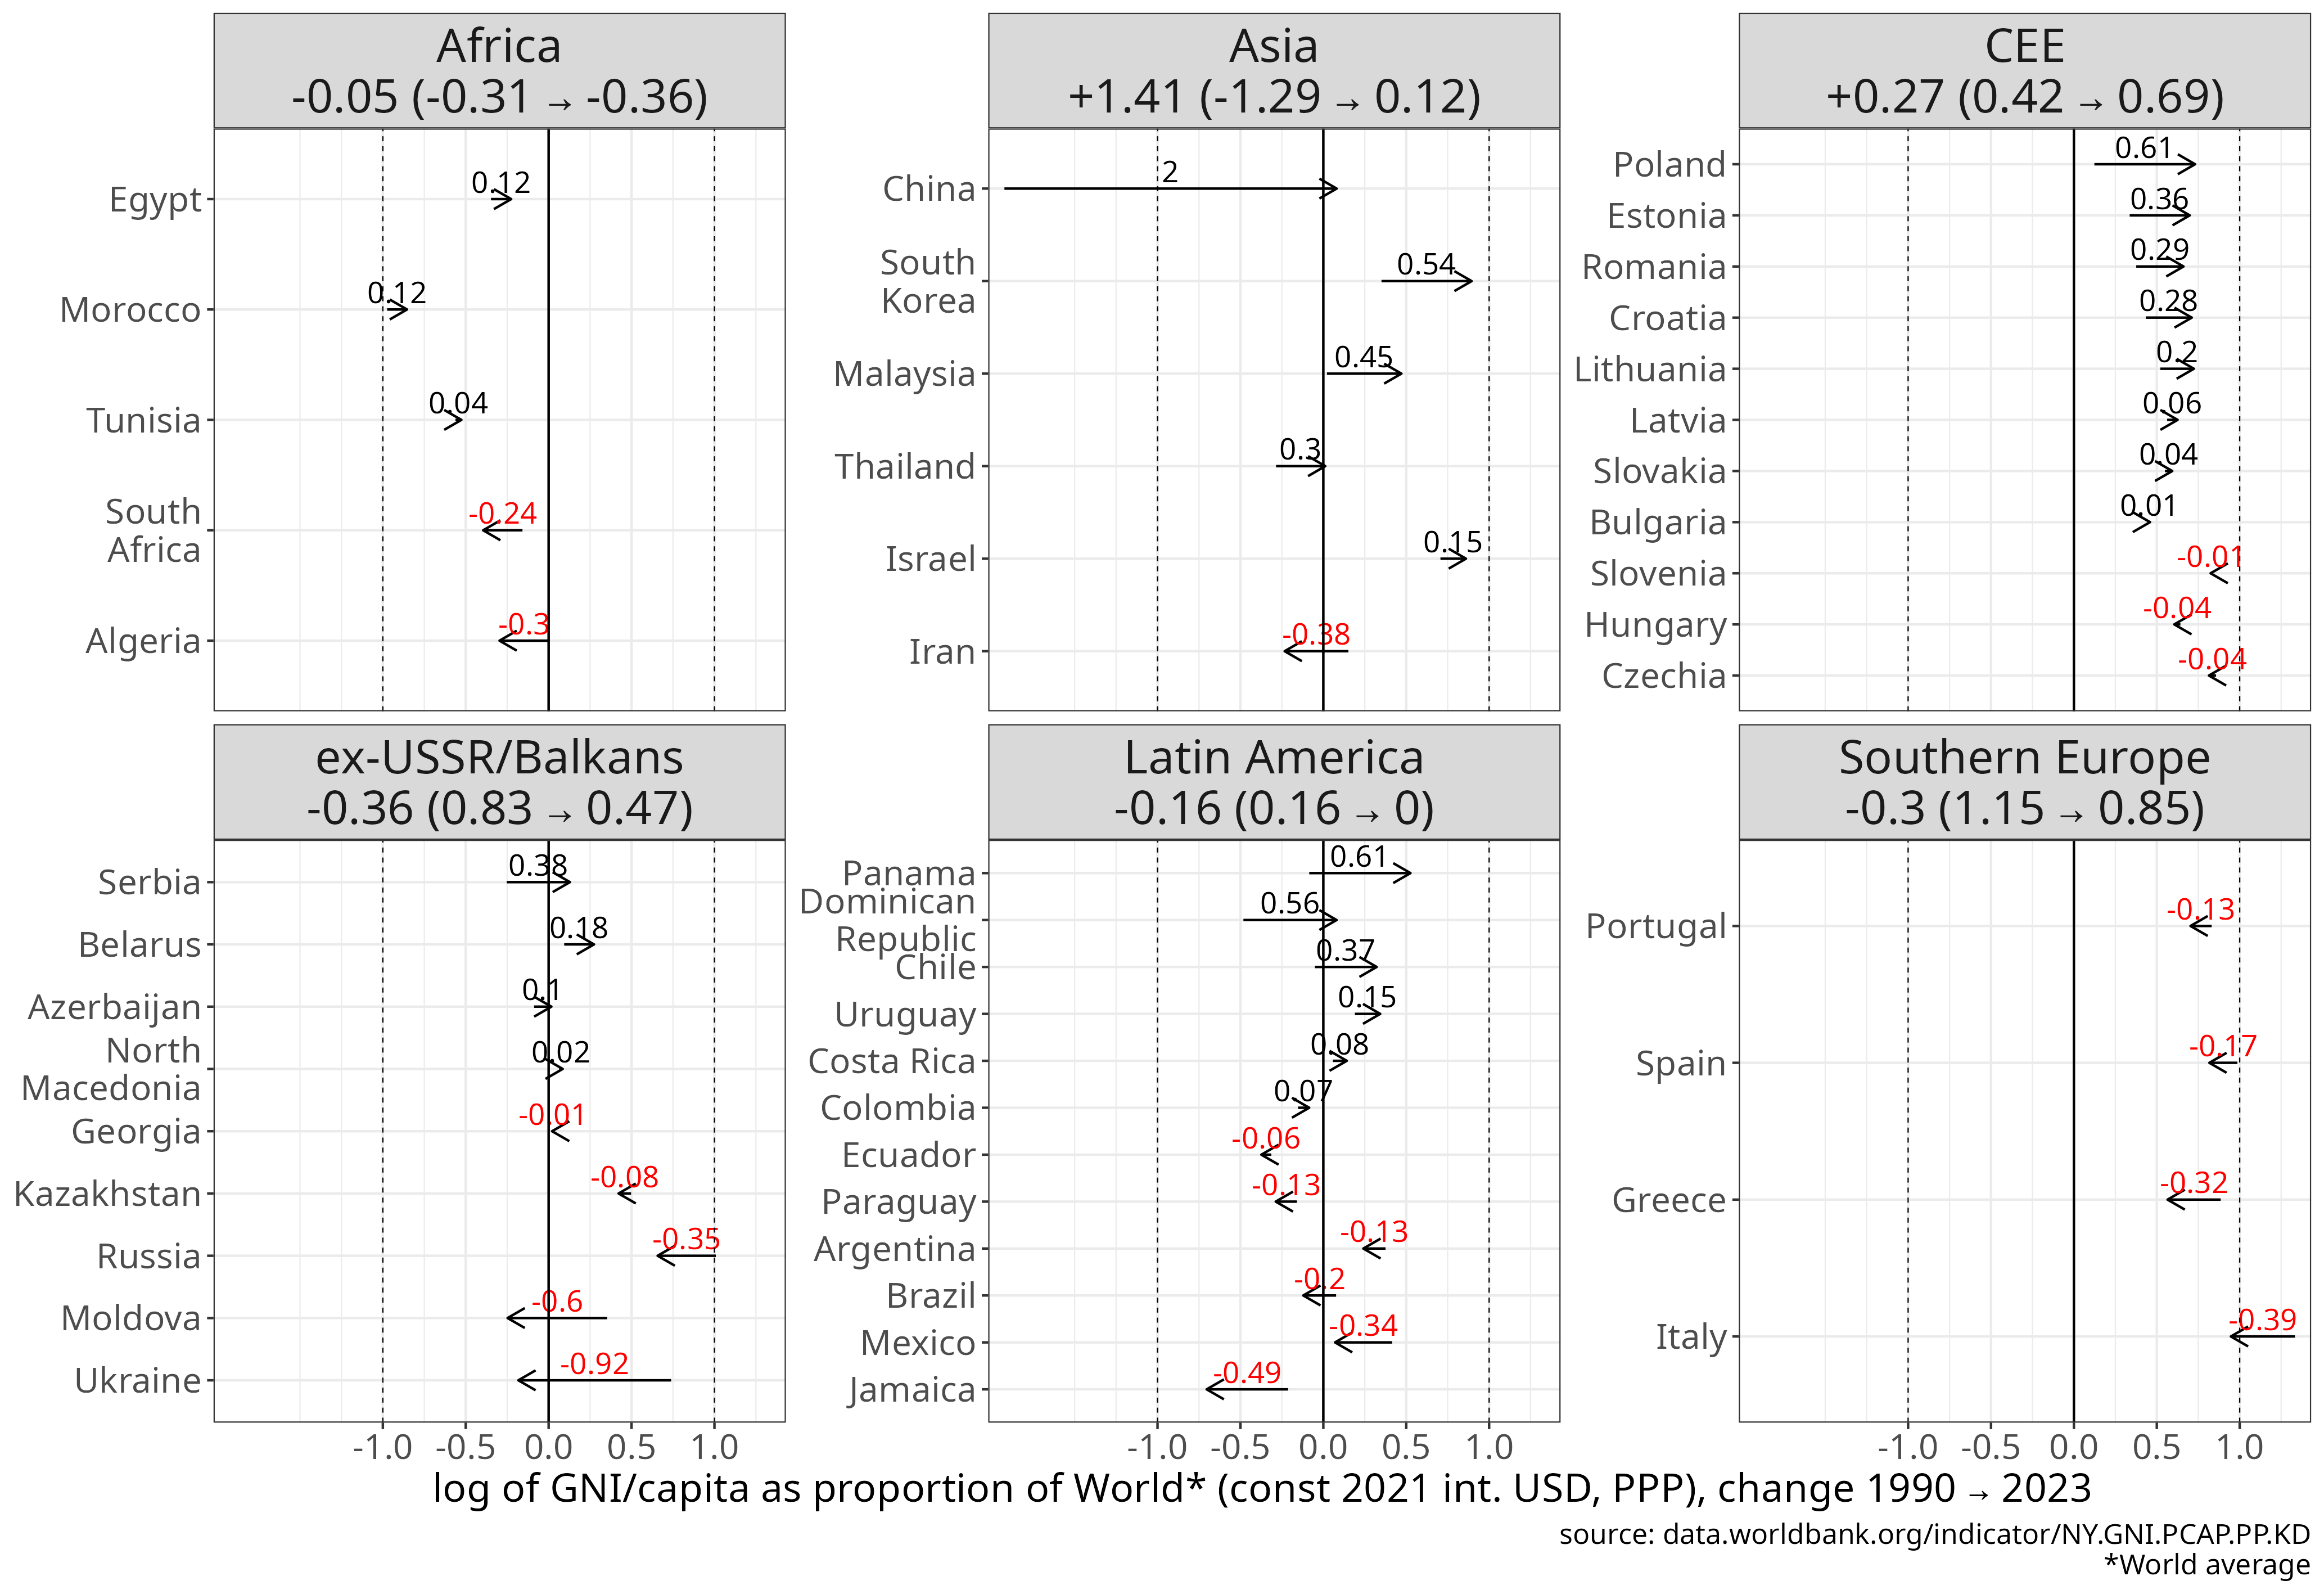
Figure 6
Change in GNI/capita by region since 1990.
Units: absolute values in PPP (constant 2021 international $) or relative to the Western core, Southern Europe, Latin America and World average. Linear scale shows the absolute difference between start and end point. Log scale show the (natural) logarithm of the ratio of the end to start value.
[download plot data]
[source]
The shifts in GNI per capita figures are a few percentage points smaller than those of GDP per capita. When comparing to Germany, in GDP per capita the cumulative change for the two fastest converging regions were +32% (Asia) and +27% (CEE), respectively, while in GNI per capita they are +28% and +23%.
For a systematic comparison, Figure 7 shows the cumulative changes from 1990 to 2024 in GNI/capita (x-axis) vs GDP/capita (y-axis) as a scatter plot. Points above the diagonals show a larger increase in GDP/capita than in GNI/capita. We can see that this was the case for several CEE countries, especially for HU, BG and SK, where convergence (expressed as % of DE/G7 level) of GDP/capita is almost 2x of that of GNI/capita. The latter countries also showed +8 to 12% convergence in GNI per capita to the German level, however their convergence in GDP per capita was nearly 2x larger. The weighted average of GNI/capita of CEE has increased 2.4x in absolute terms (constant USD) and moved from 40 to 63% of the German level. This discrepancy between GNI/capita and GDP/capita for some CEE countries could be an indicator for heavy reliance on foreign investment with lower proportion of domestic value added, leading to large outflows of profits on the FDI stock. This hypothesis would require further analysis to substantiate.
Figure 7
Change in GNI/capita (x-axis) and GDP/capita (y-axis) by region since 1990. Units: absolute values in PPP (constant 2021 international $) or relative to the Western core, Southern Europe, Latin America and World average. Linear scale shows the absolute difference between start and end point. Log scale show the (natural) logarithm of the ratio of the end to start value.
[download plot data]
[source (GNI)]
[source (GDP)]
Labour productivity trends since 1990
GDP or GNI per capita are composite measures. They depend on three main factors: labour productivity per hour worked, average working hours, and the share of the population employed (employment rate):
The employment rate used here is relative to the total population and it has a natural ceiling determined by the age structure, since only people roughly between 18 and 70 years old are of working age. In high-income countries, many aged 18-25 are still in education (and so mostly not employed), while employment also tends to decline after age 65, although this can change if the retirement age is increased. In HICs typically around 55-60% of the total 15+ population will be in (some type of) work. Similarly, the number of annual working hours are mostly within a narrow range (typically 1400 to 1700 hours) for HICs and have trended slowly downward in the last 40-50 years. In some OECD countries (HICs), annual working hours are relatively higher - for example, around 2,000 hours in South Korea - but even there, they have been trending downward. It is unlikely that working hours would increase again, especially with growing automation. Similarly, in most high-income countries the employment rate is already close to its practical ceiling, given current age structures and educational needs. This leaves labour productivity as the key driver of convergence.
To assess convergence of productivity levels, we first look at output per person employed in Figure 8, using the same metrics as in Figure 5-6: in absolute terms (constant USD 2020, PPP) and in % of benchmark regions; either looking at absolute differences on a linear scale or (end-to-start) ratios on log scale.
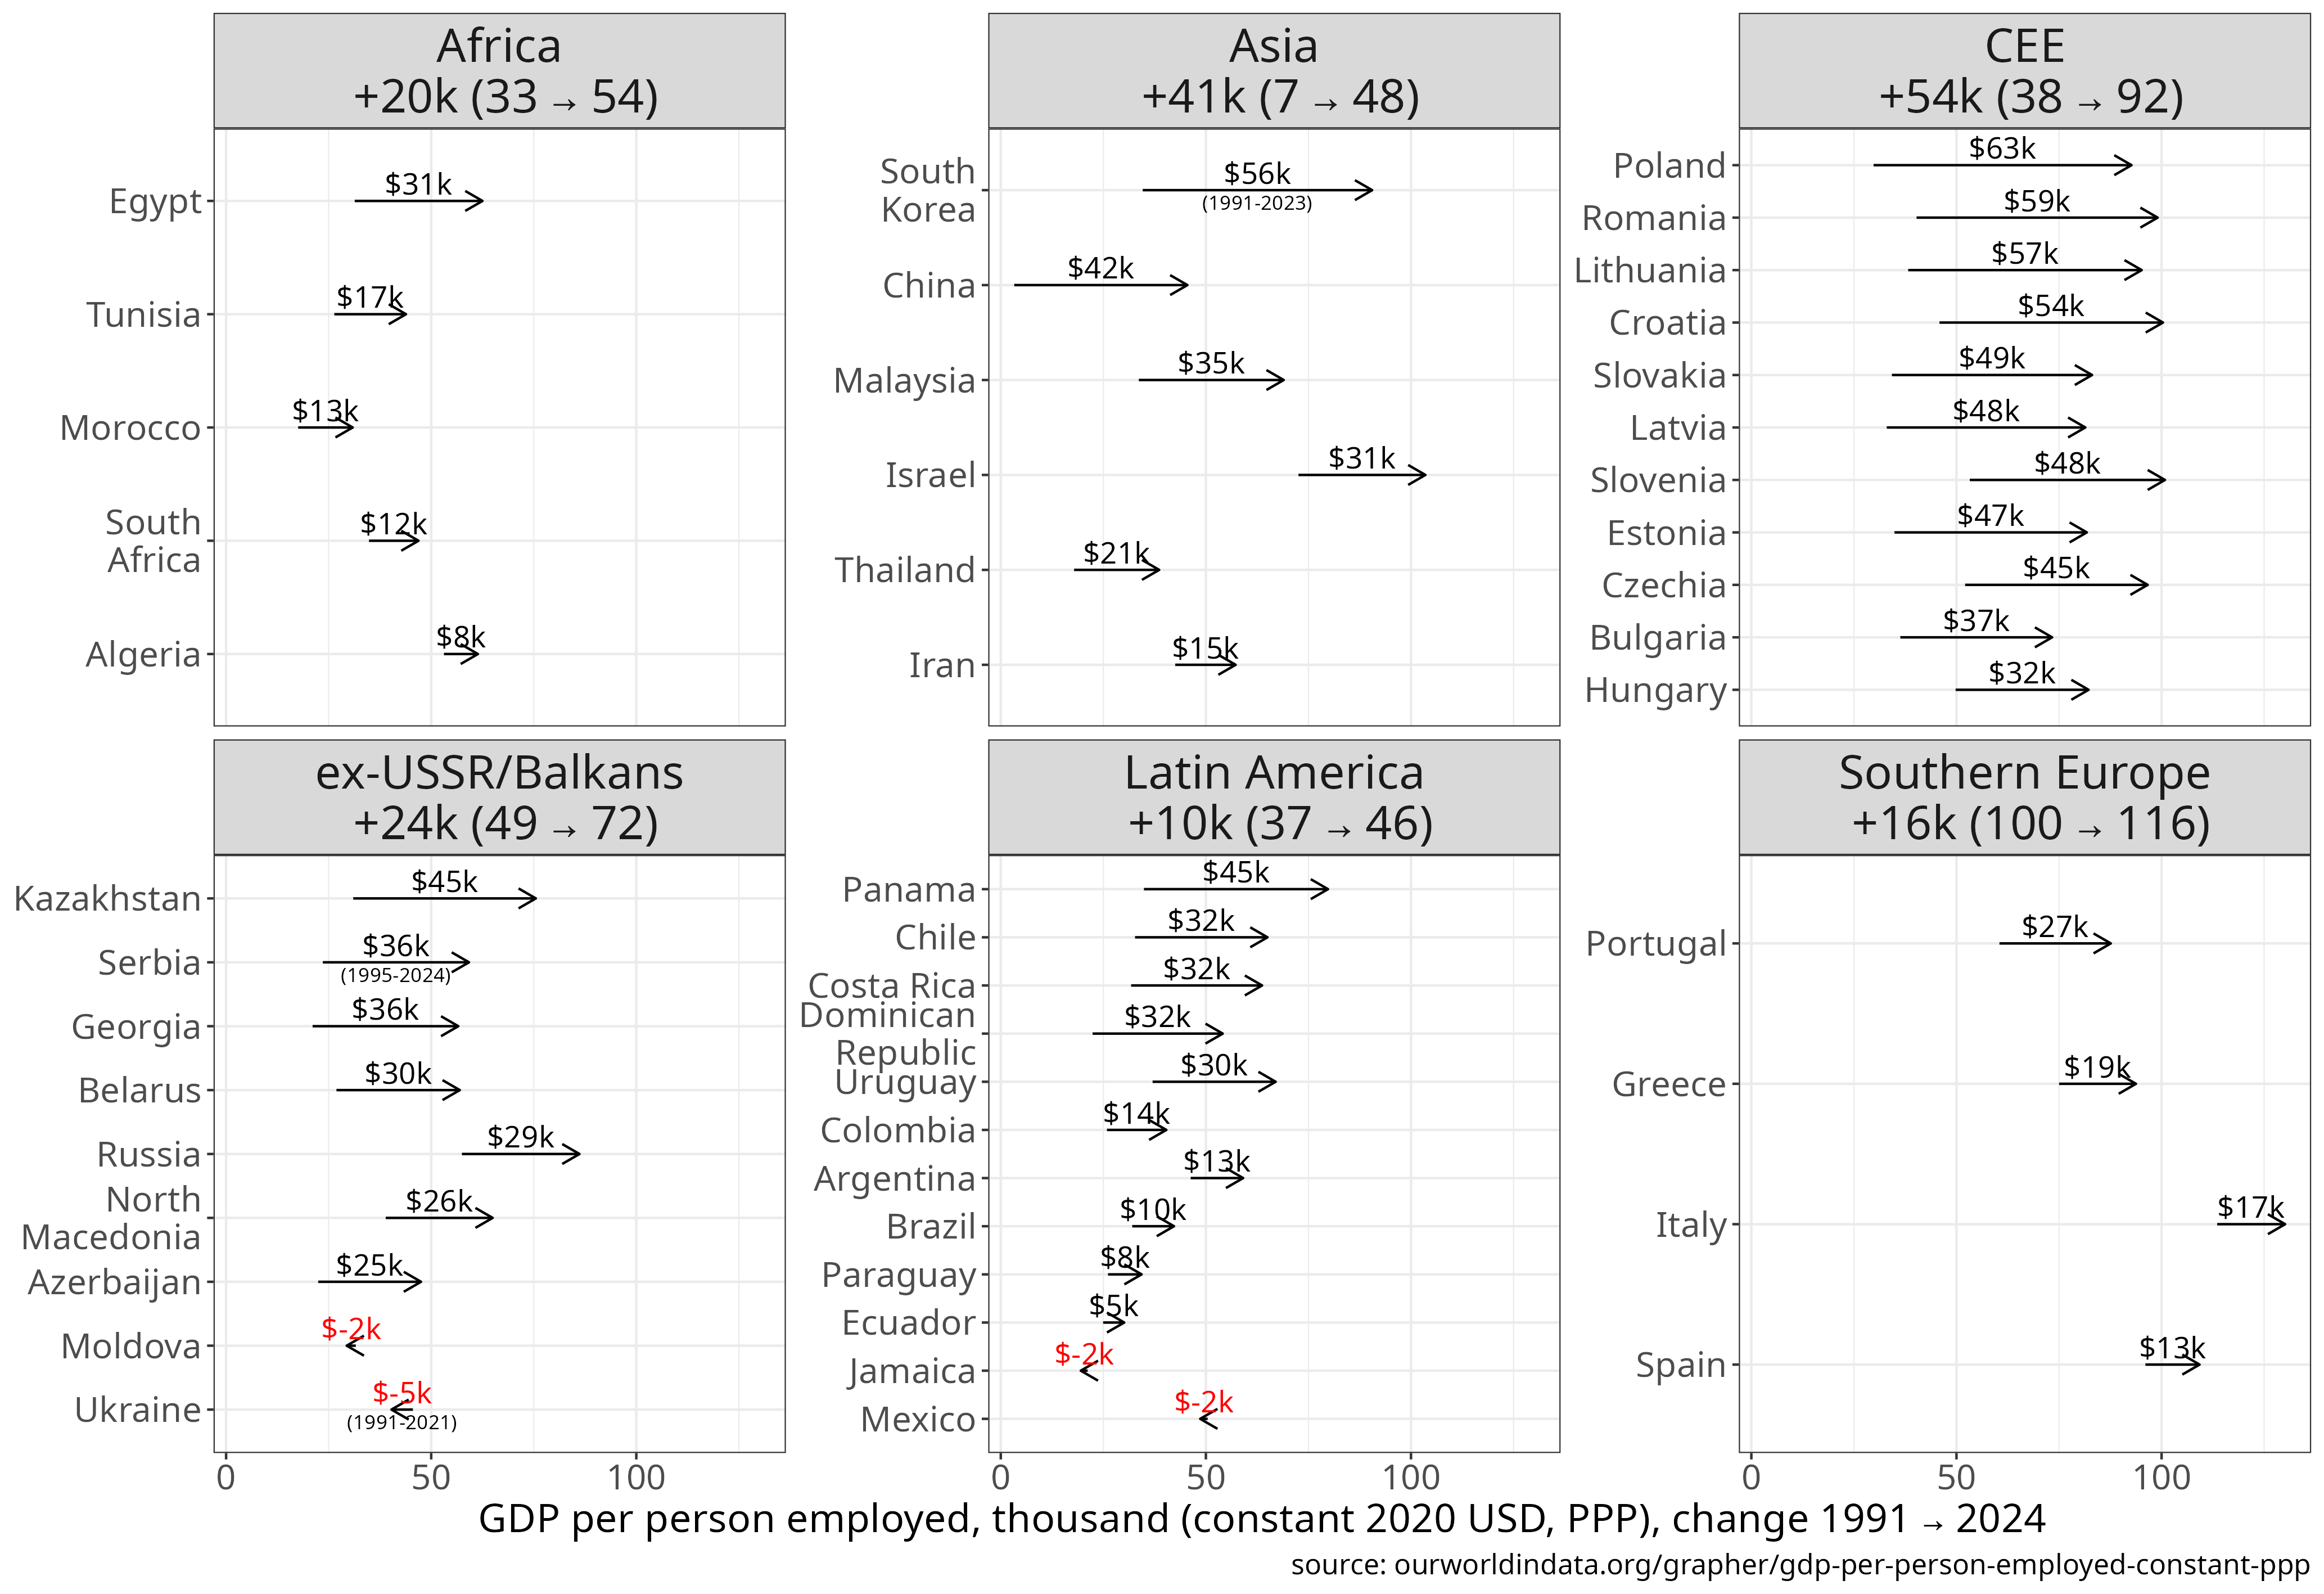
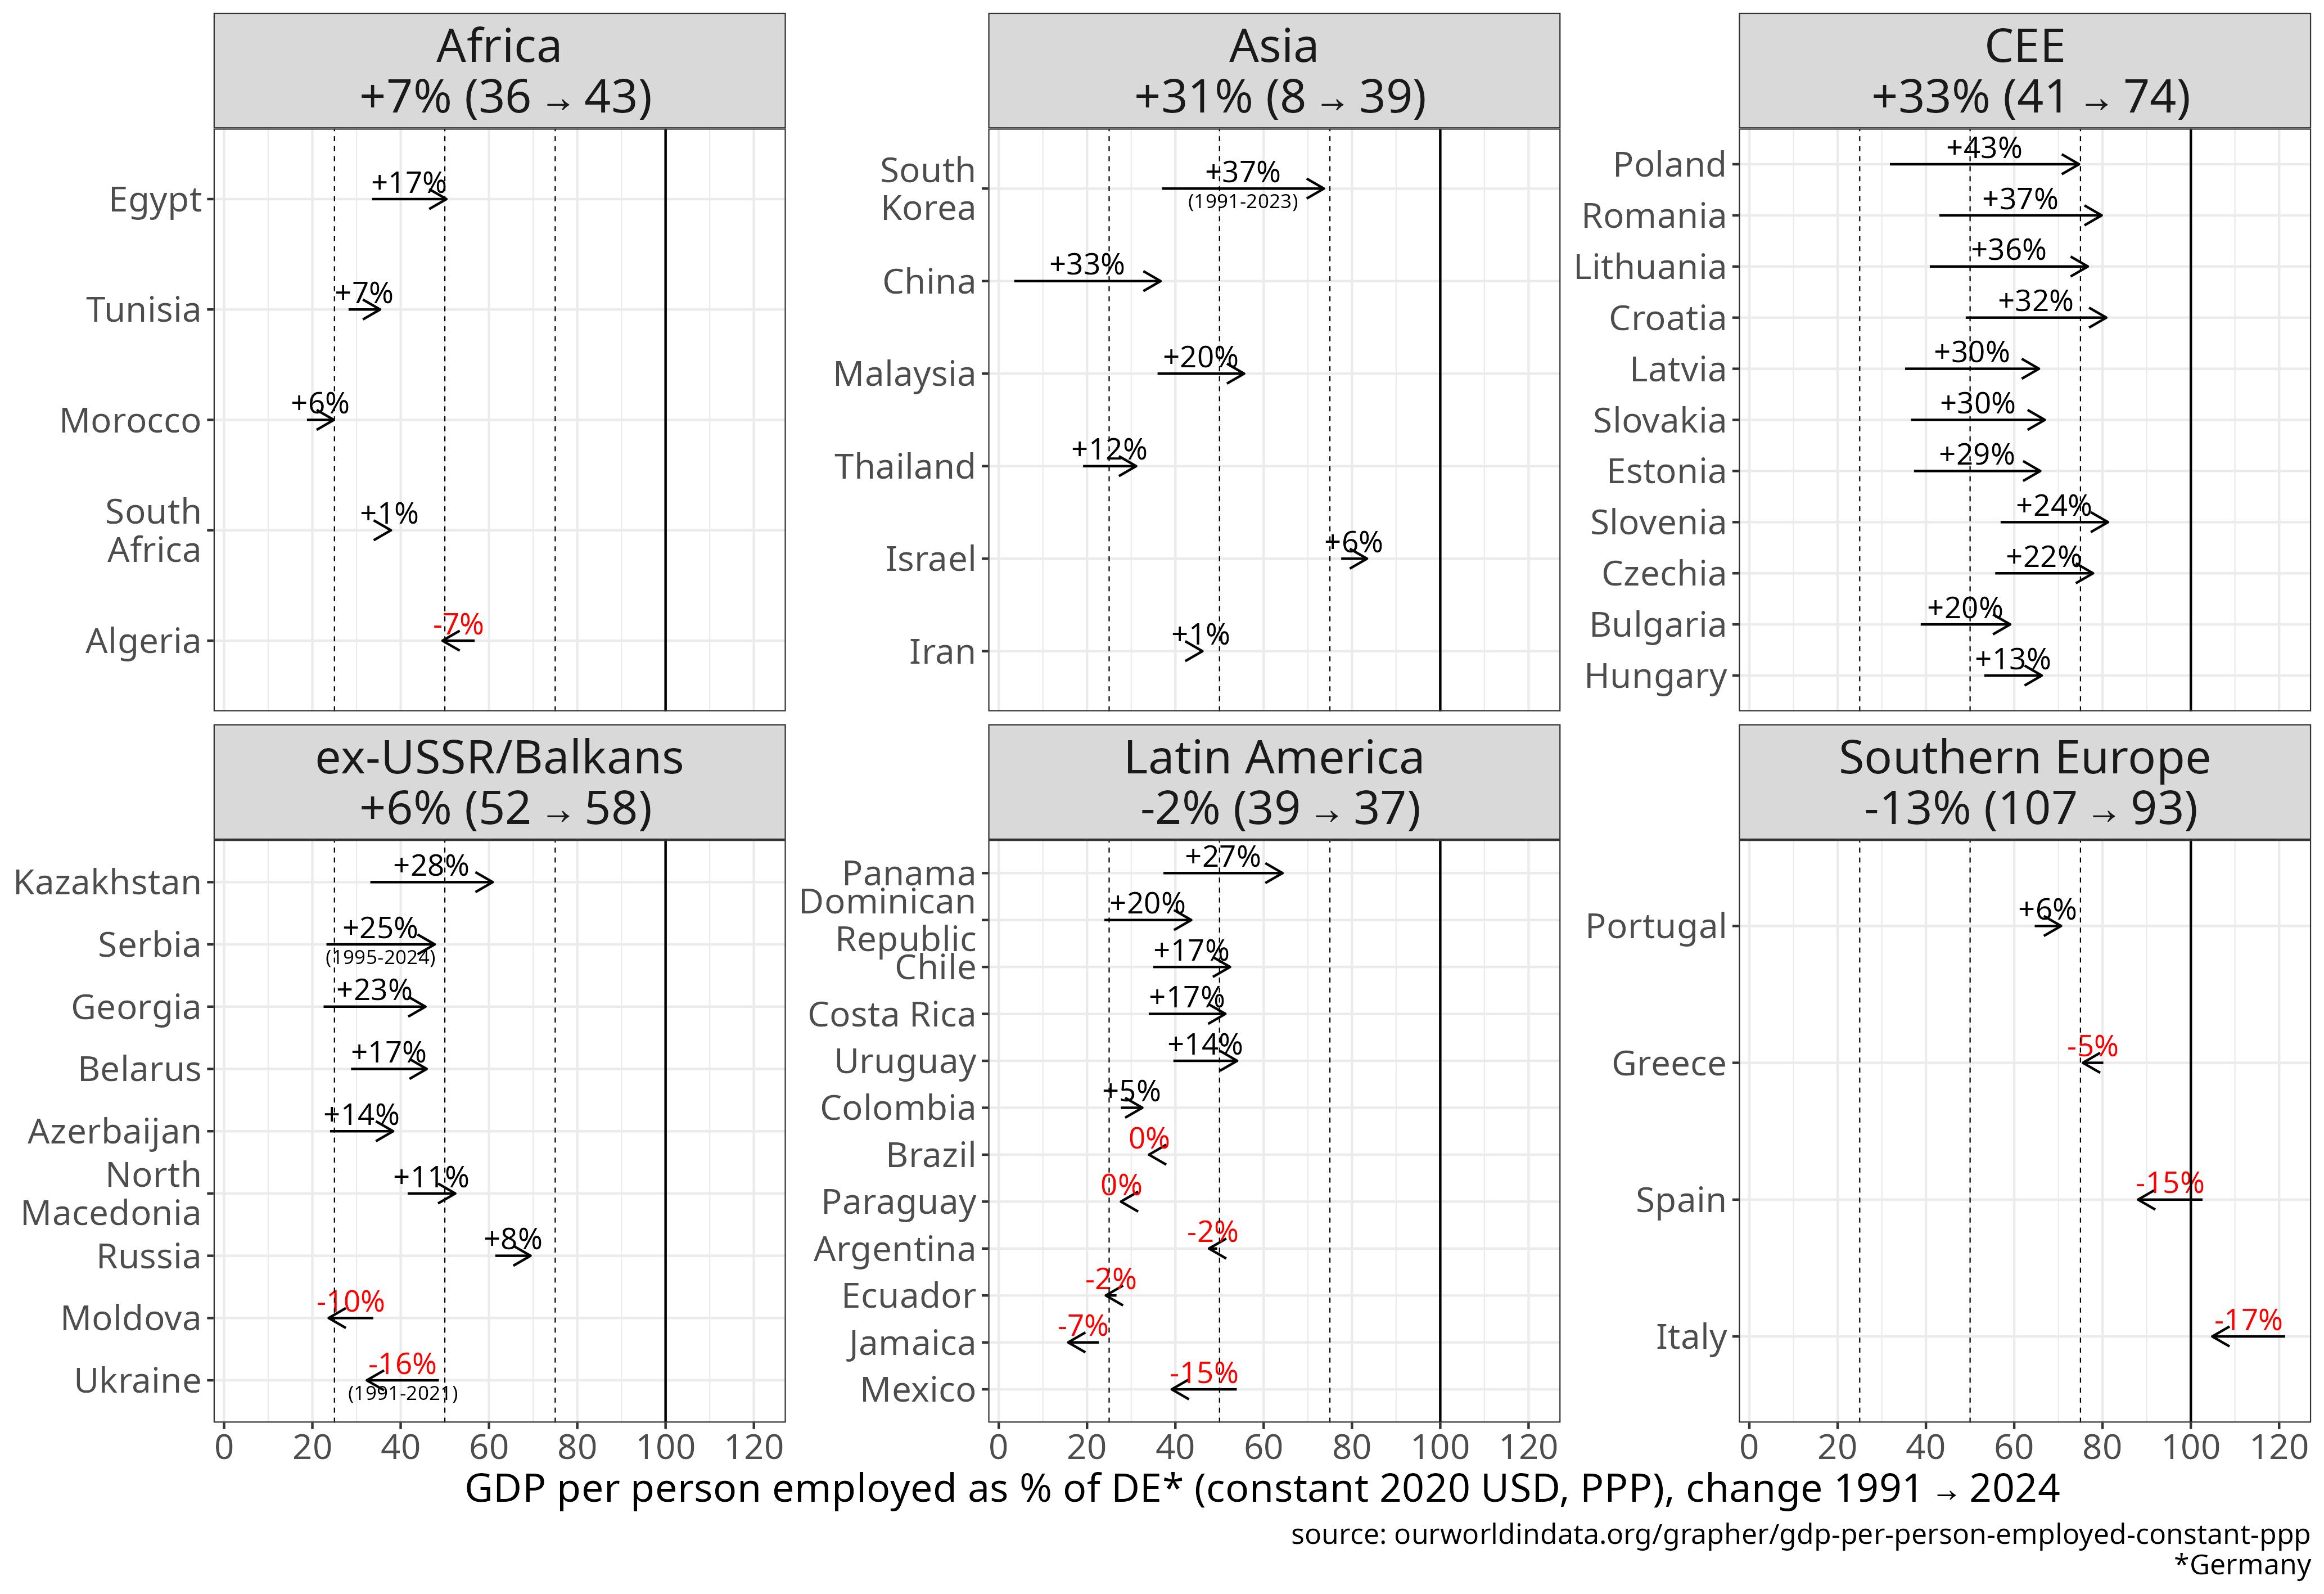
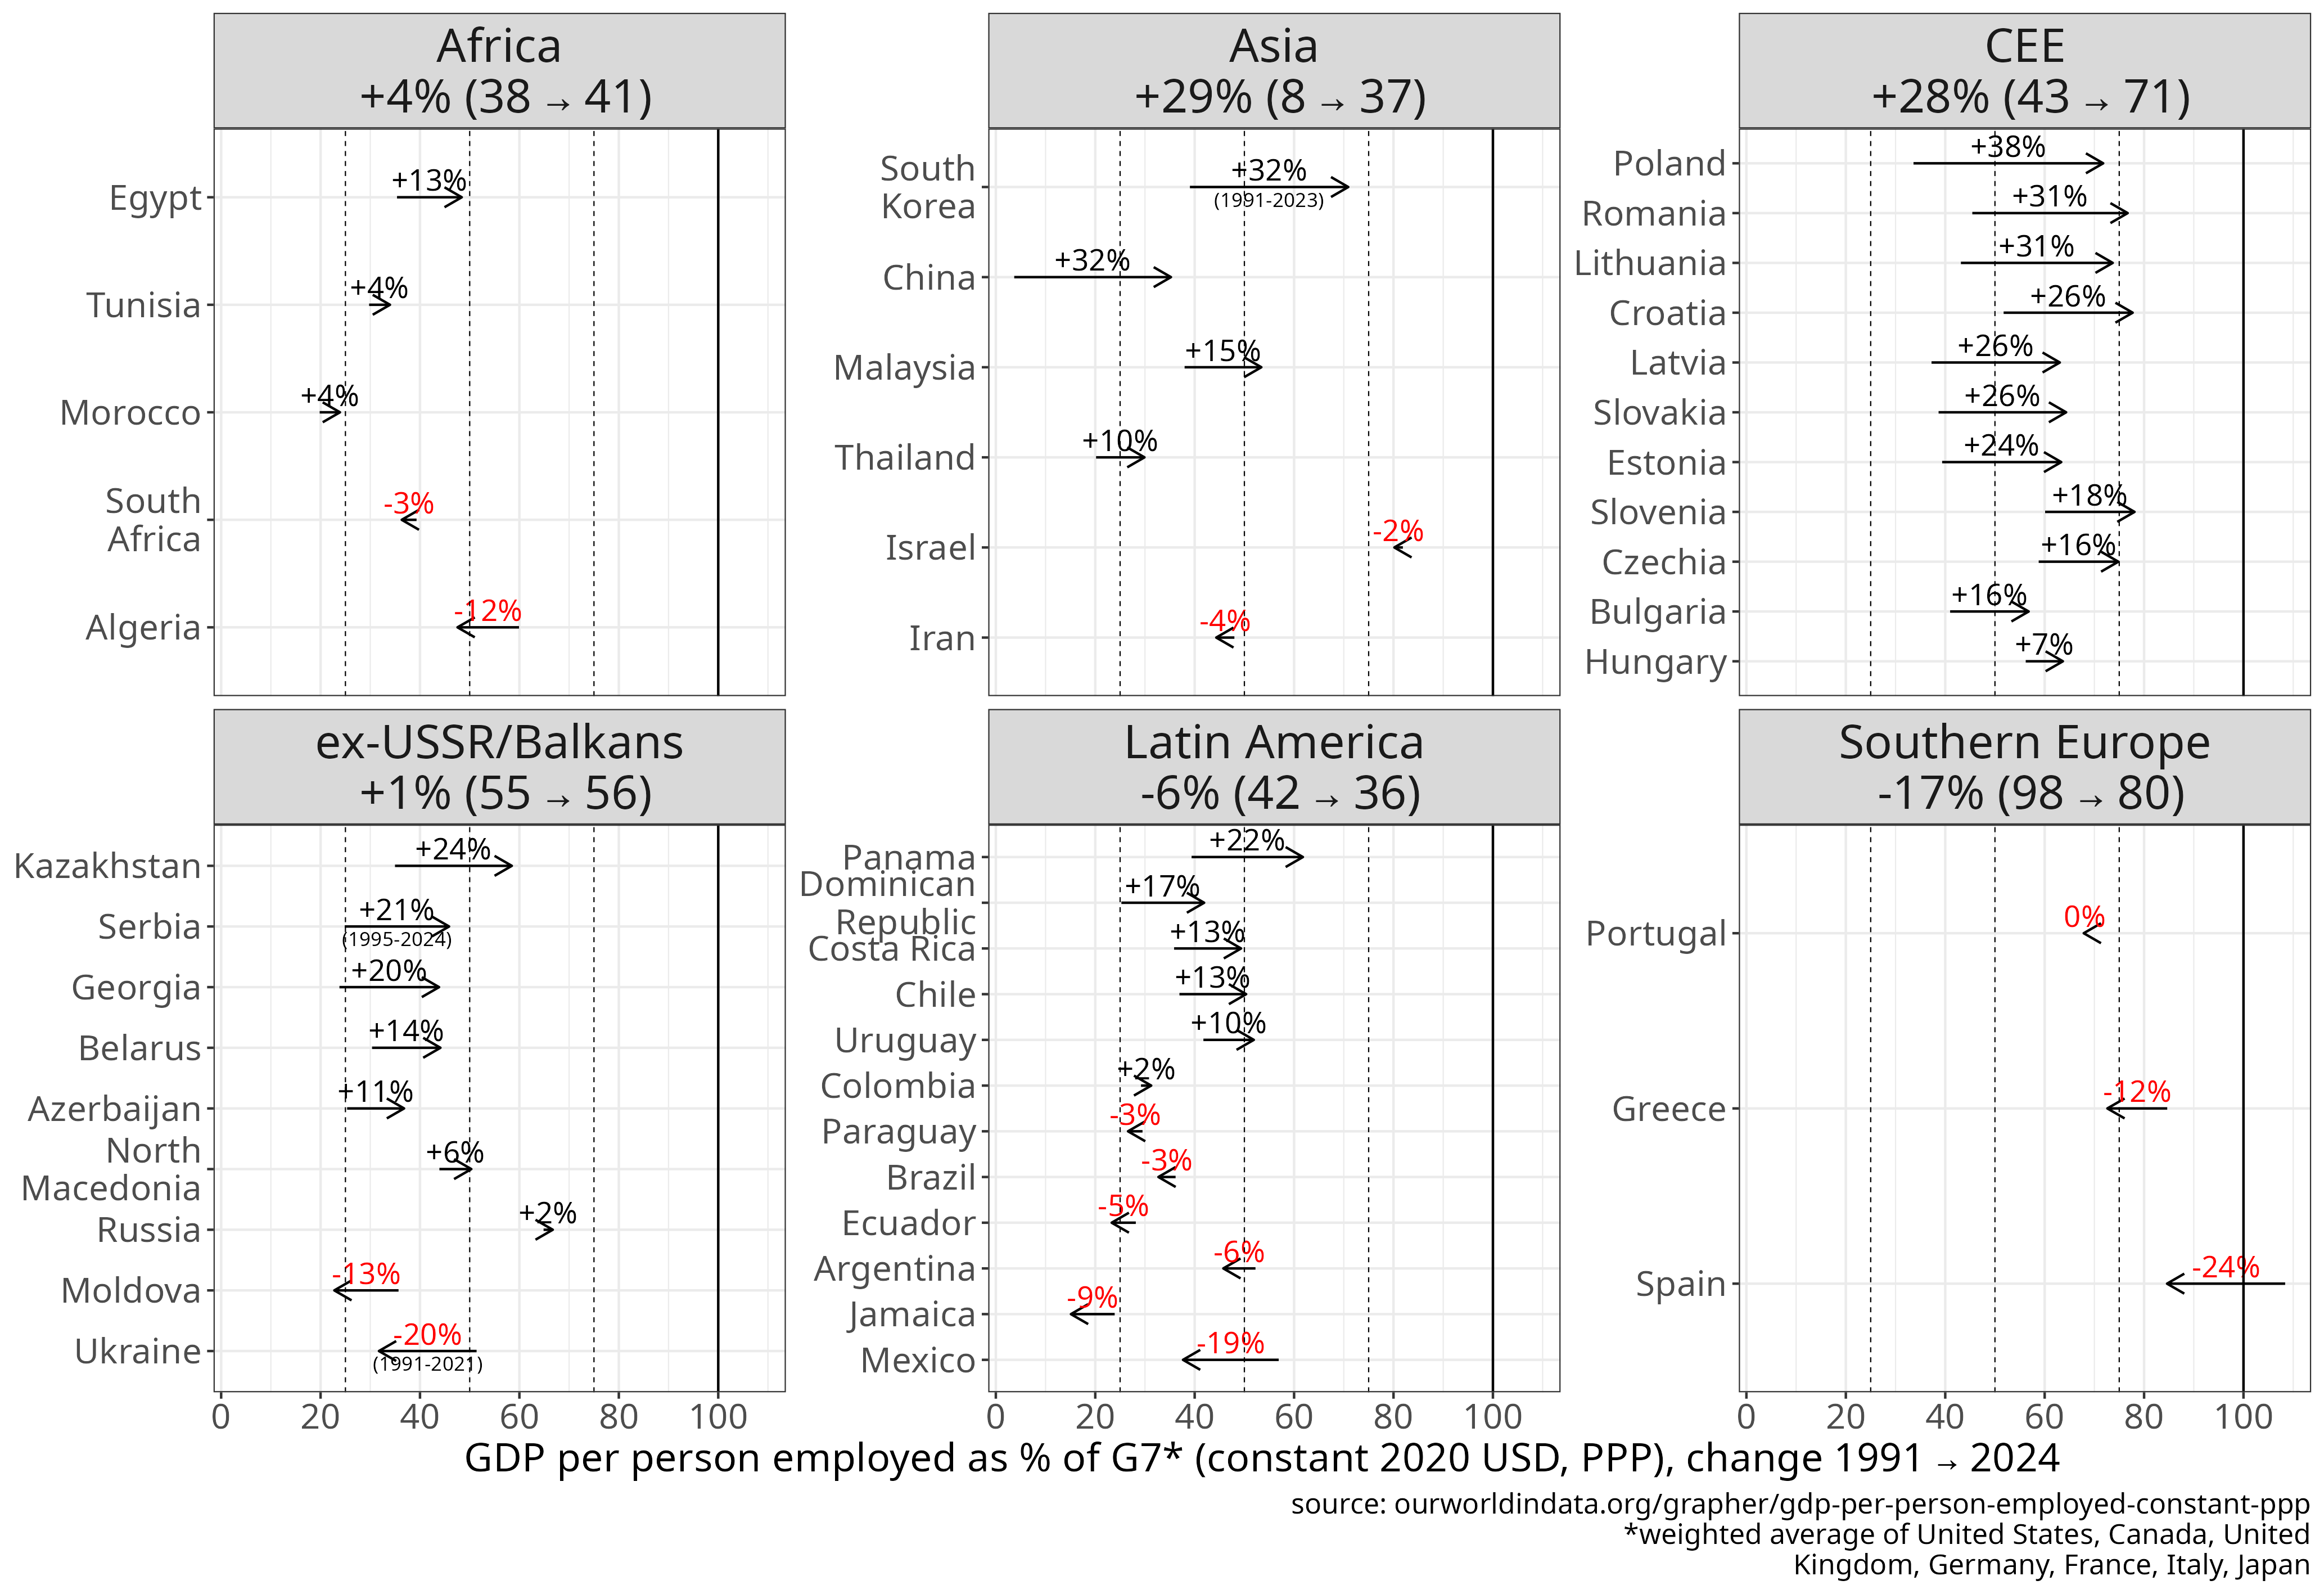
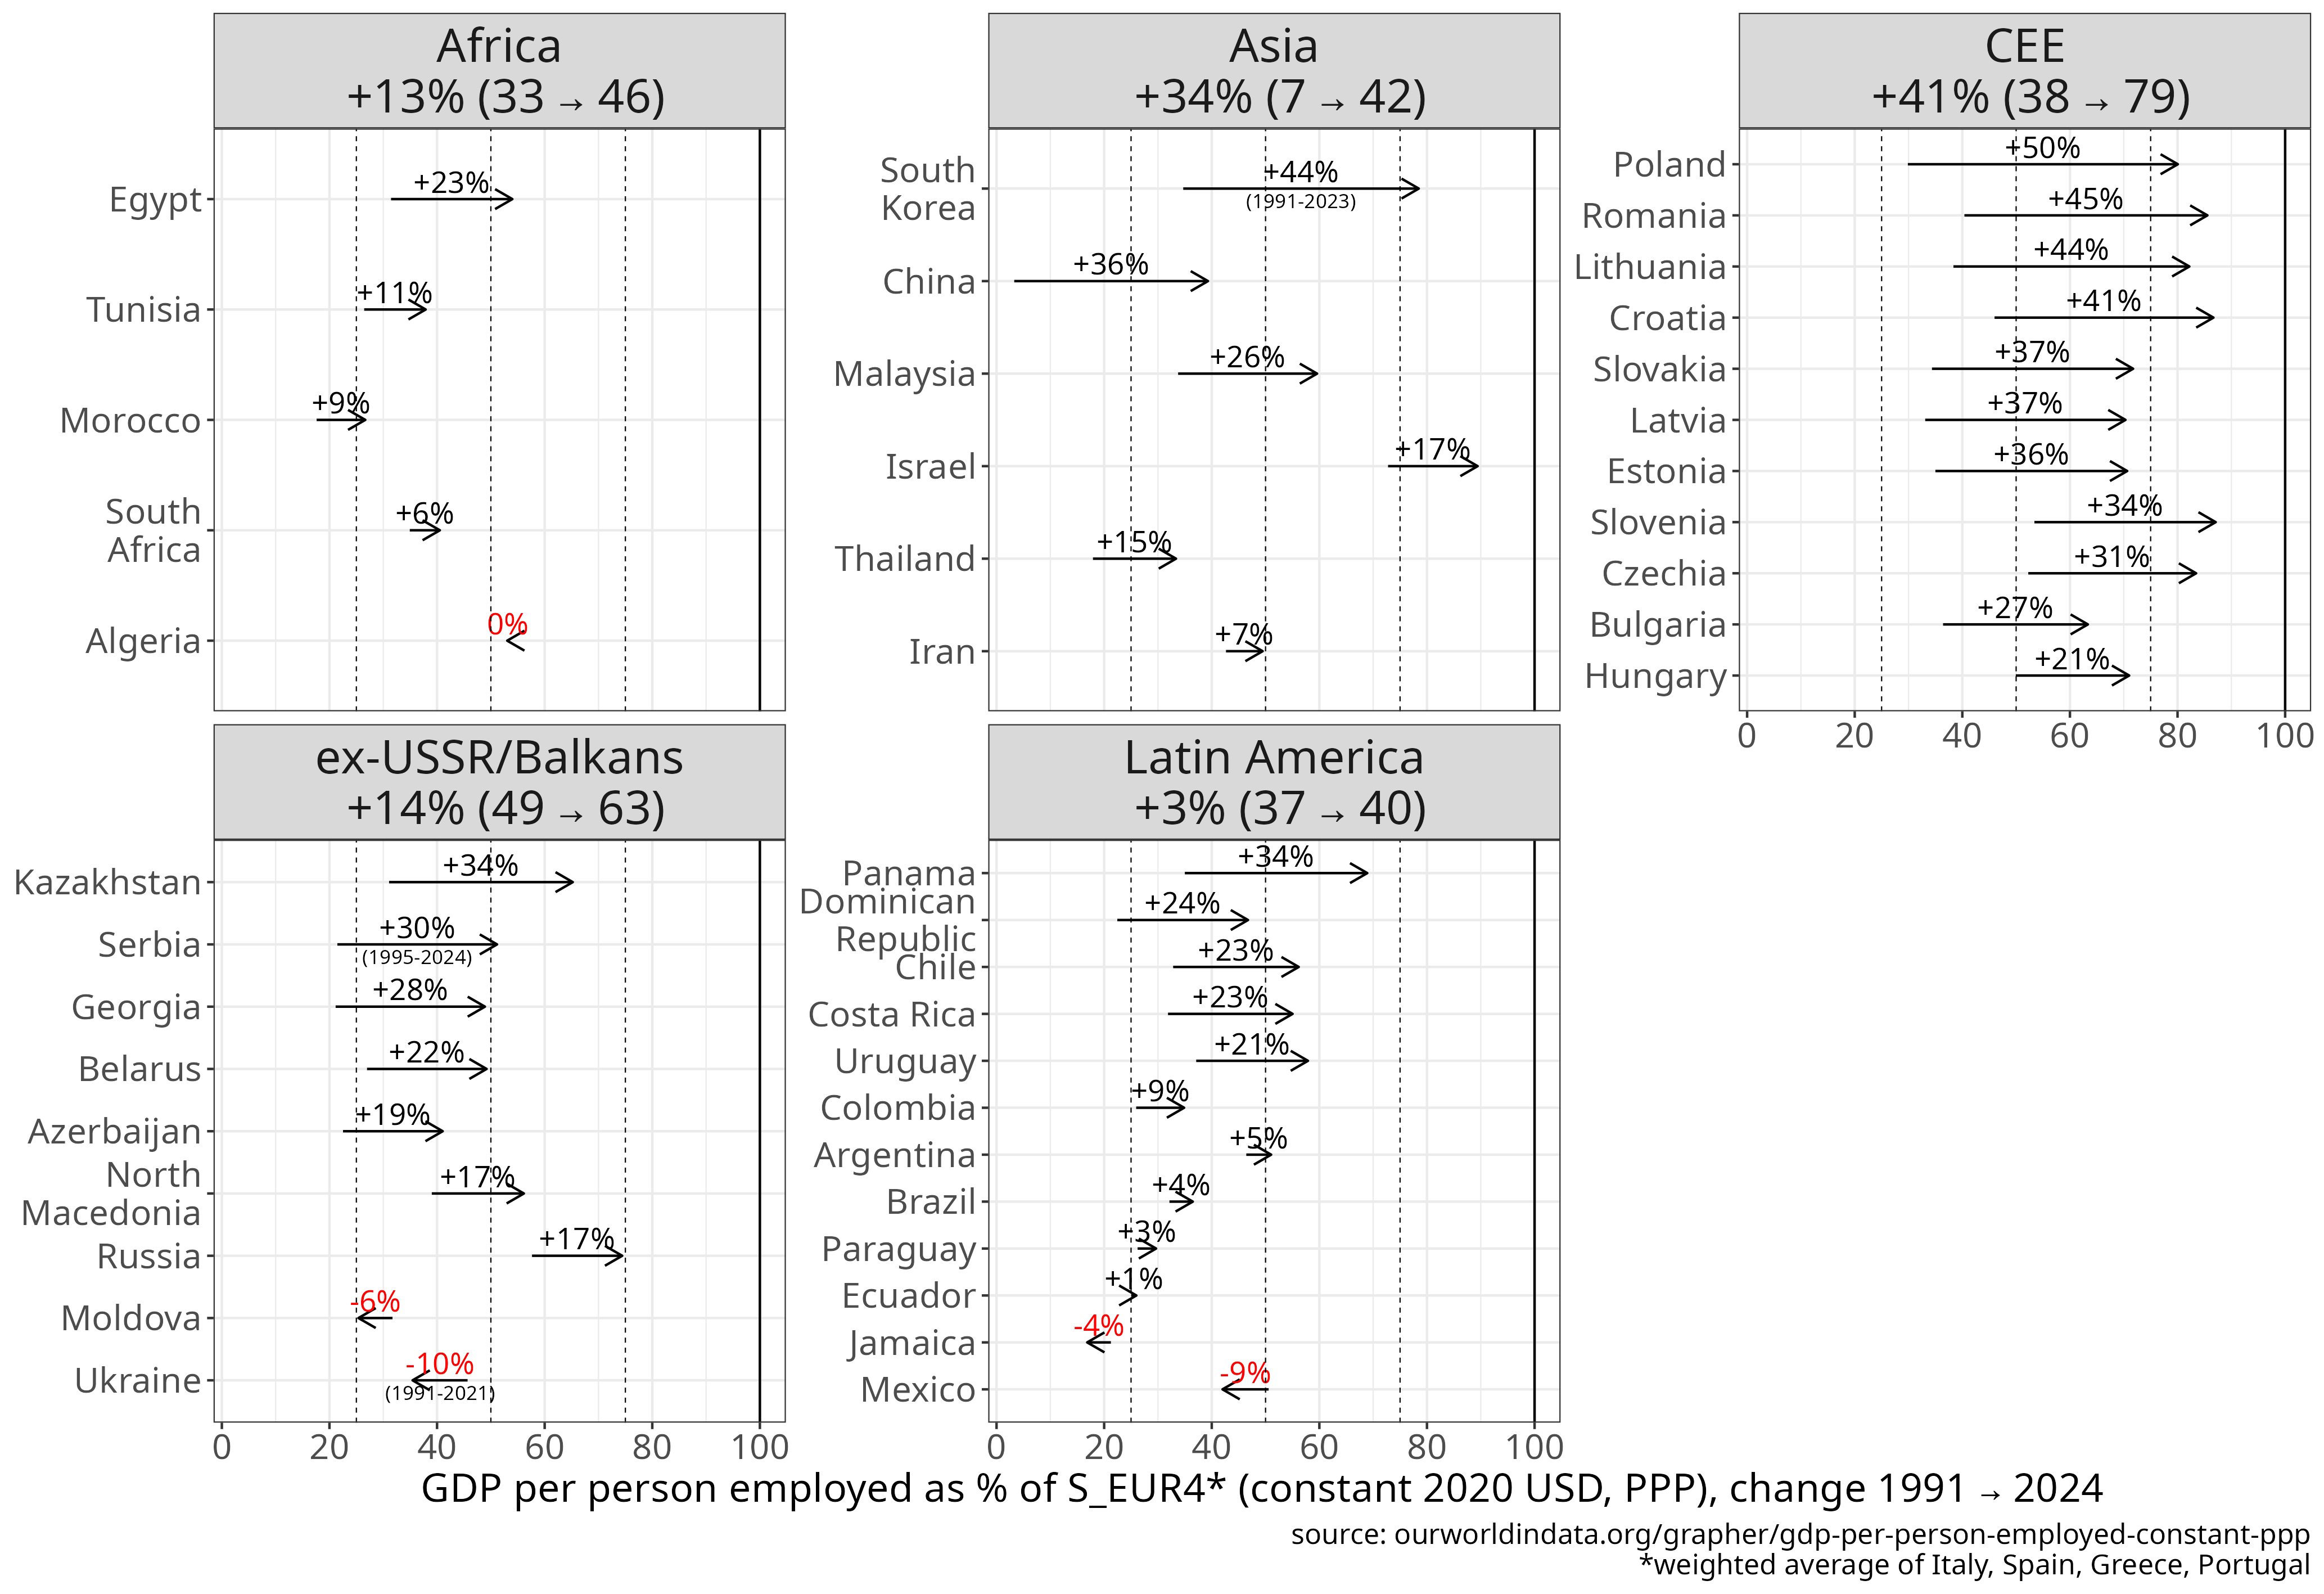
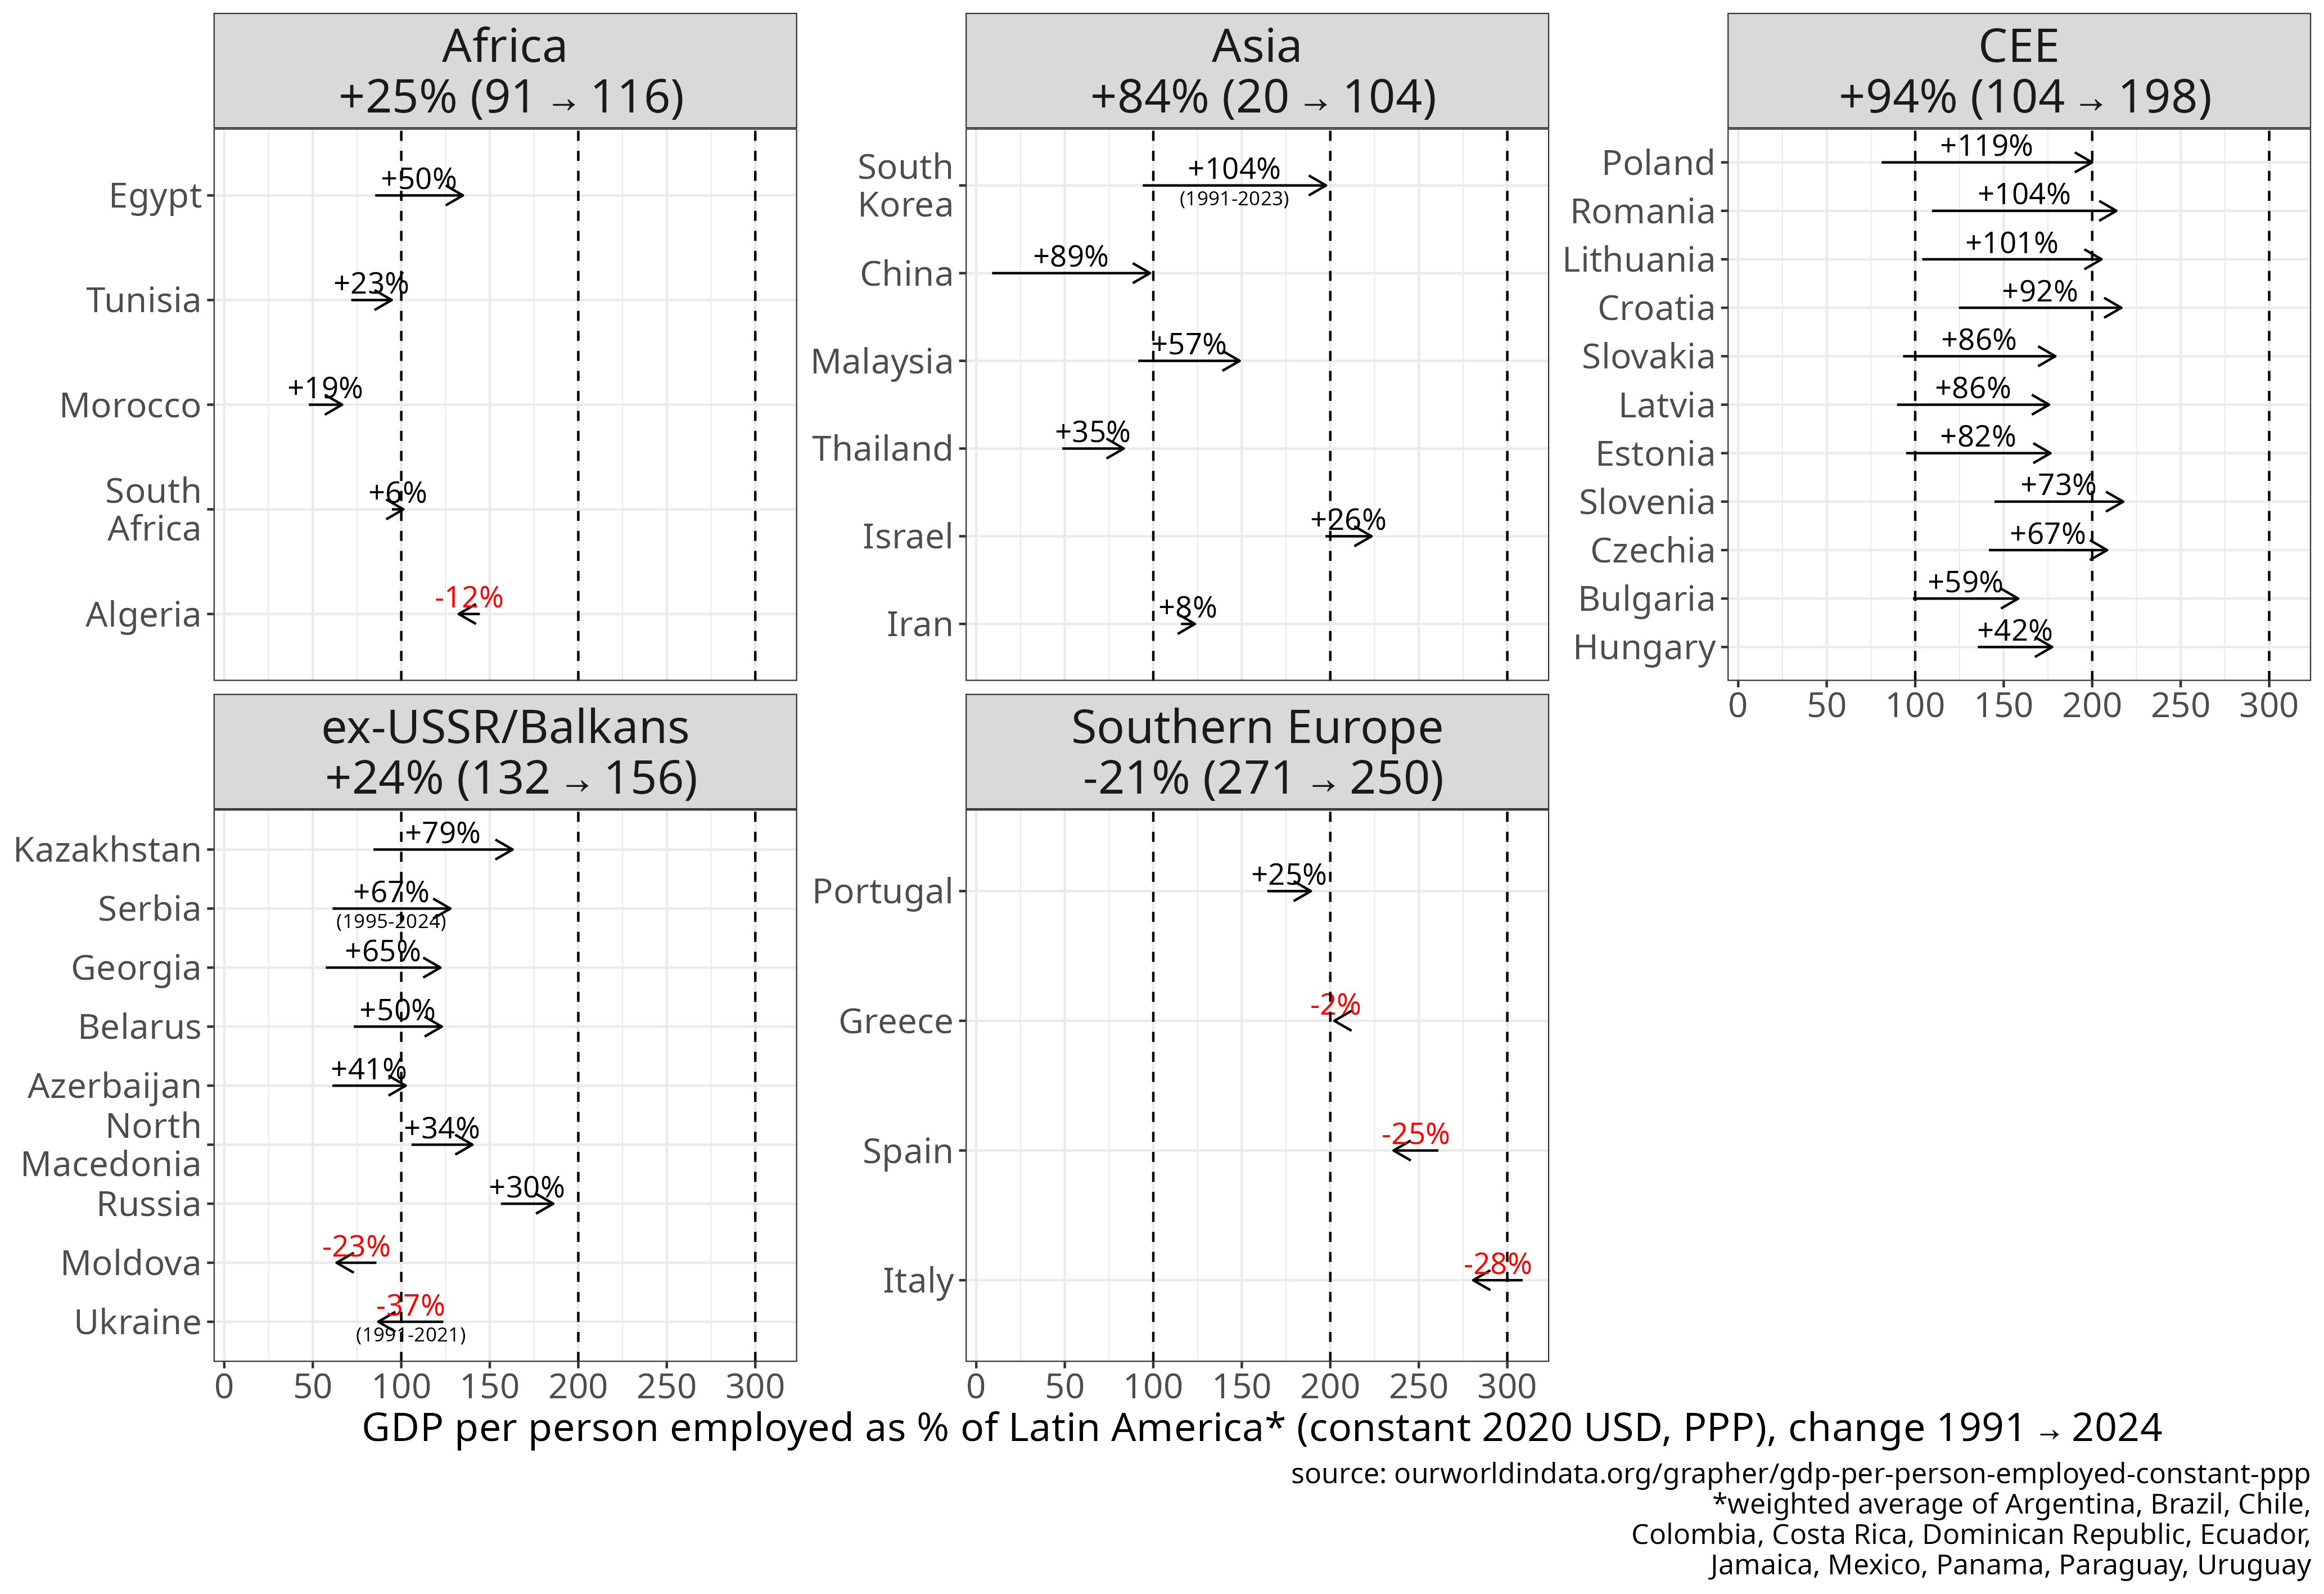
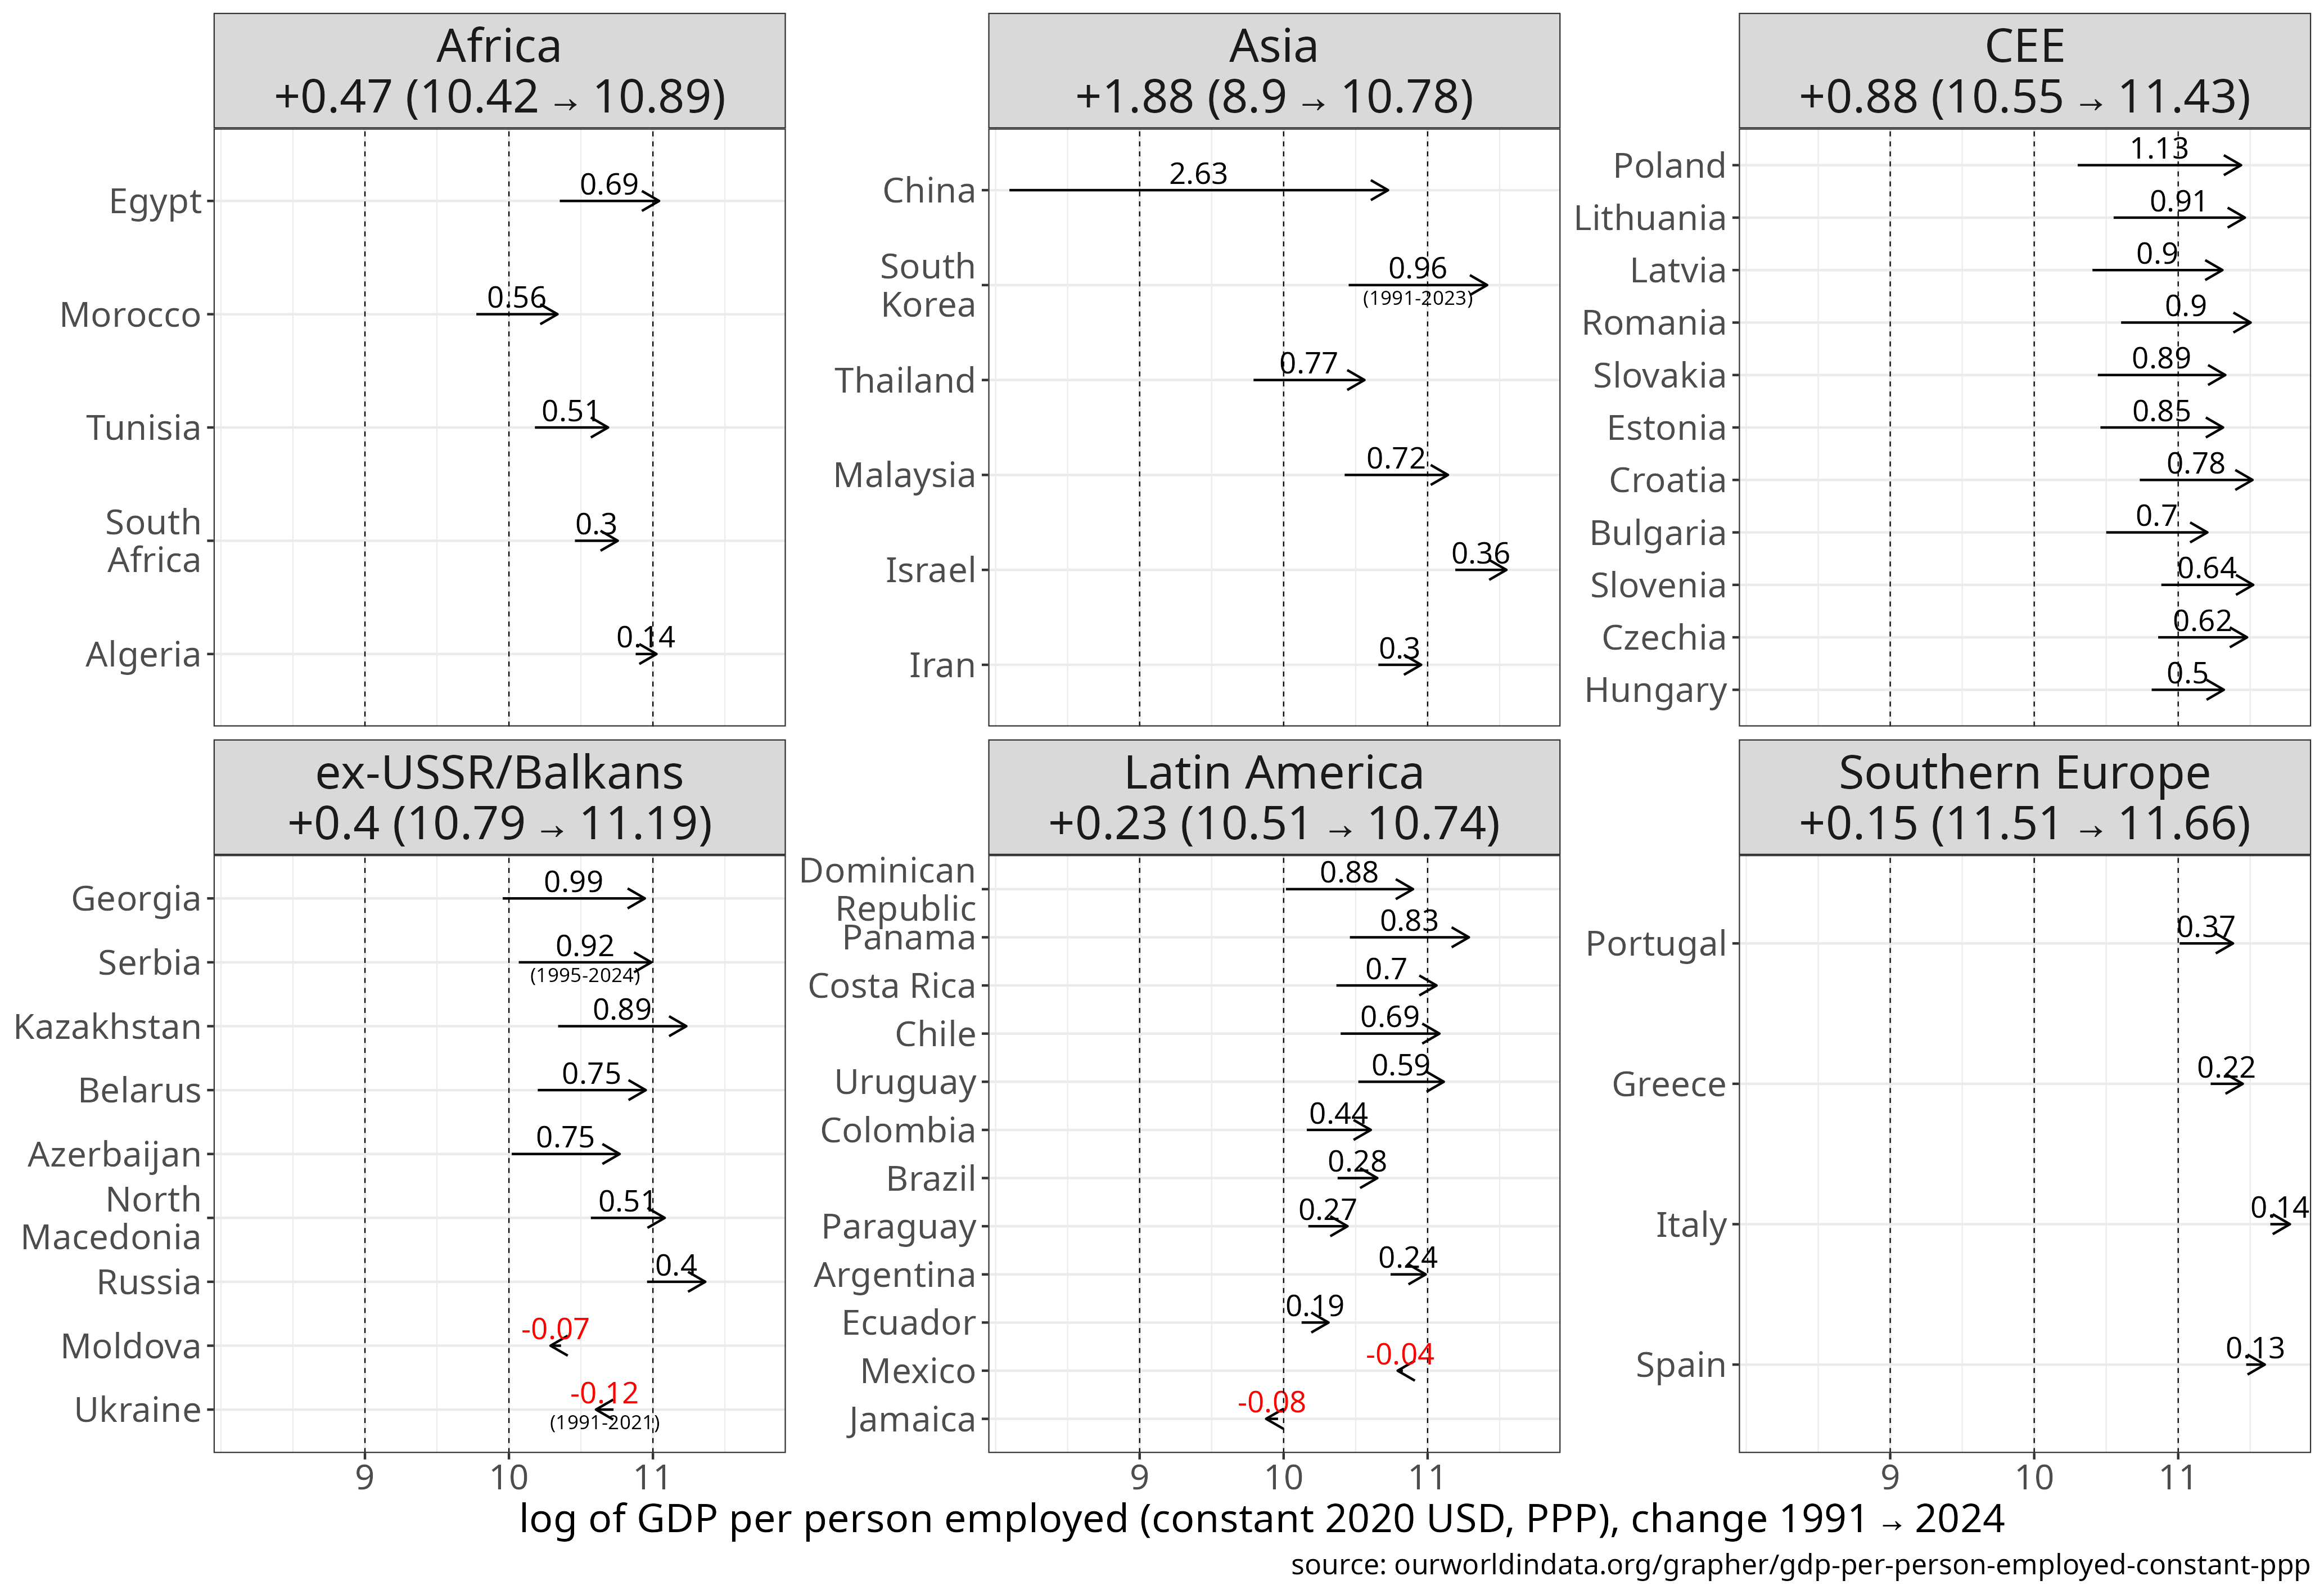
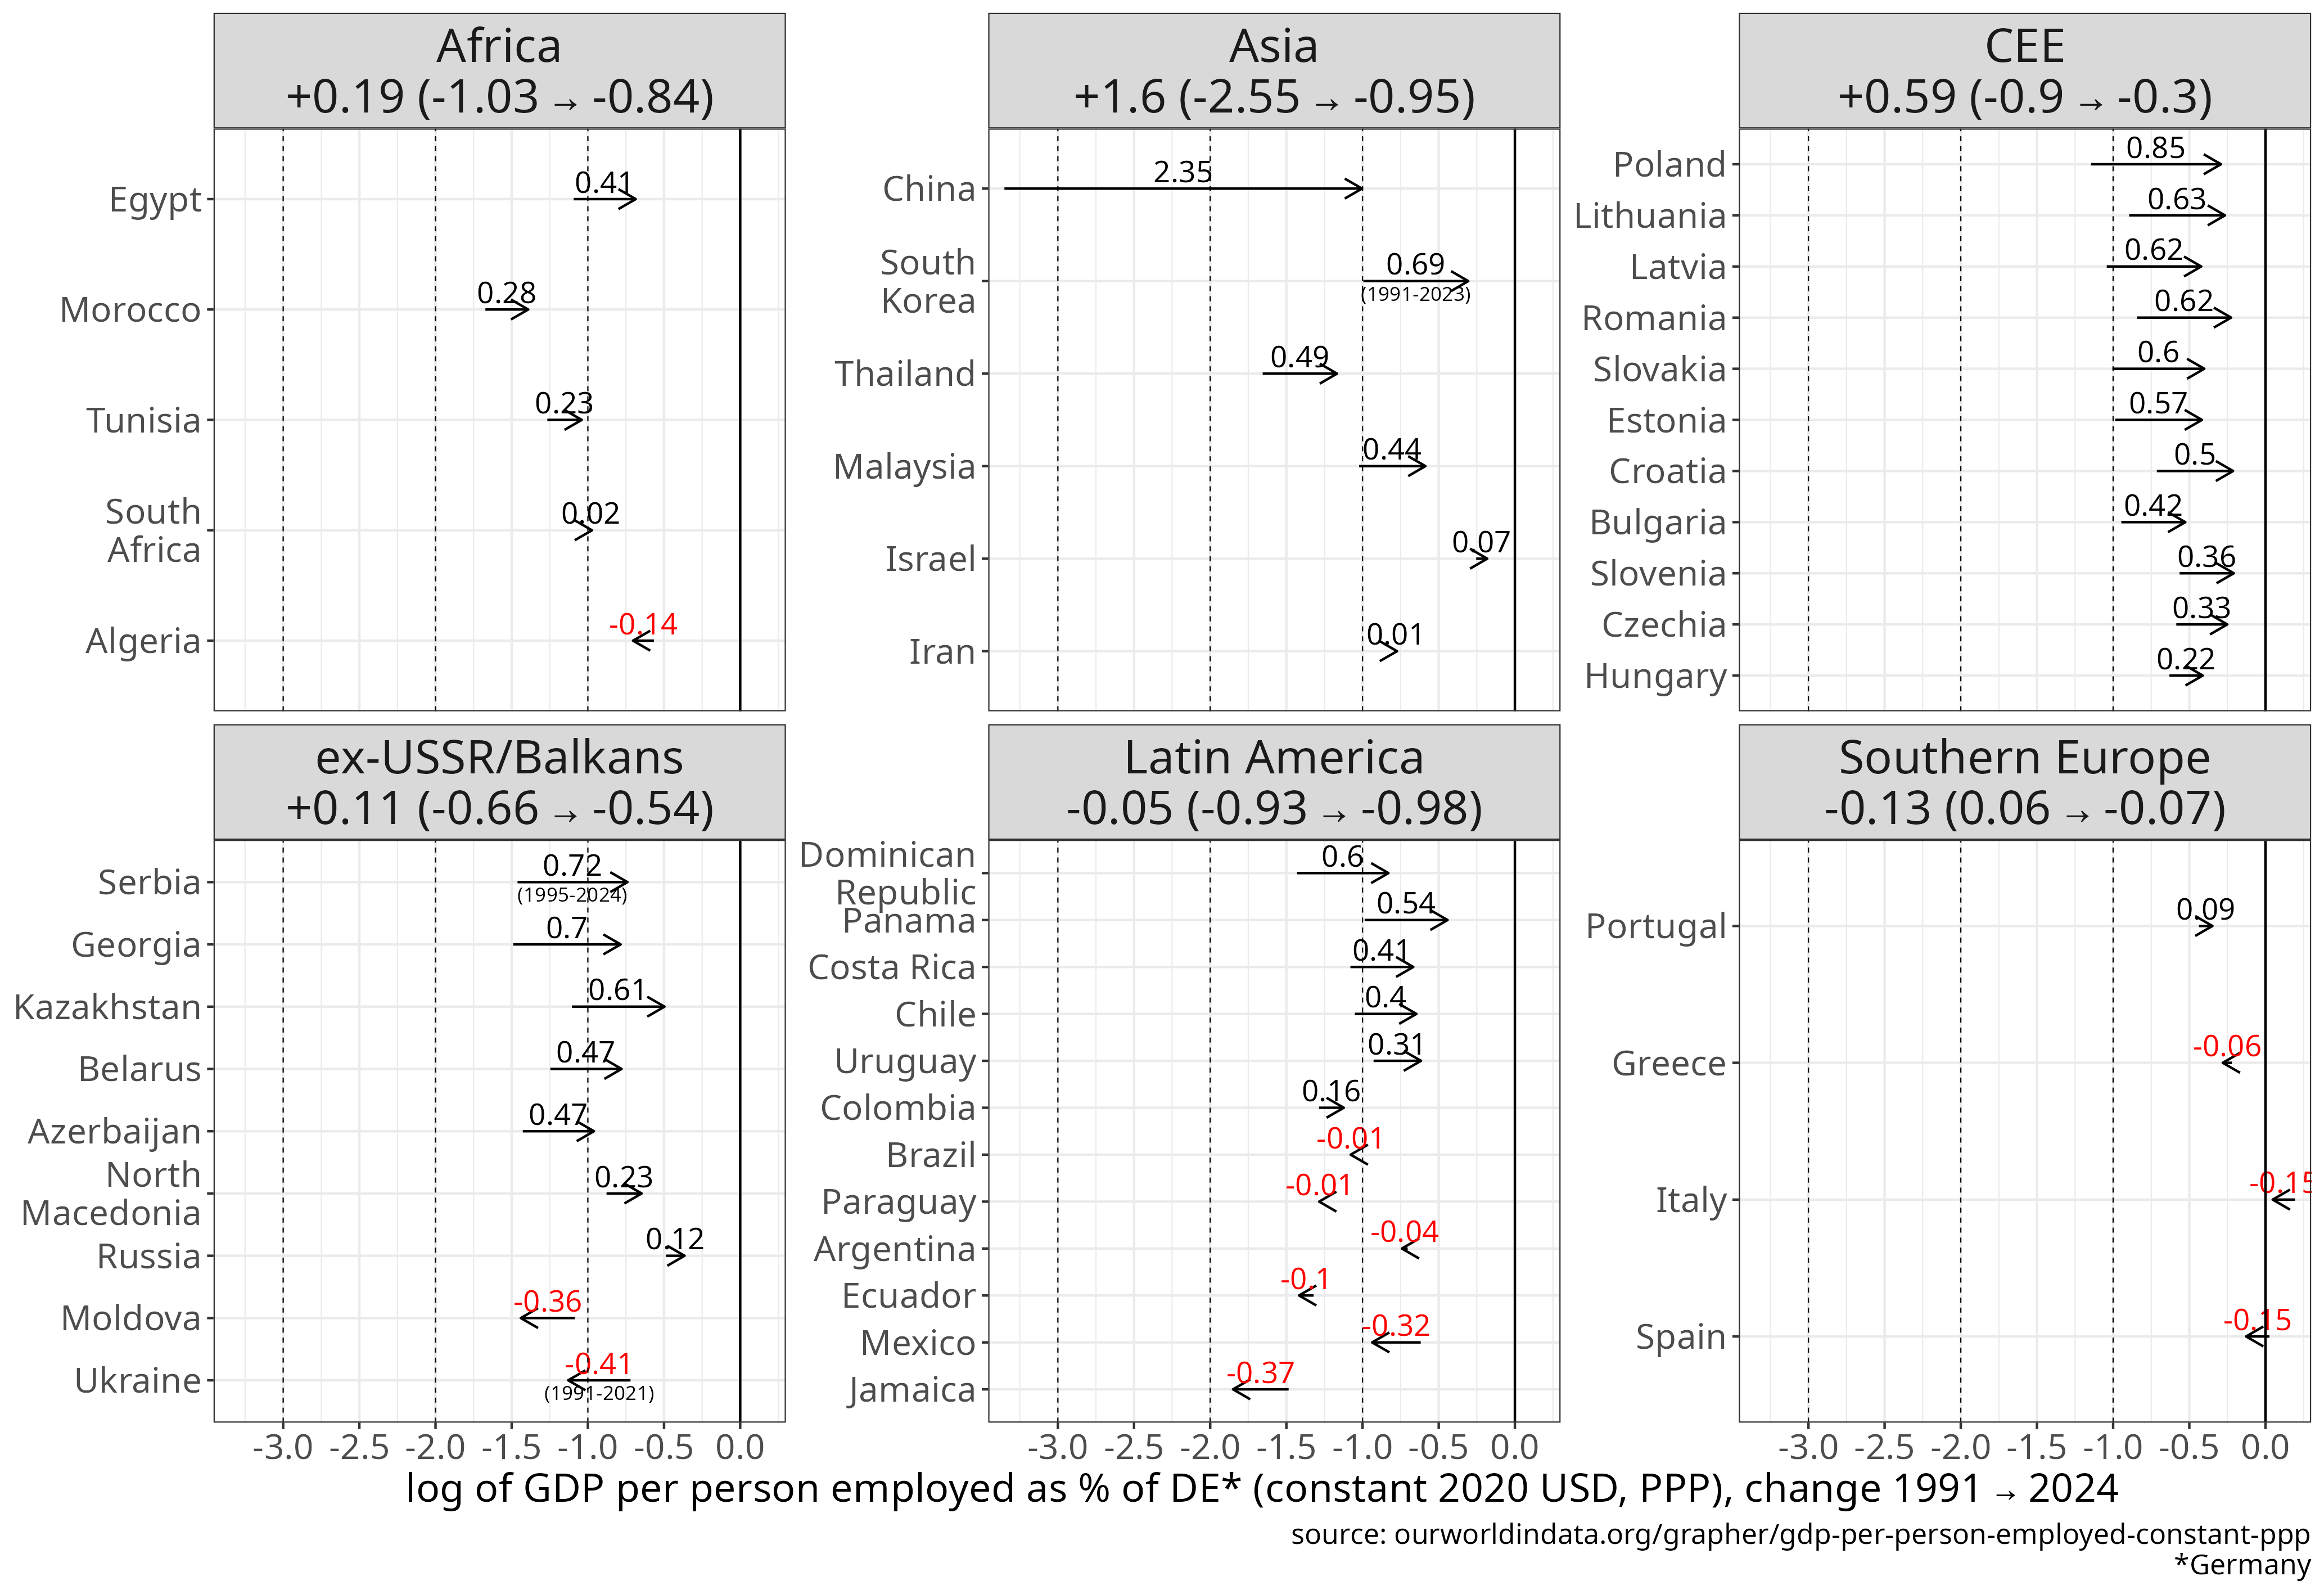
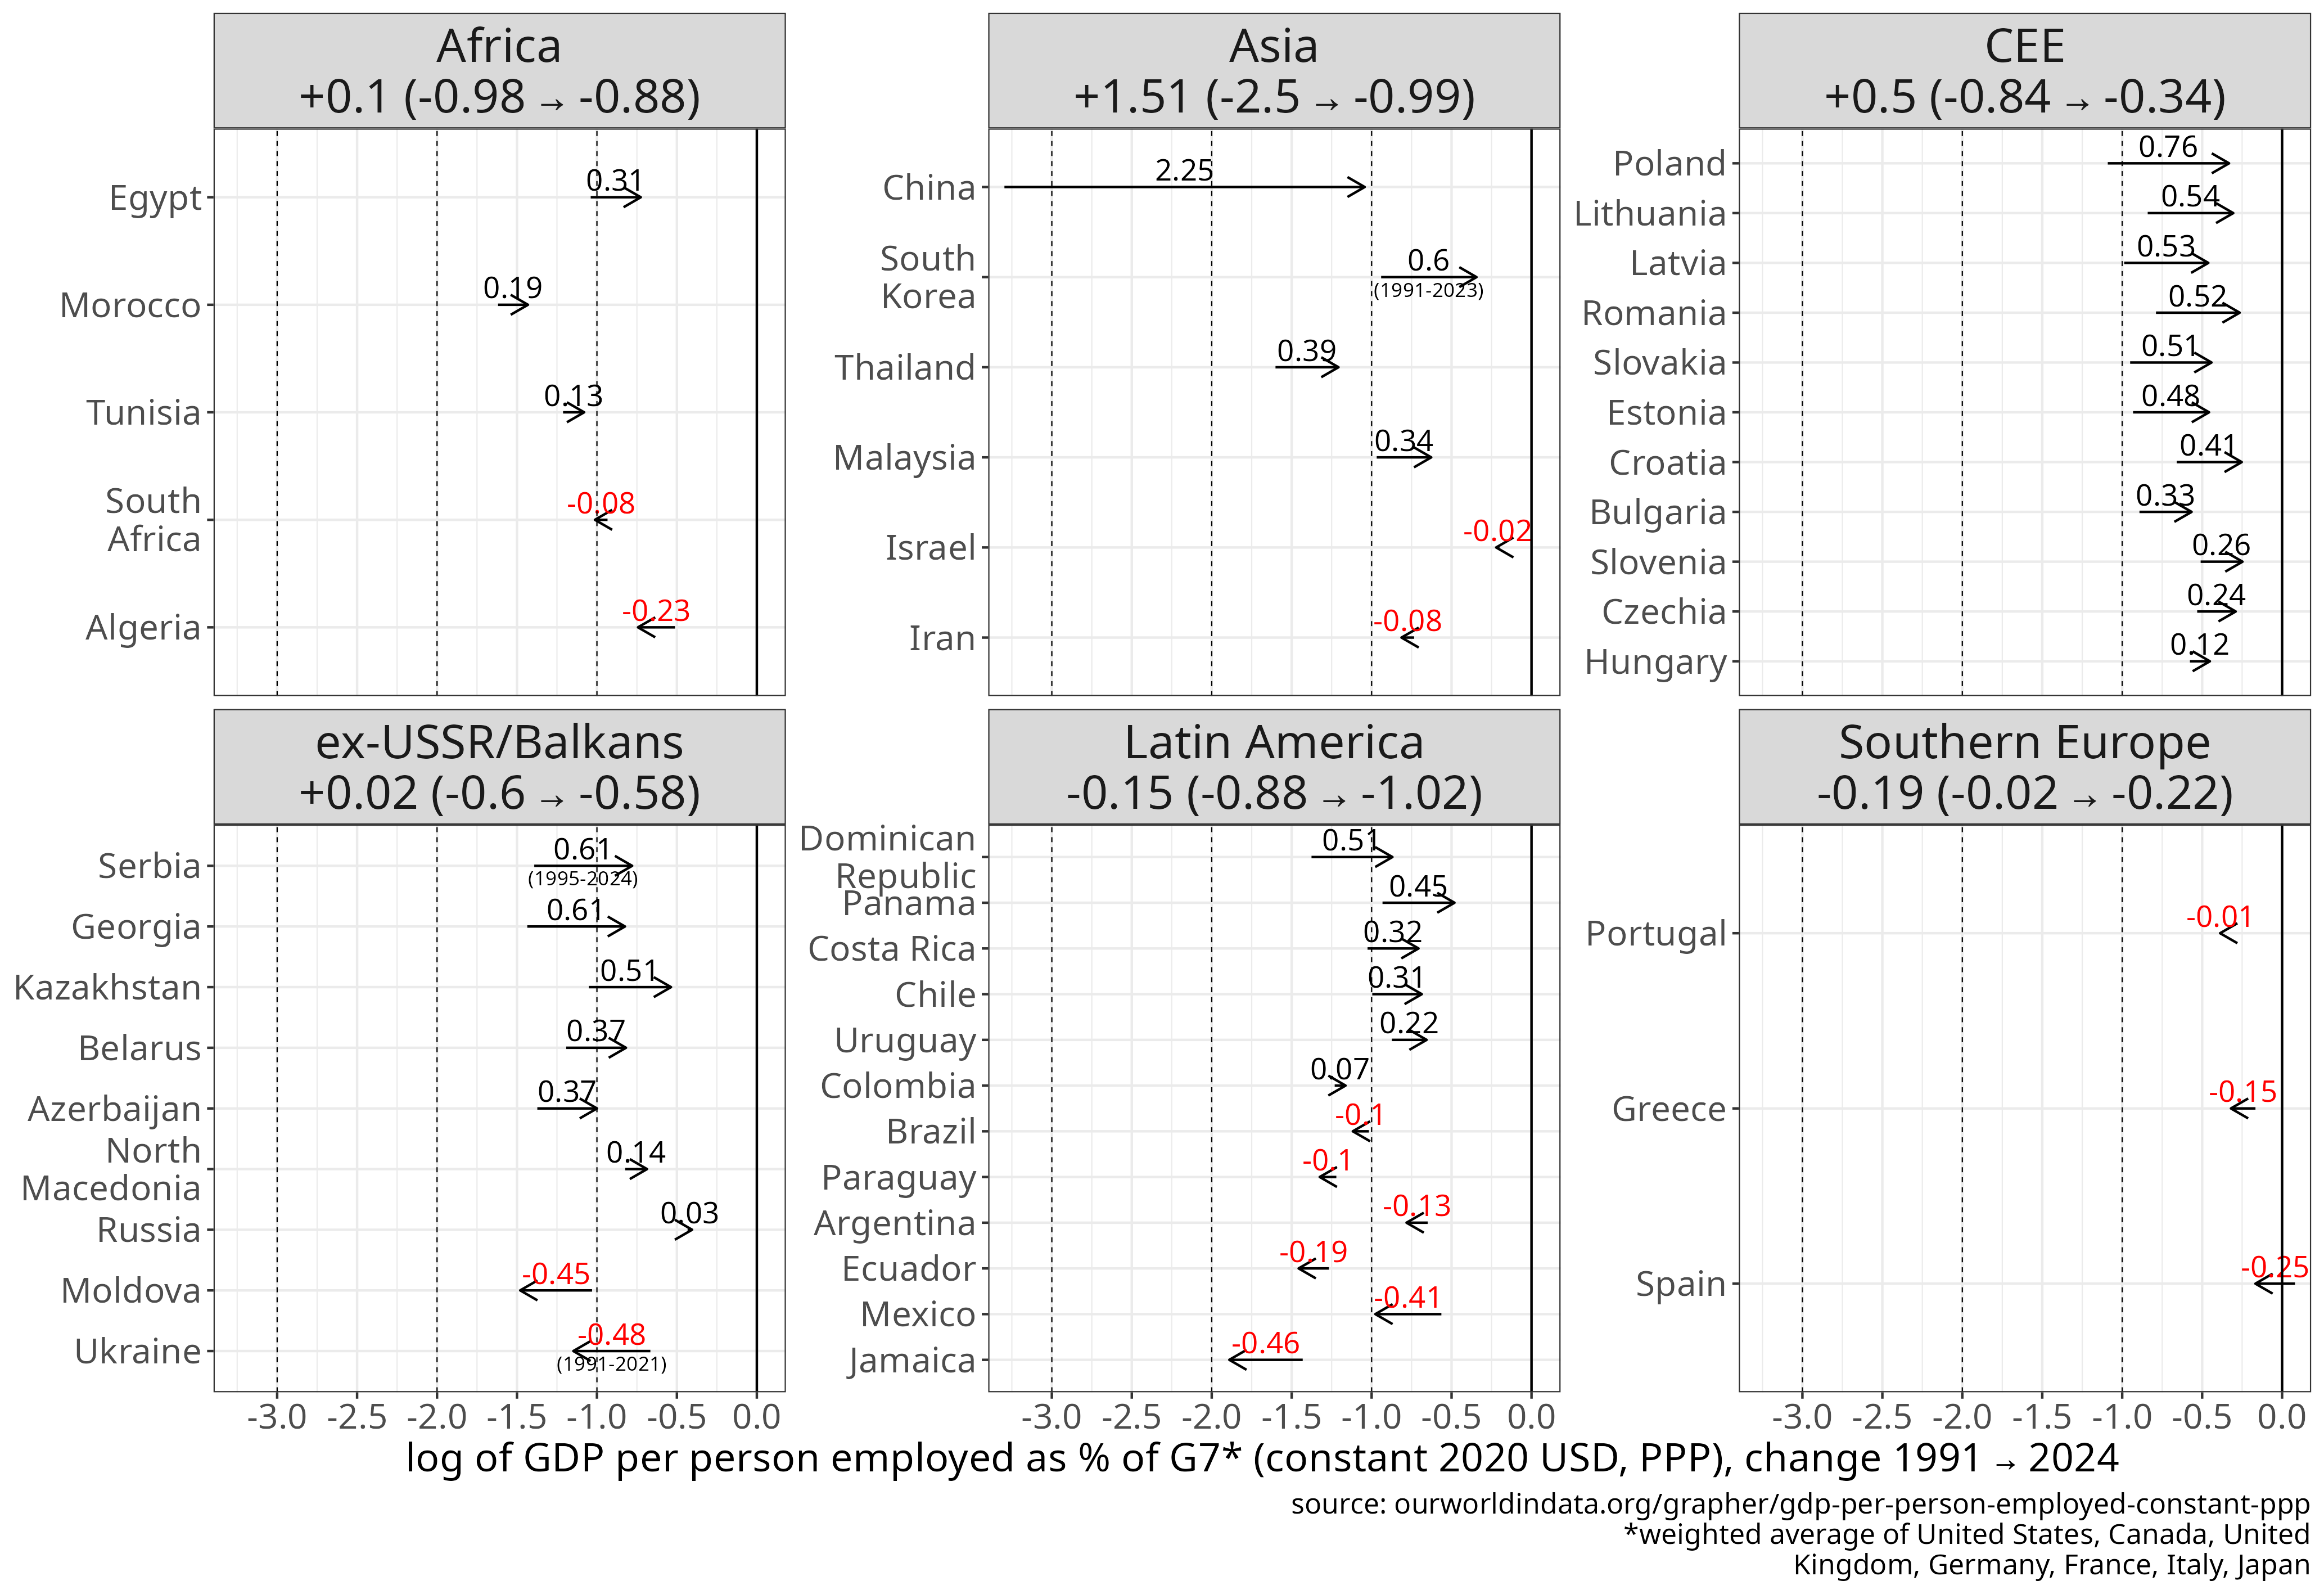
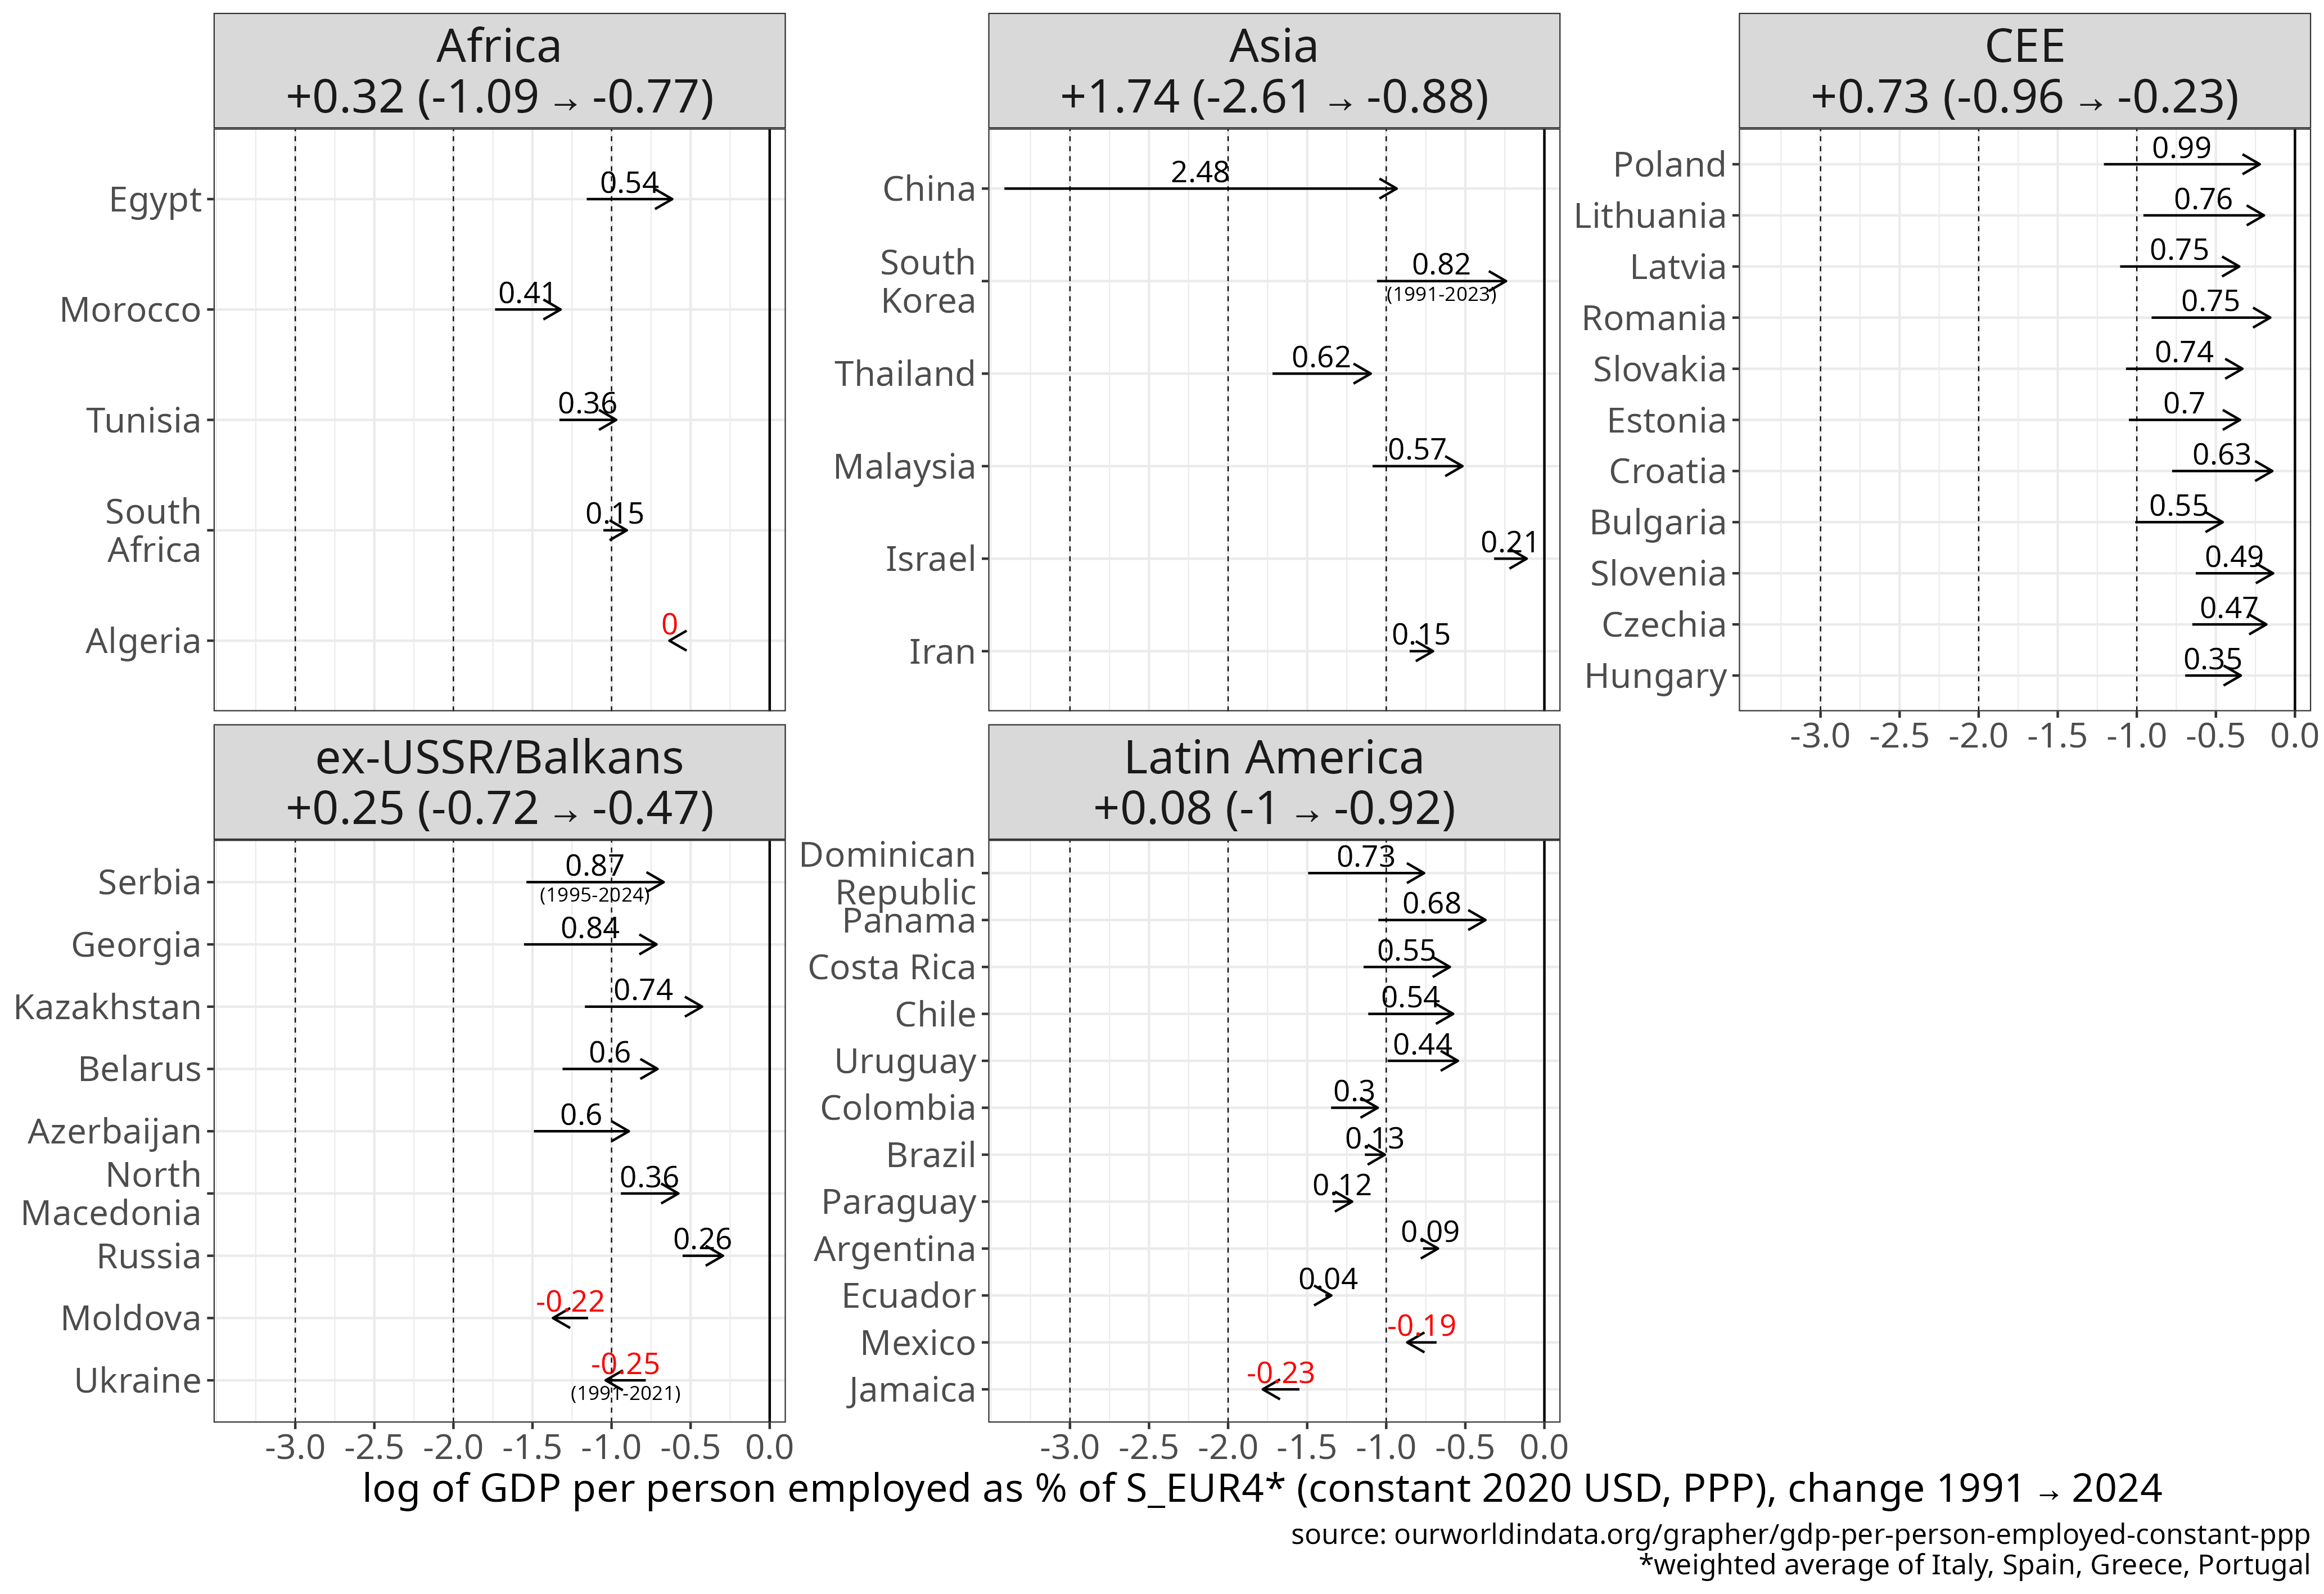
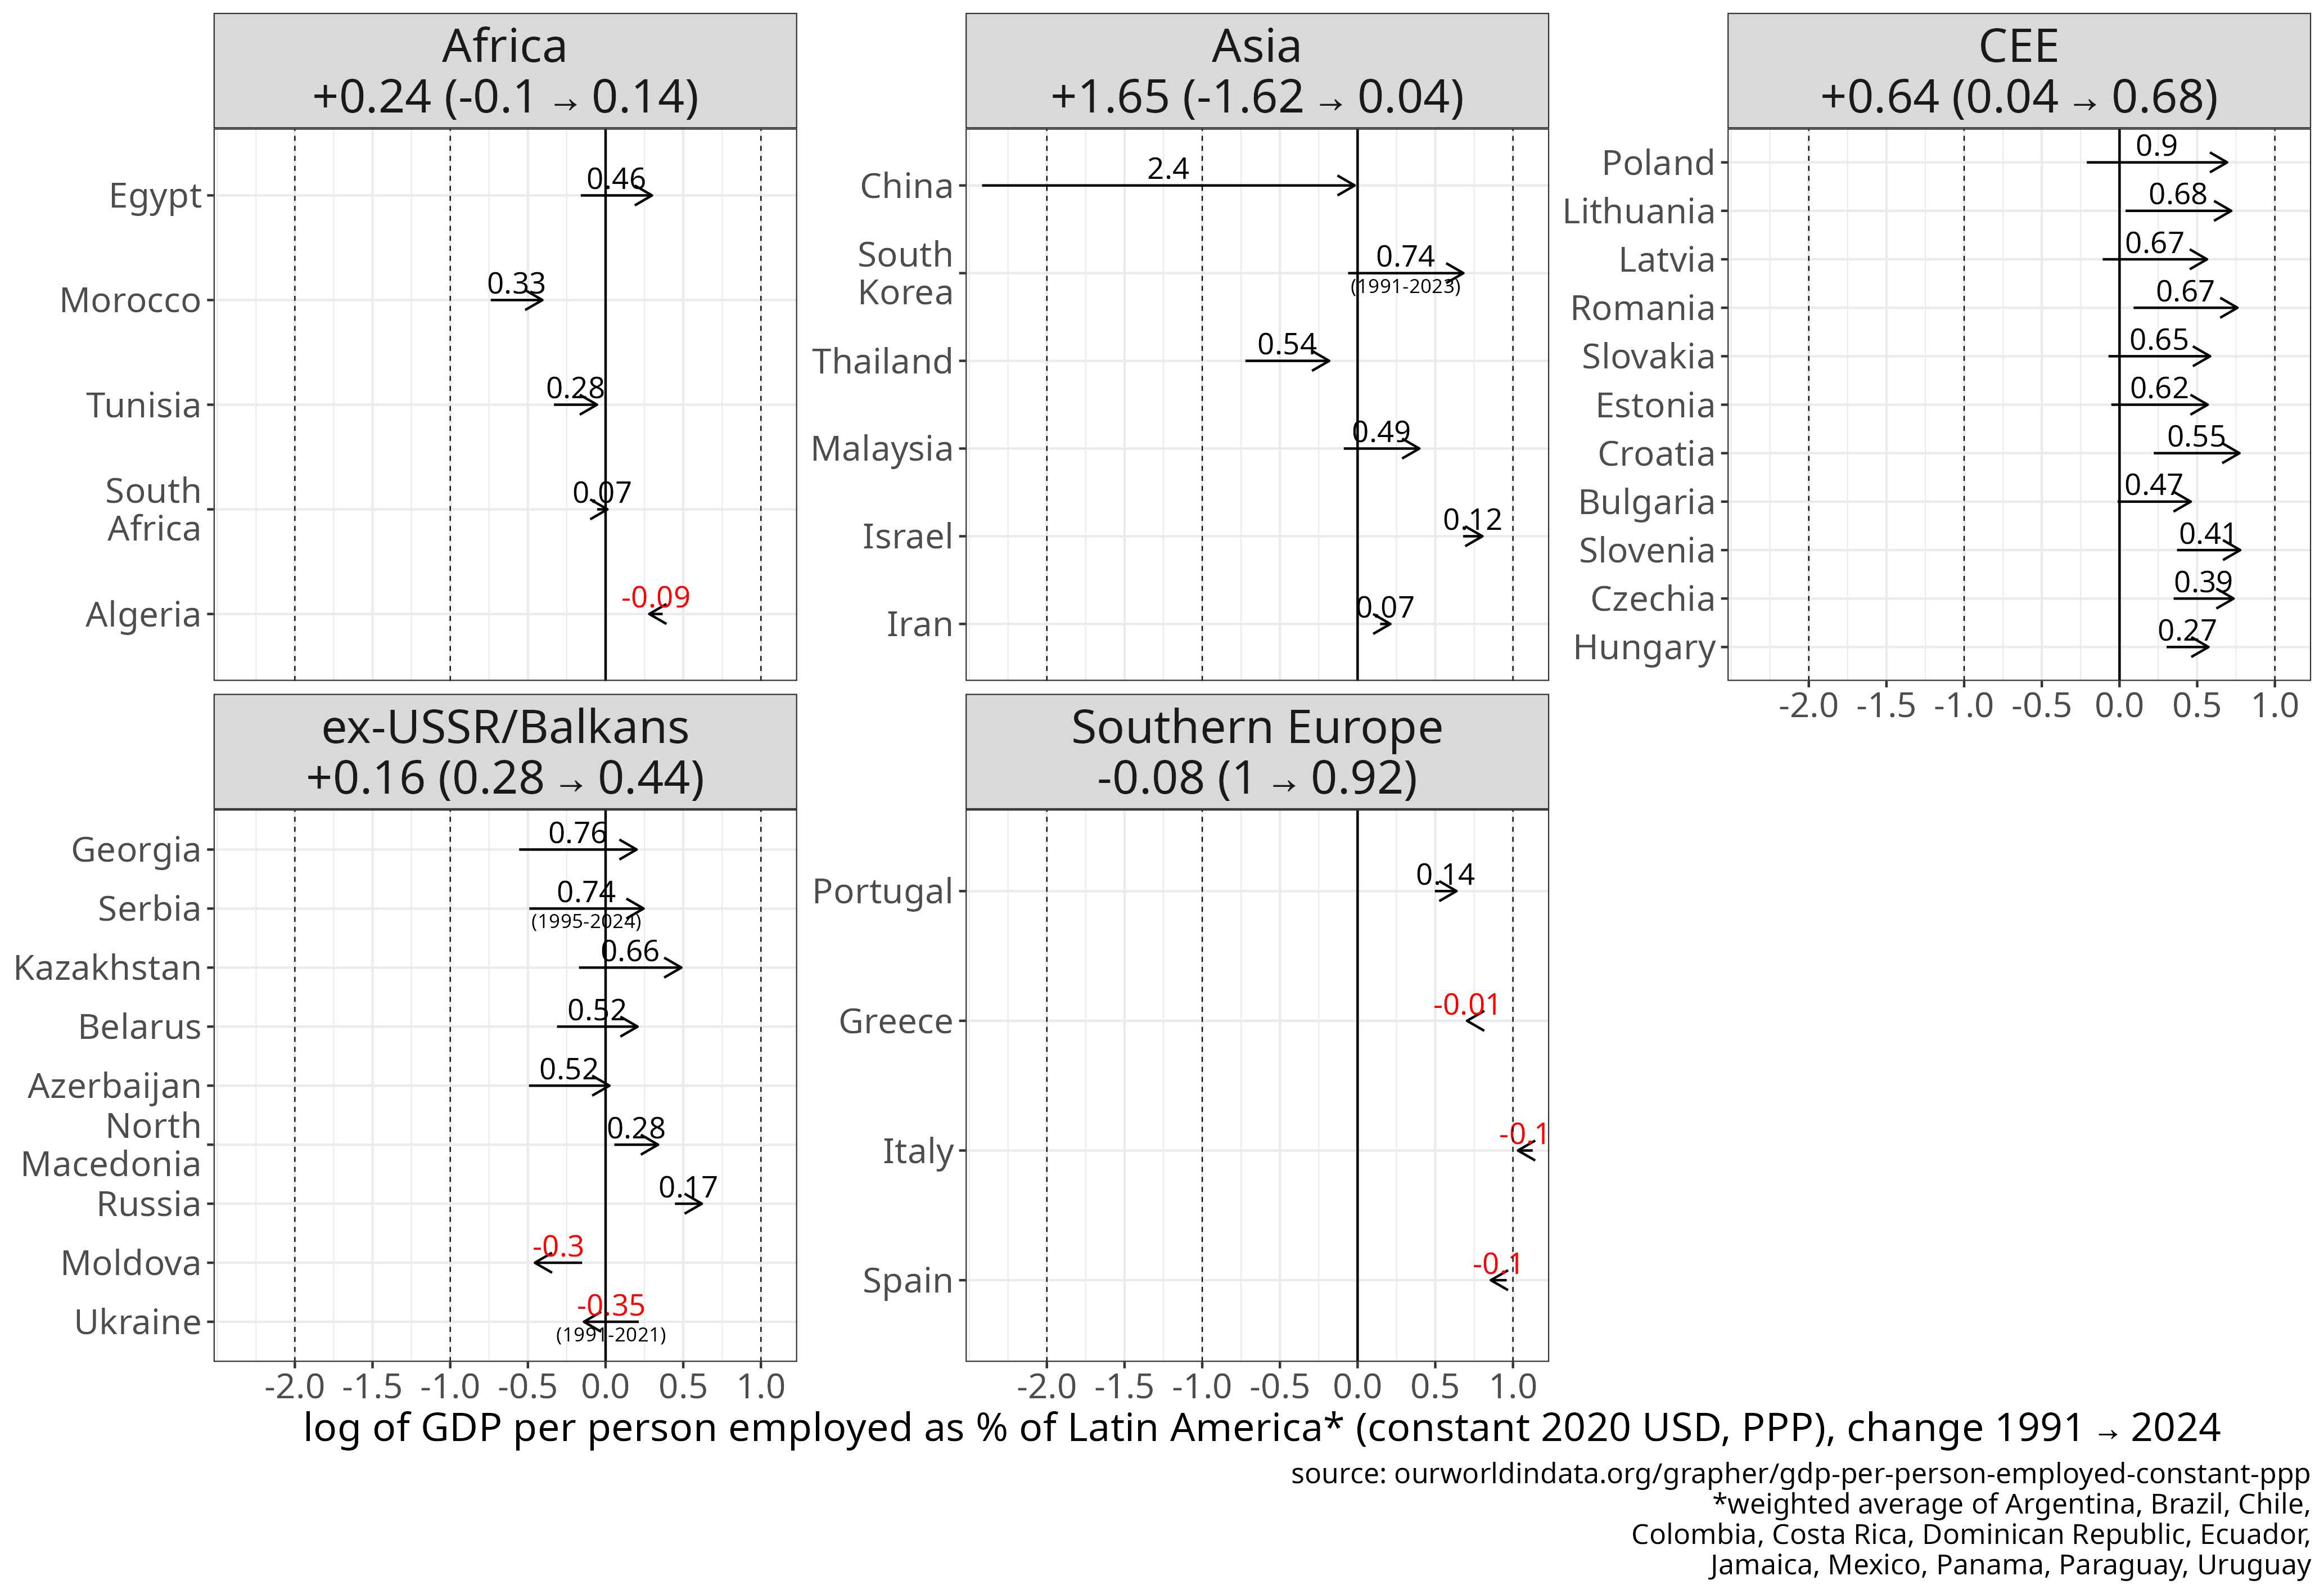
Figure 8 GDP per person employed, by world region, from 1991 to 2024.
Units: constant USD PPP 2021, or as a % of the Western core, Southern Europe or Latin America. Linear scale shows the absolute difference between the end and start values (in thousand USD or in % of the benchmark value). Log scale shows the difference on a logarithmic scale.
[download plot data]
[source]
The trends of labour productivity are quite similar to those of GDP per capita.
In absolute terms, CEE saw the biggest increase in productivity per employed person, from 38k to 92k (constant) USD on average, a 2.4x increase.
This is closely followed by Asian economies, where the increase is somewhat smaller in absolute (+40k constant USD PPP), but larger in relative terms (6x).
Relative to the rich core’s productivity level, this meant a +33% increase expressed as a % of Germany for CEE (+28% as % of G7), and almost identical figures for Asia (+30%, +28%).
As a consequence, the CEE average moved from ~40% to ~75% of the German level, while Asia’s moved from ~10% to ~40%. For CEE the output per employee level is actually somewhat closer (by a factor of ~1.1x) to Germany’s than its GDP per capita level. This is due to higher annual average work hours (1.3-1.5x of the German level), not fully cancelled out by slightly lower labour force participation and employment rates (each around 0.95x of DE level).
Productivity per employed person in Africa is ~40% of Germany’s level, while GDP per capita is only ~20%. The relatively higher level per person employed is due mainly to higher annual working hours (2200 hrs in South Africa [not available for the other African peer countries], ~1.5x of DE level). This results in a relatively lower GDP per capita because a smaller proportion of the population is 15+ (~68% in Egypt, ~0.8x of DE level), and the employment rate within the 15+ population is lower too (40%, ~0.66x of DE level).
While GDP per capita could be marginally increased in CEE (and more substantially in Africa) by higher employment rates, this would be cancelled out if annual working hours were also to normalise to a Western European level. Therefore, the only way to achieve a Western European output (and eventually income) per person level would be to increase labour productivity per hour worked, which we have in Figure 9.
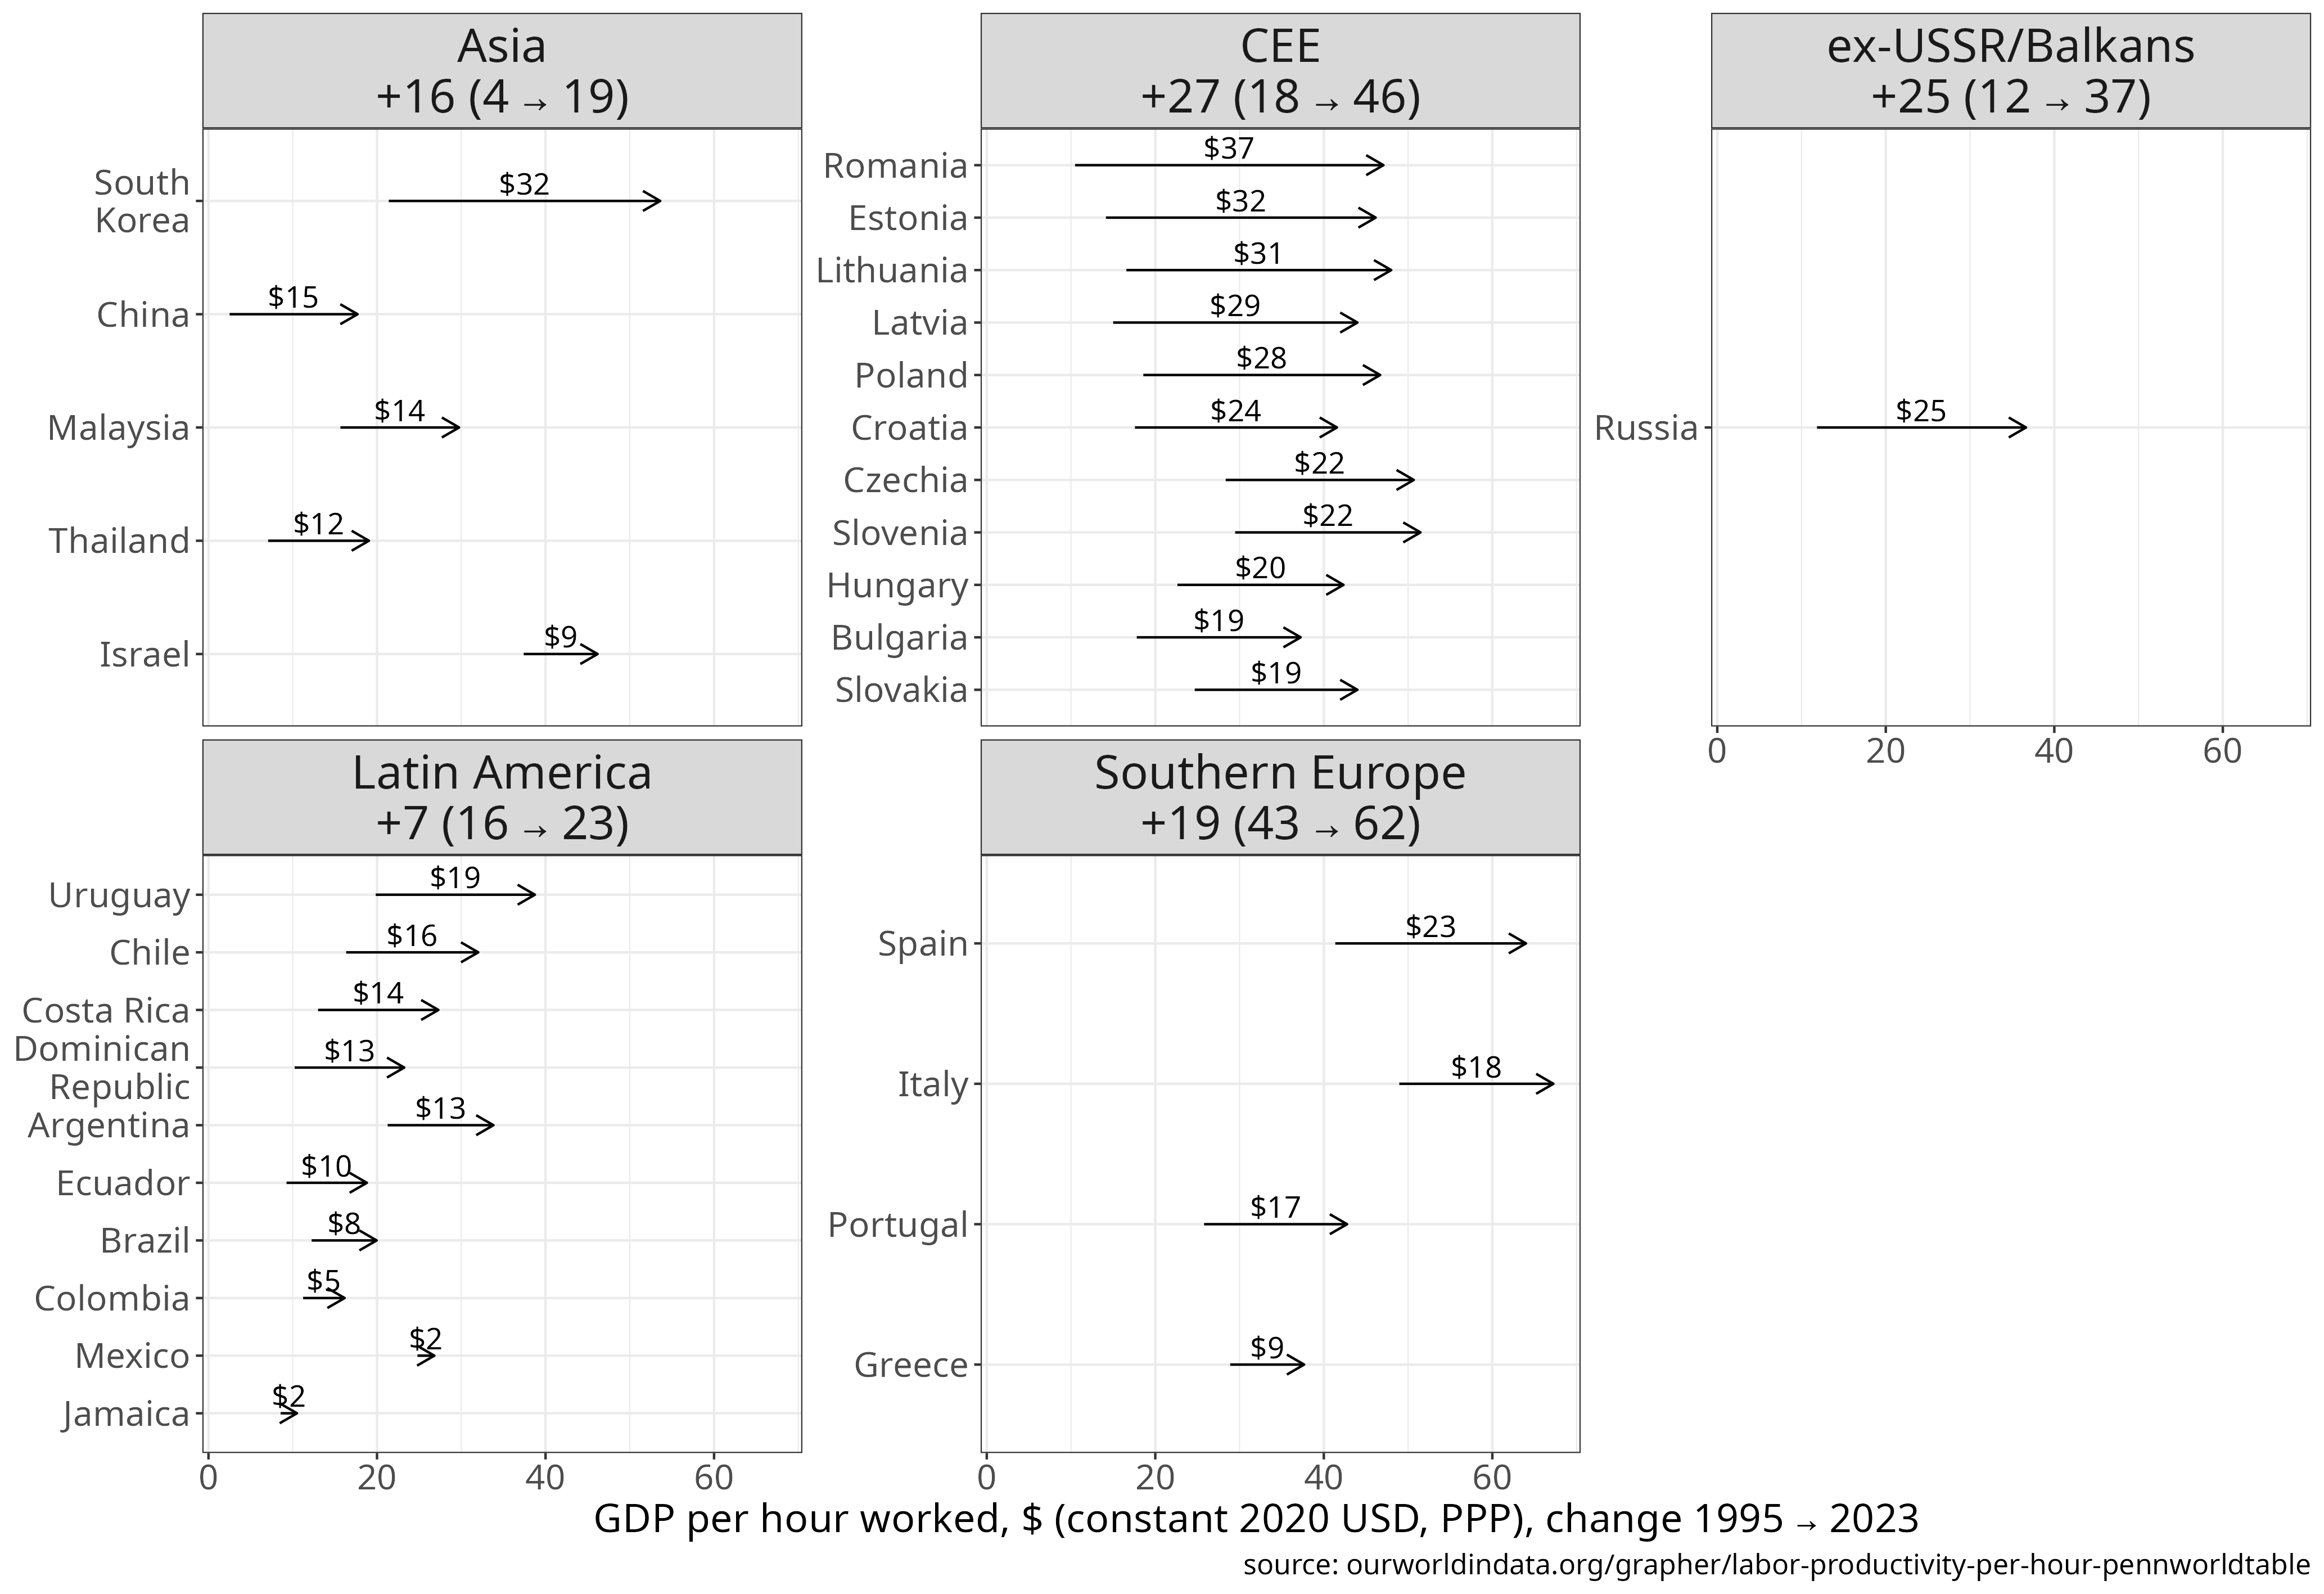
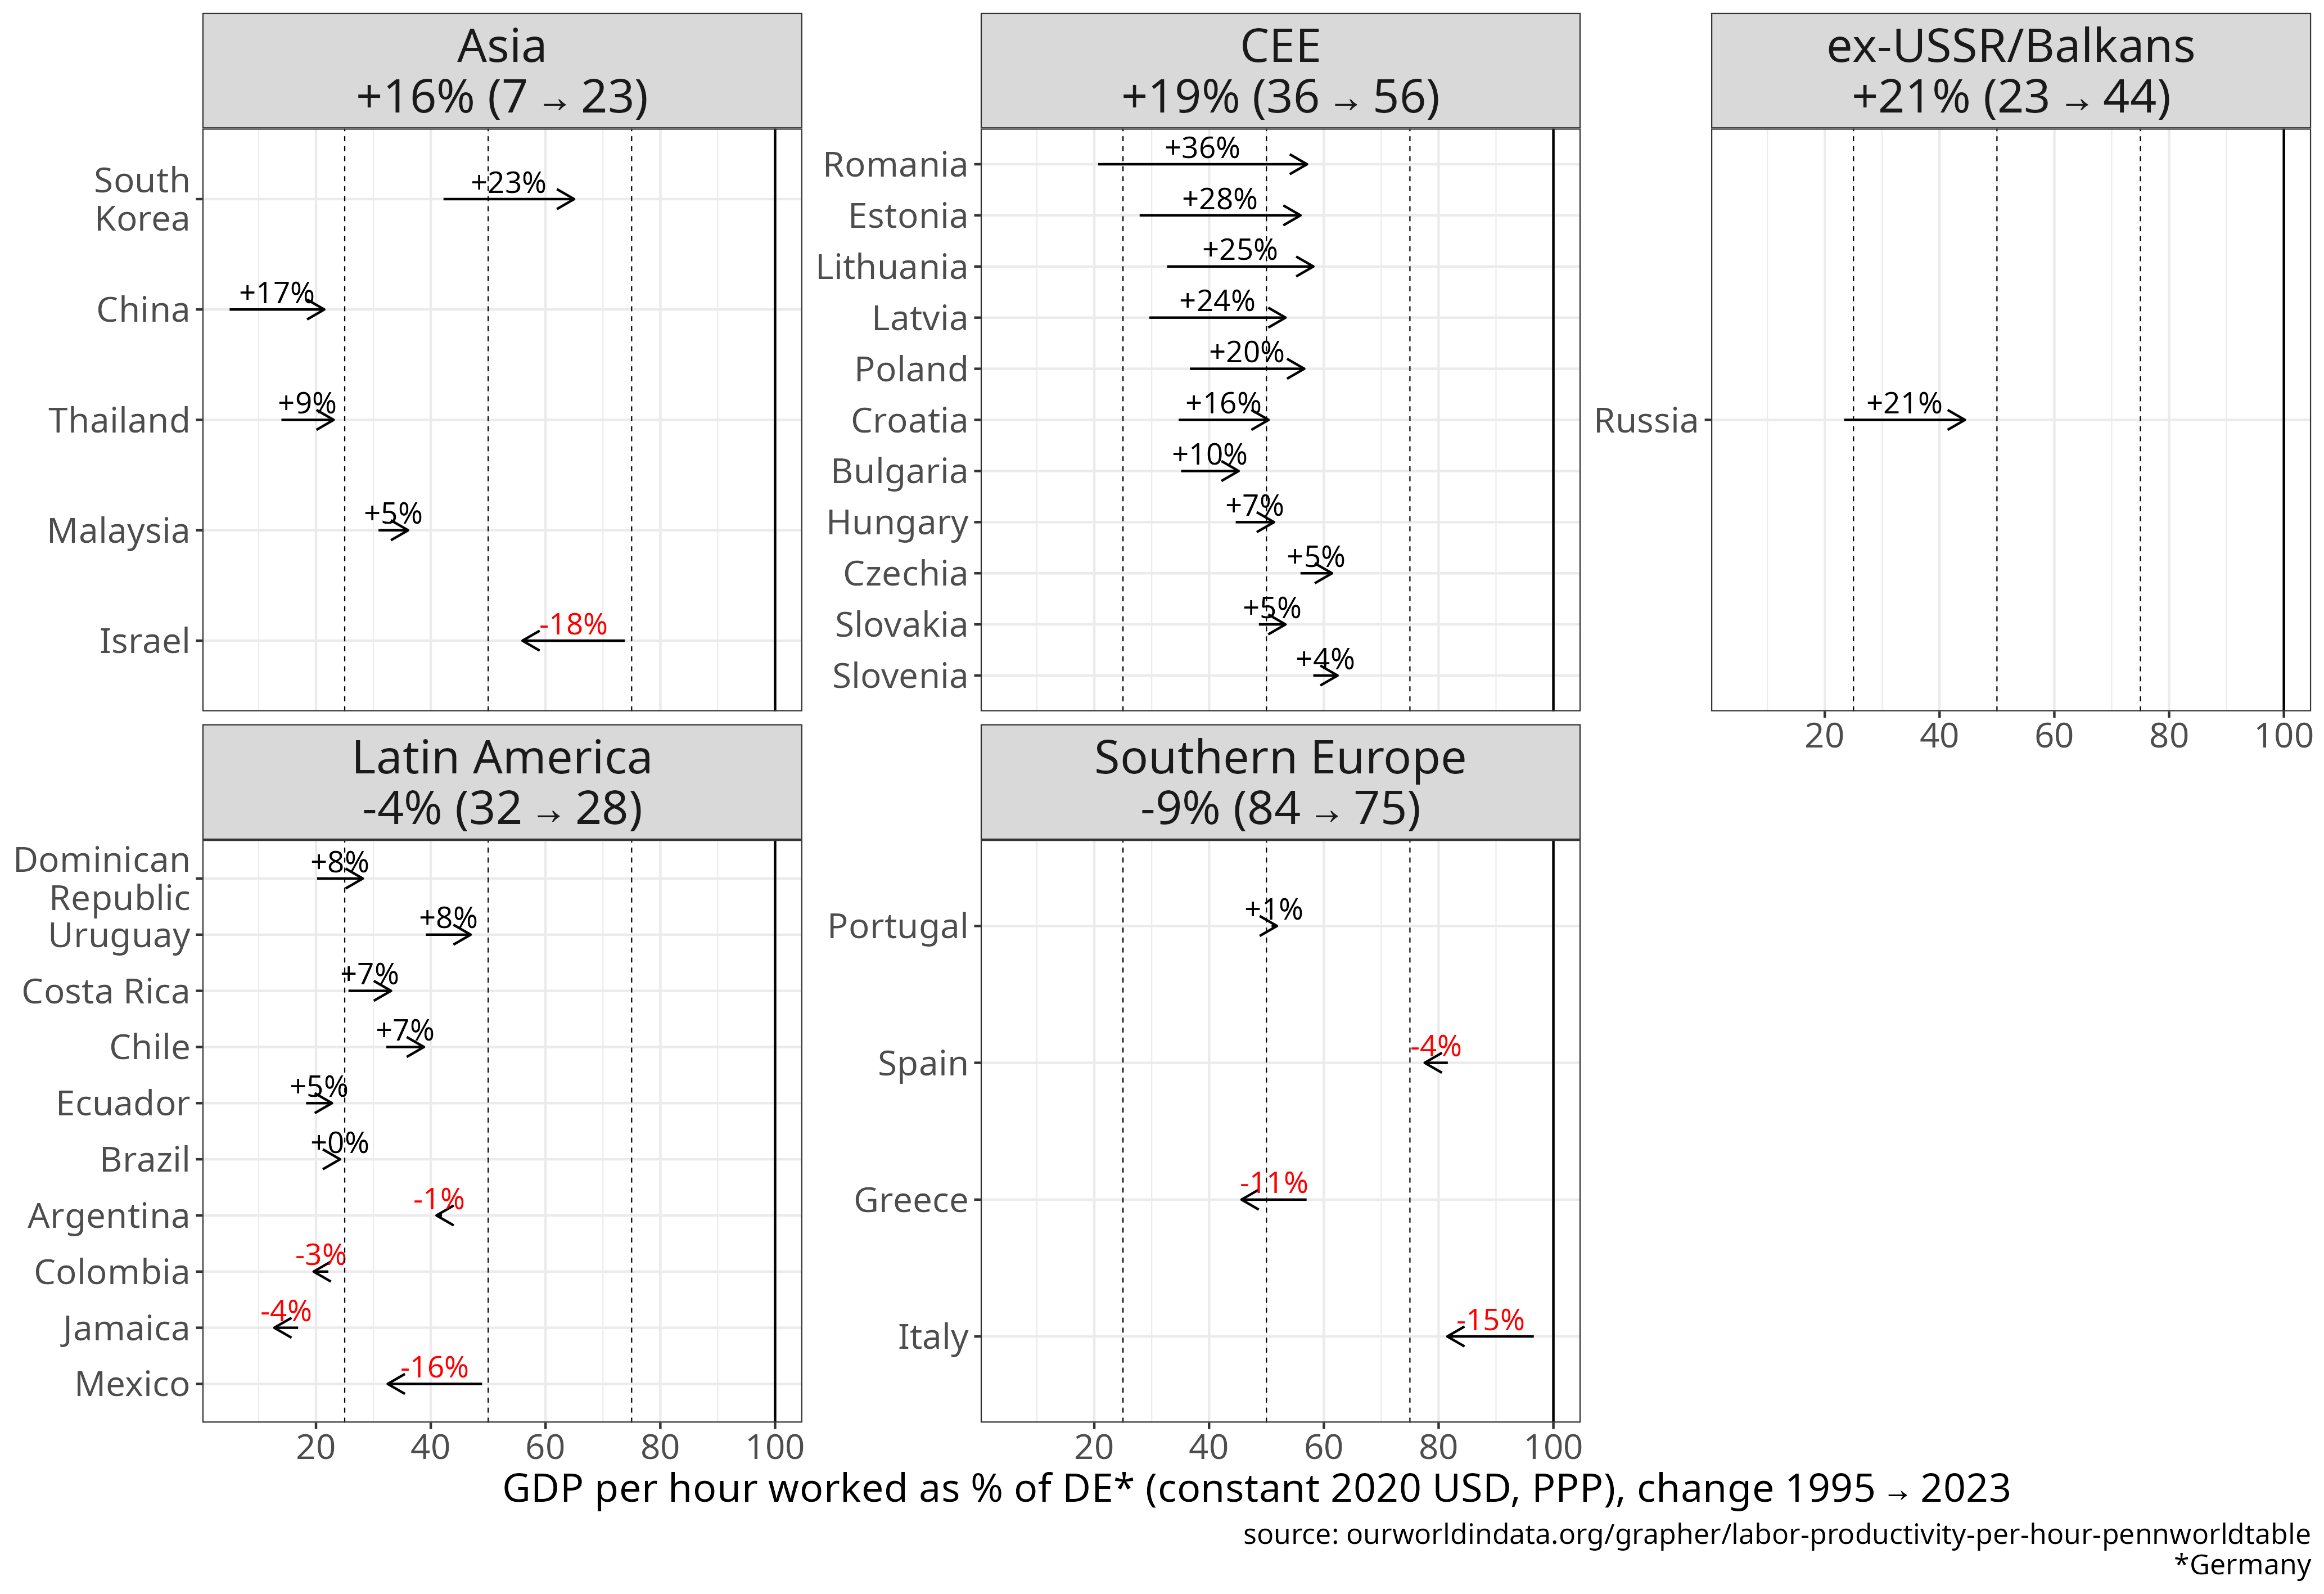
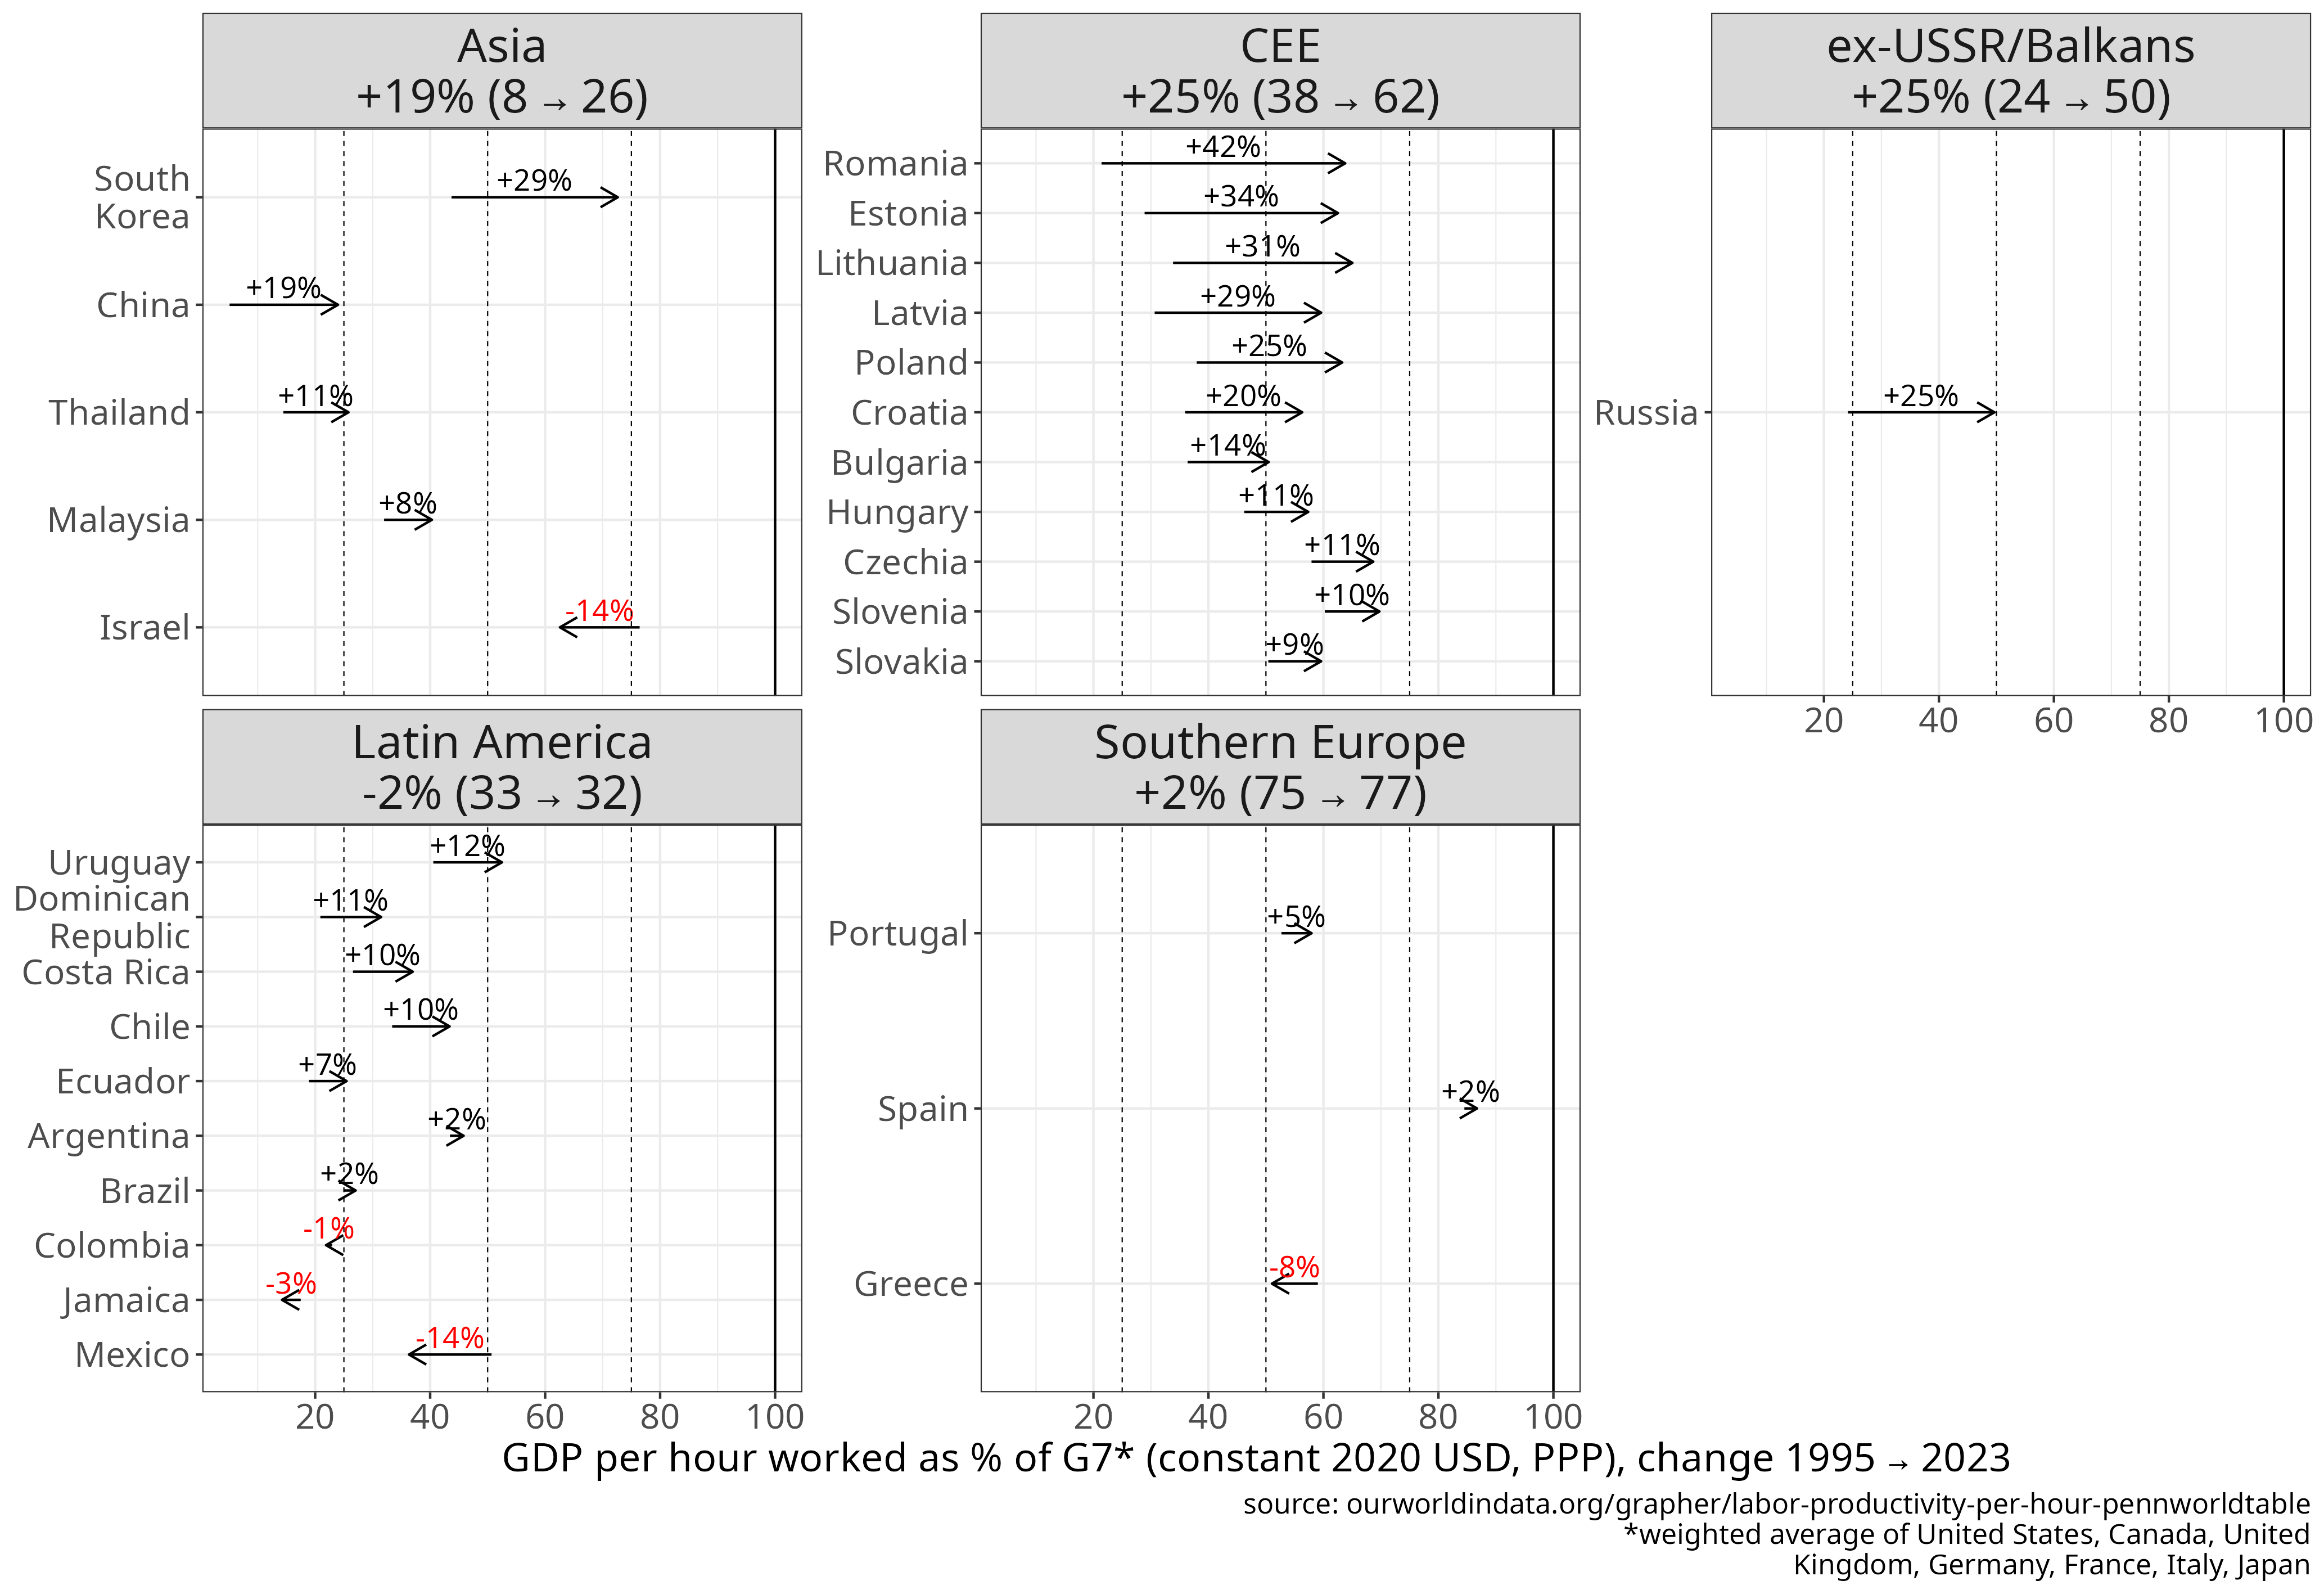
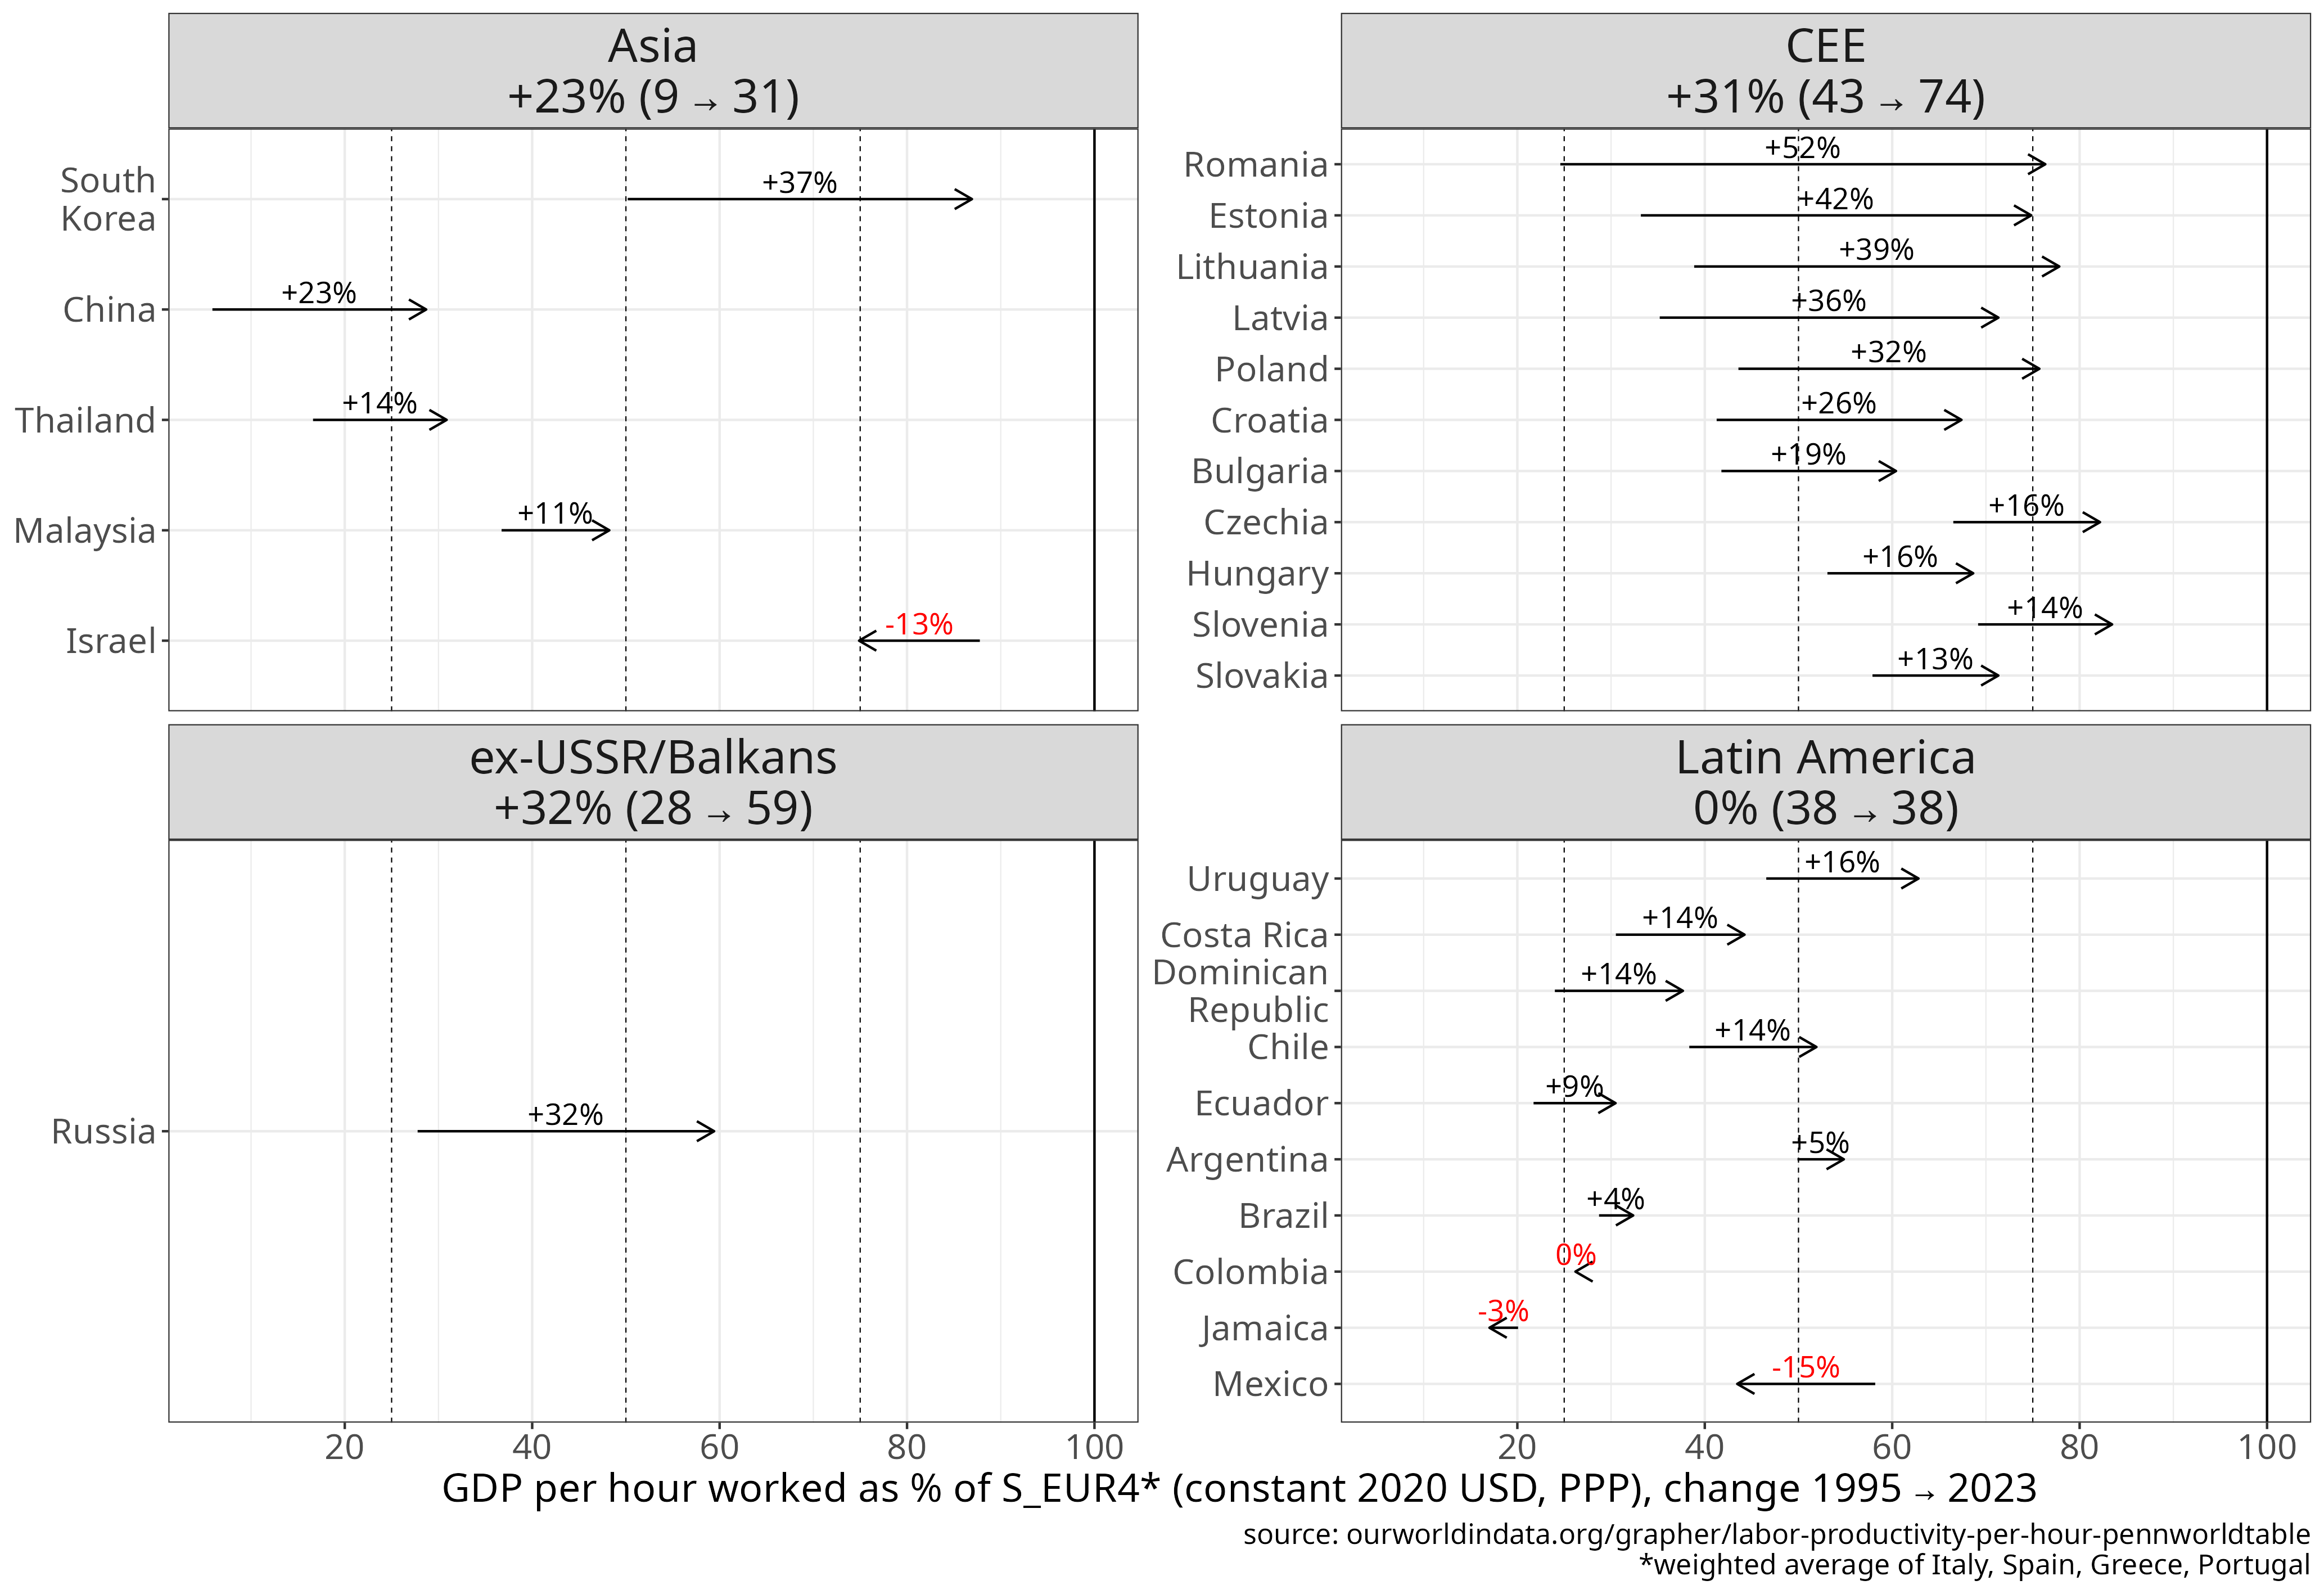
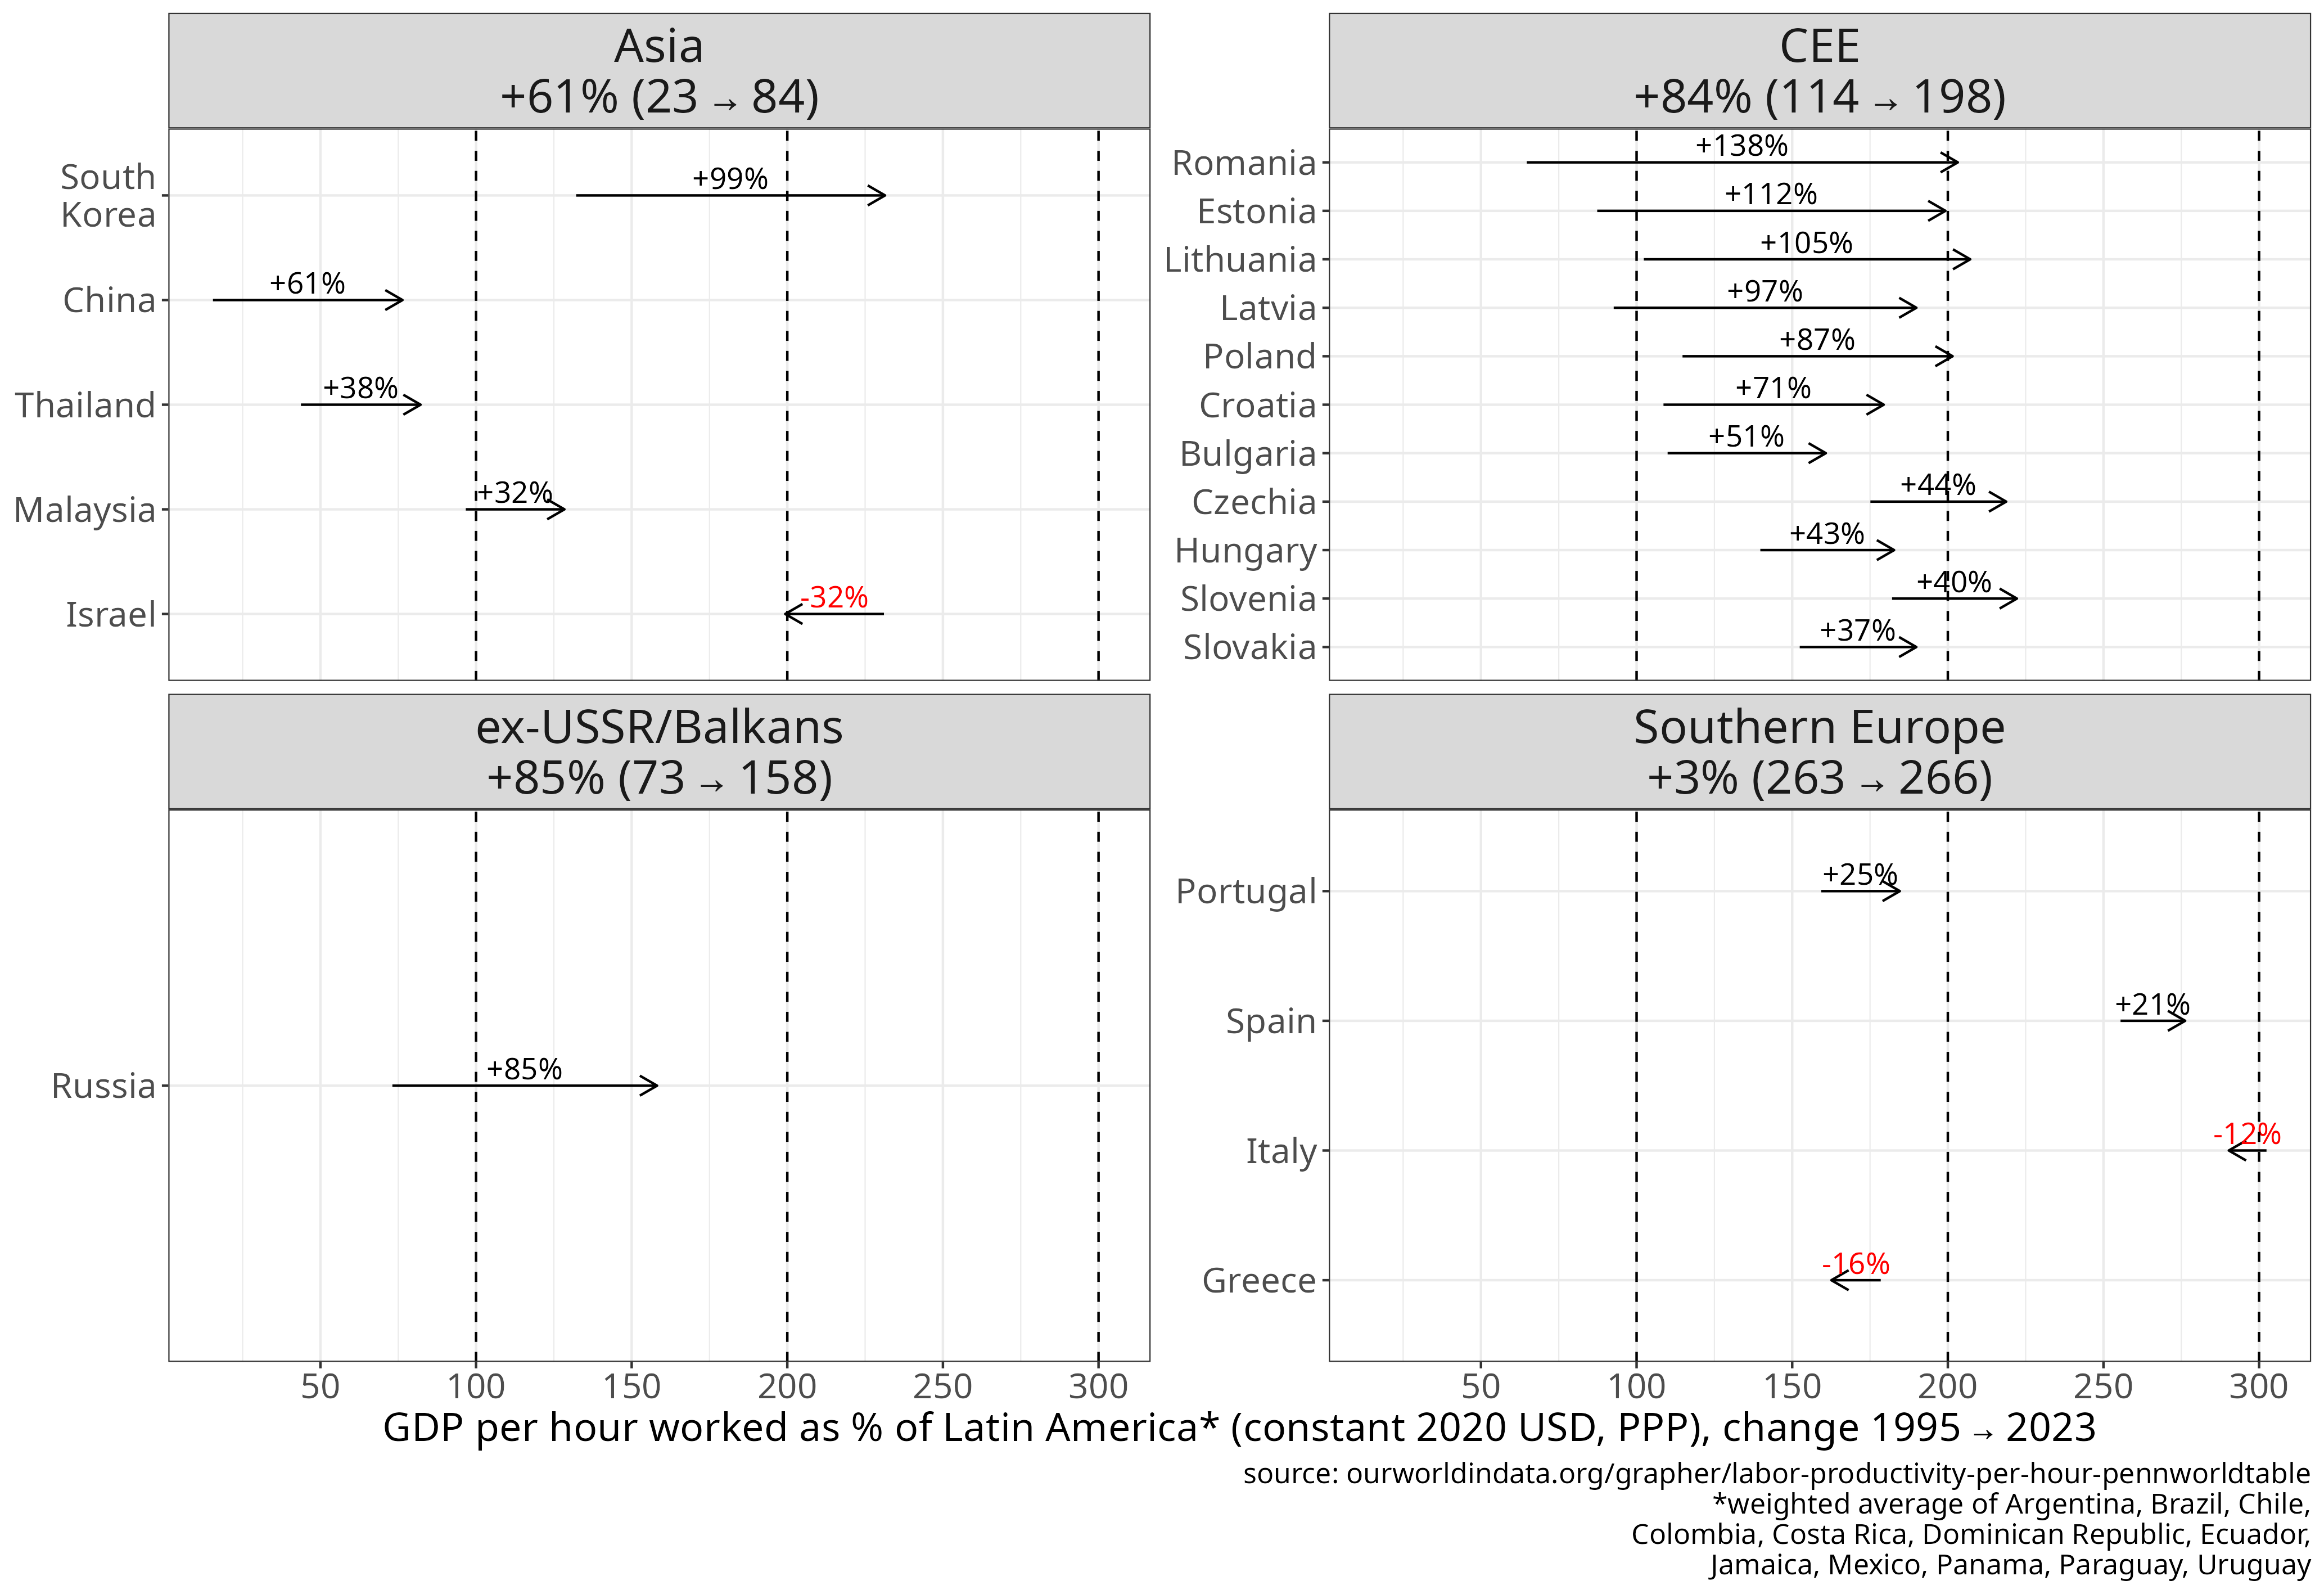
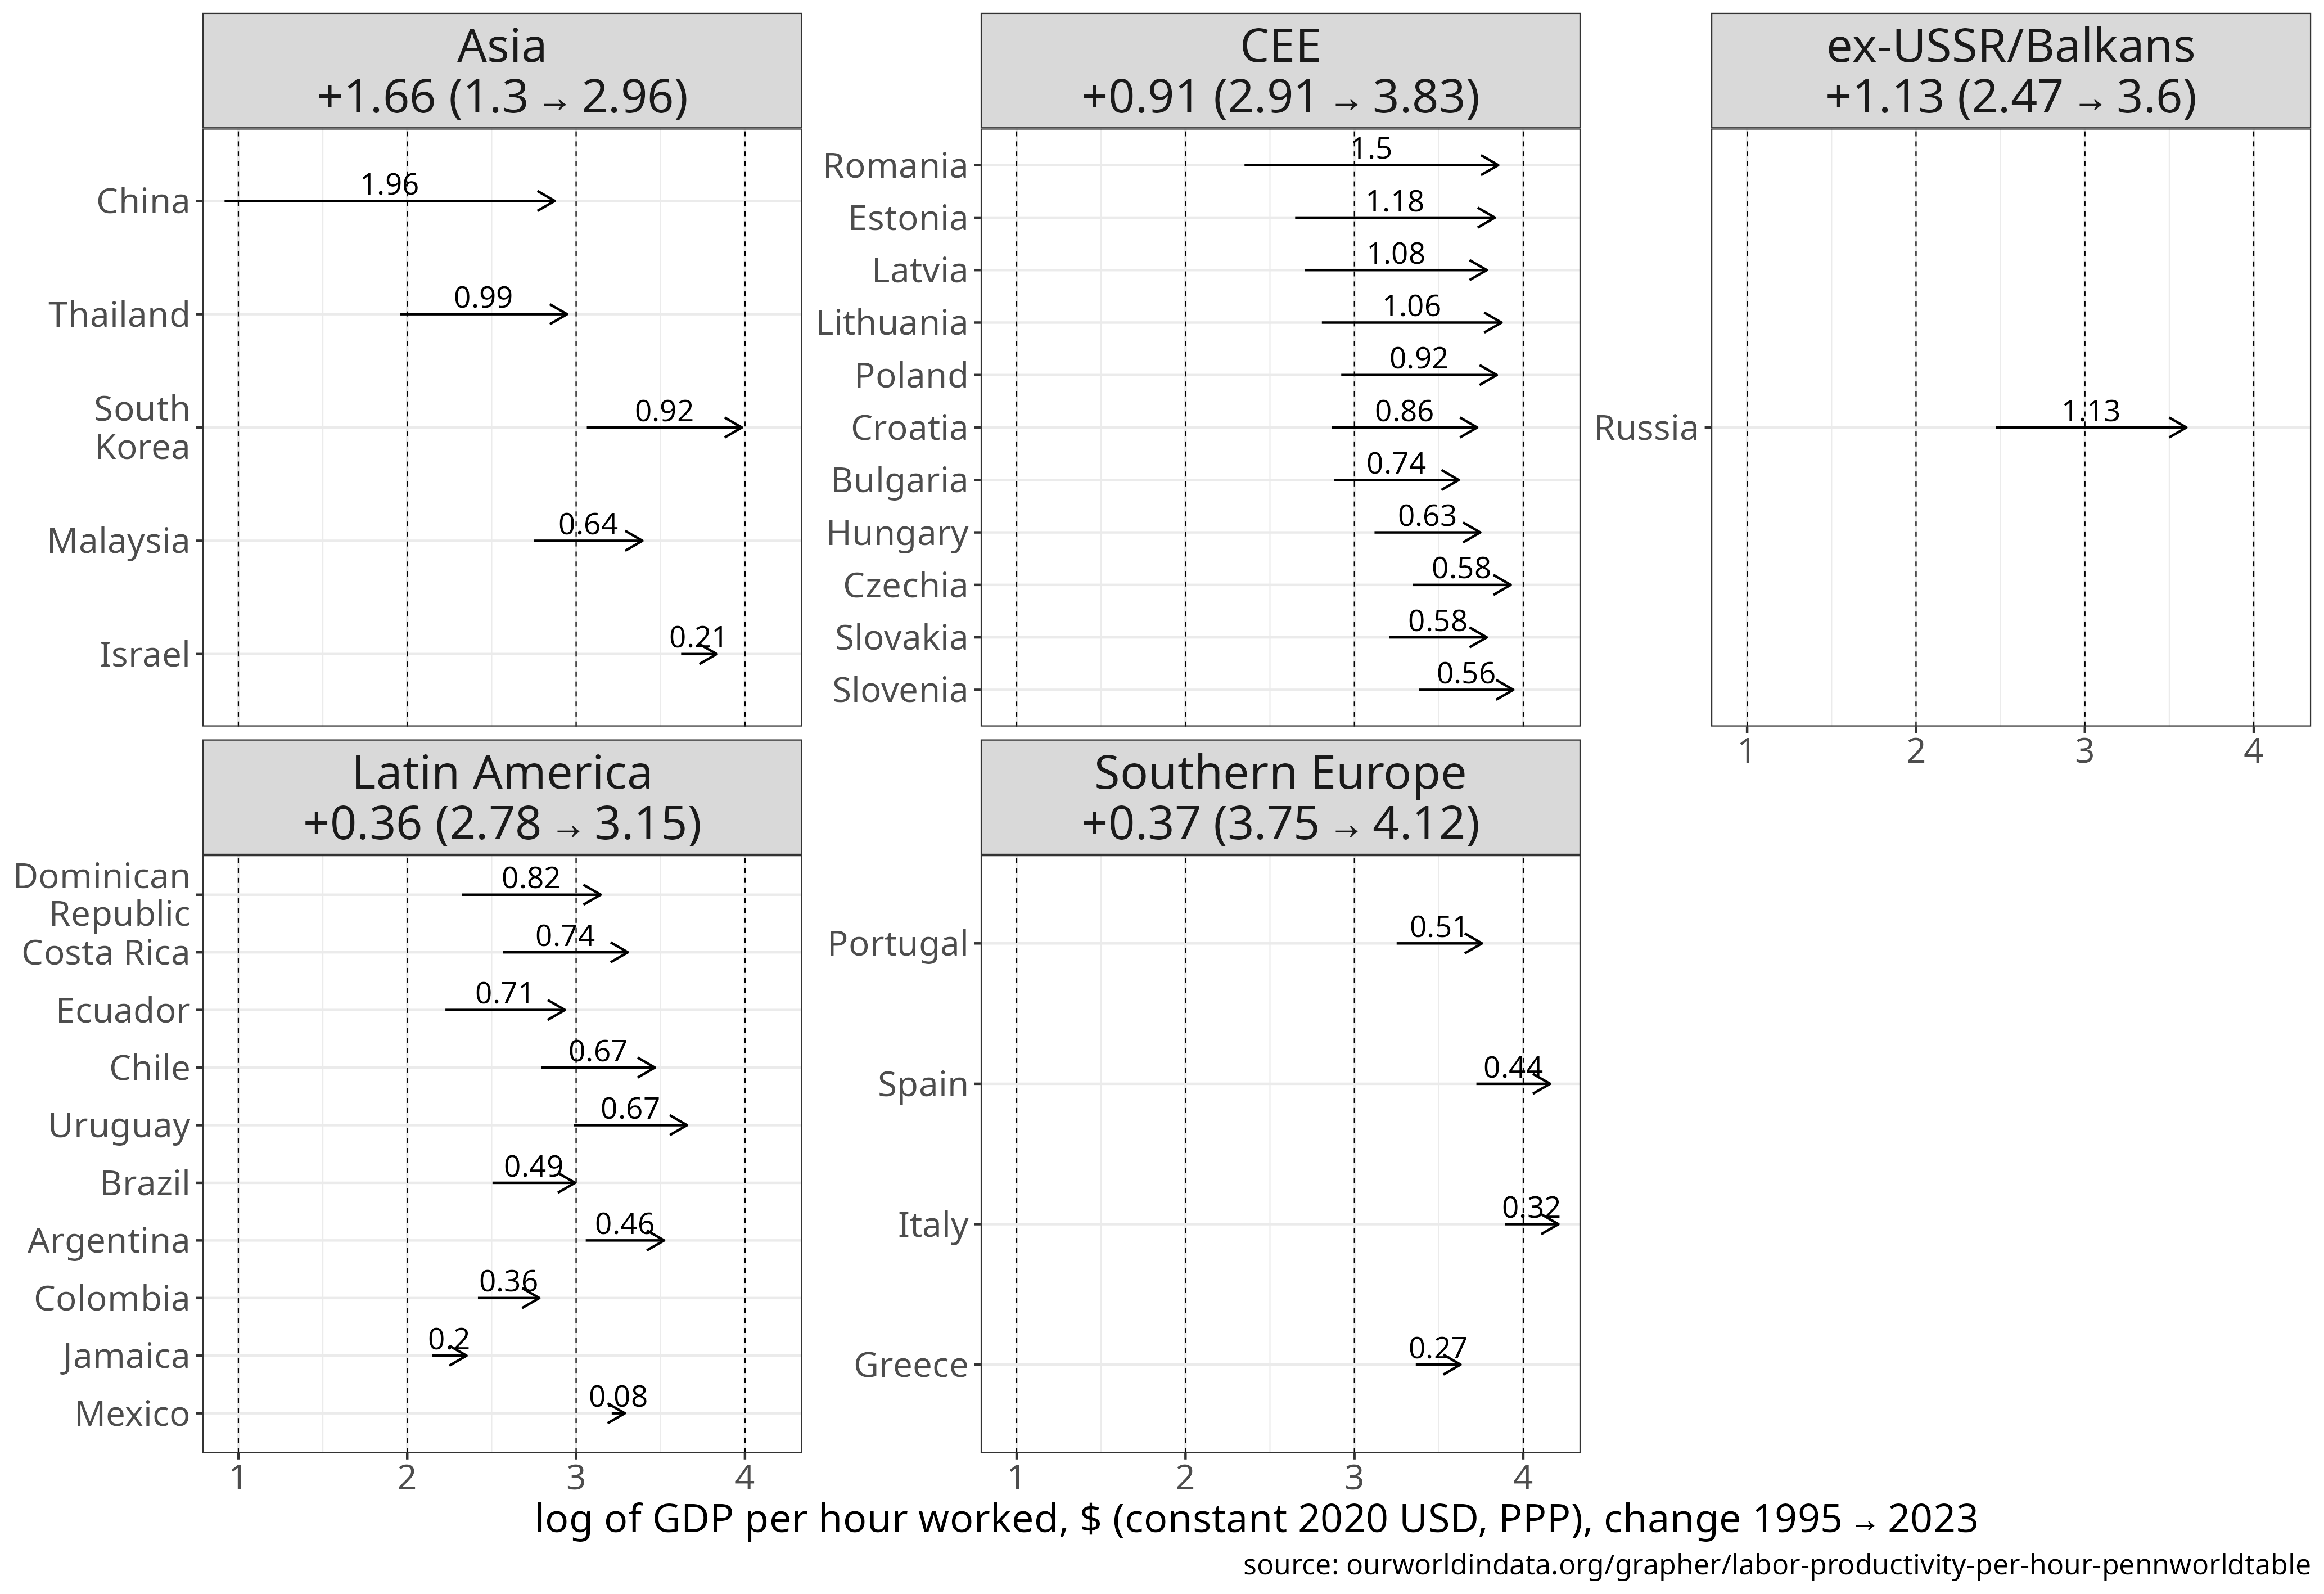

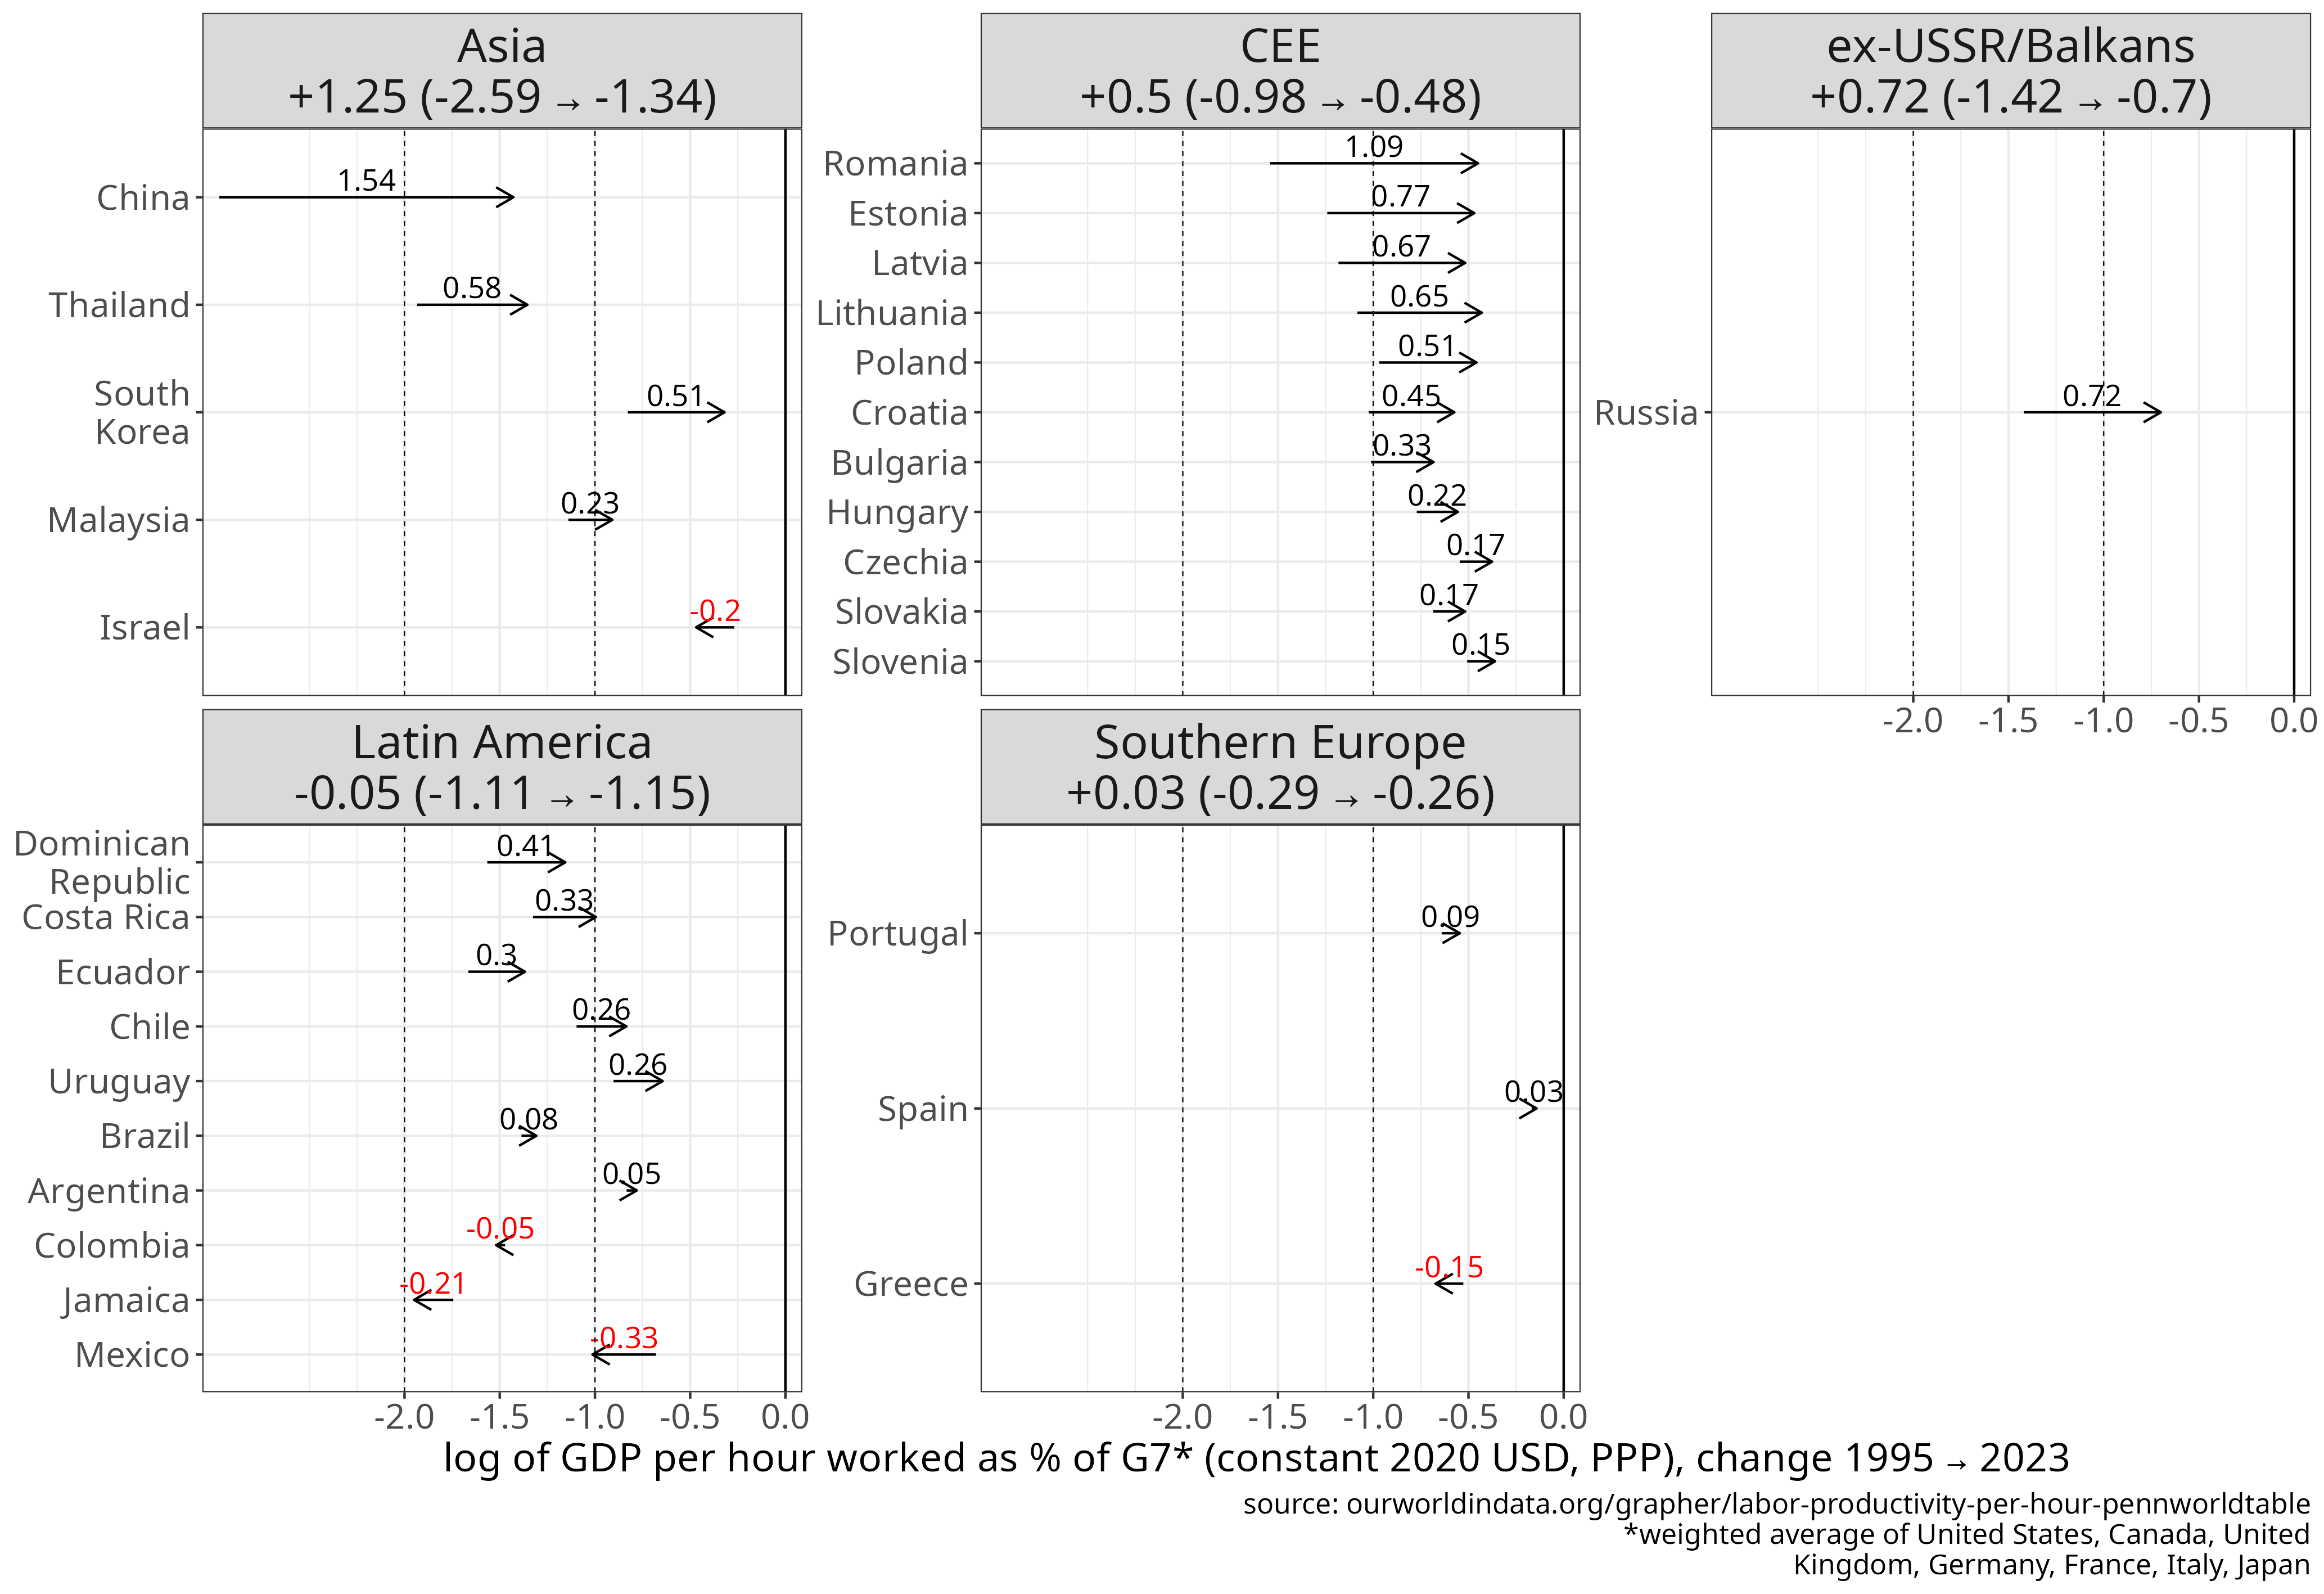

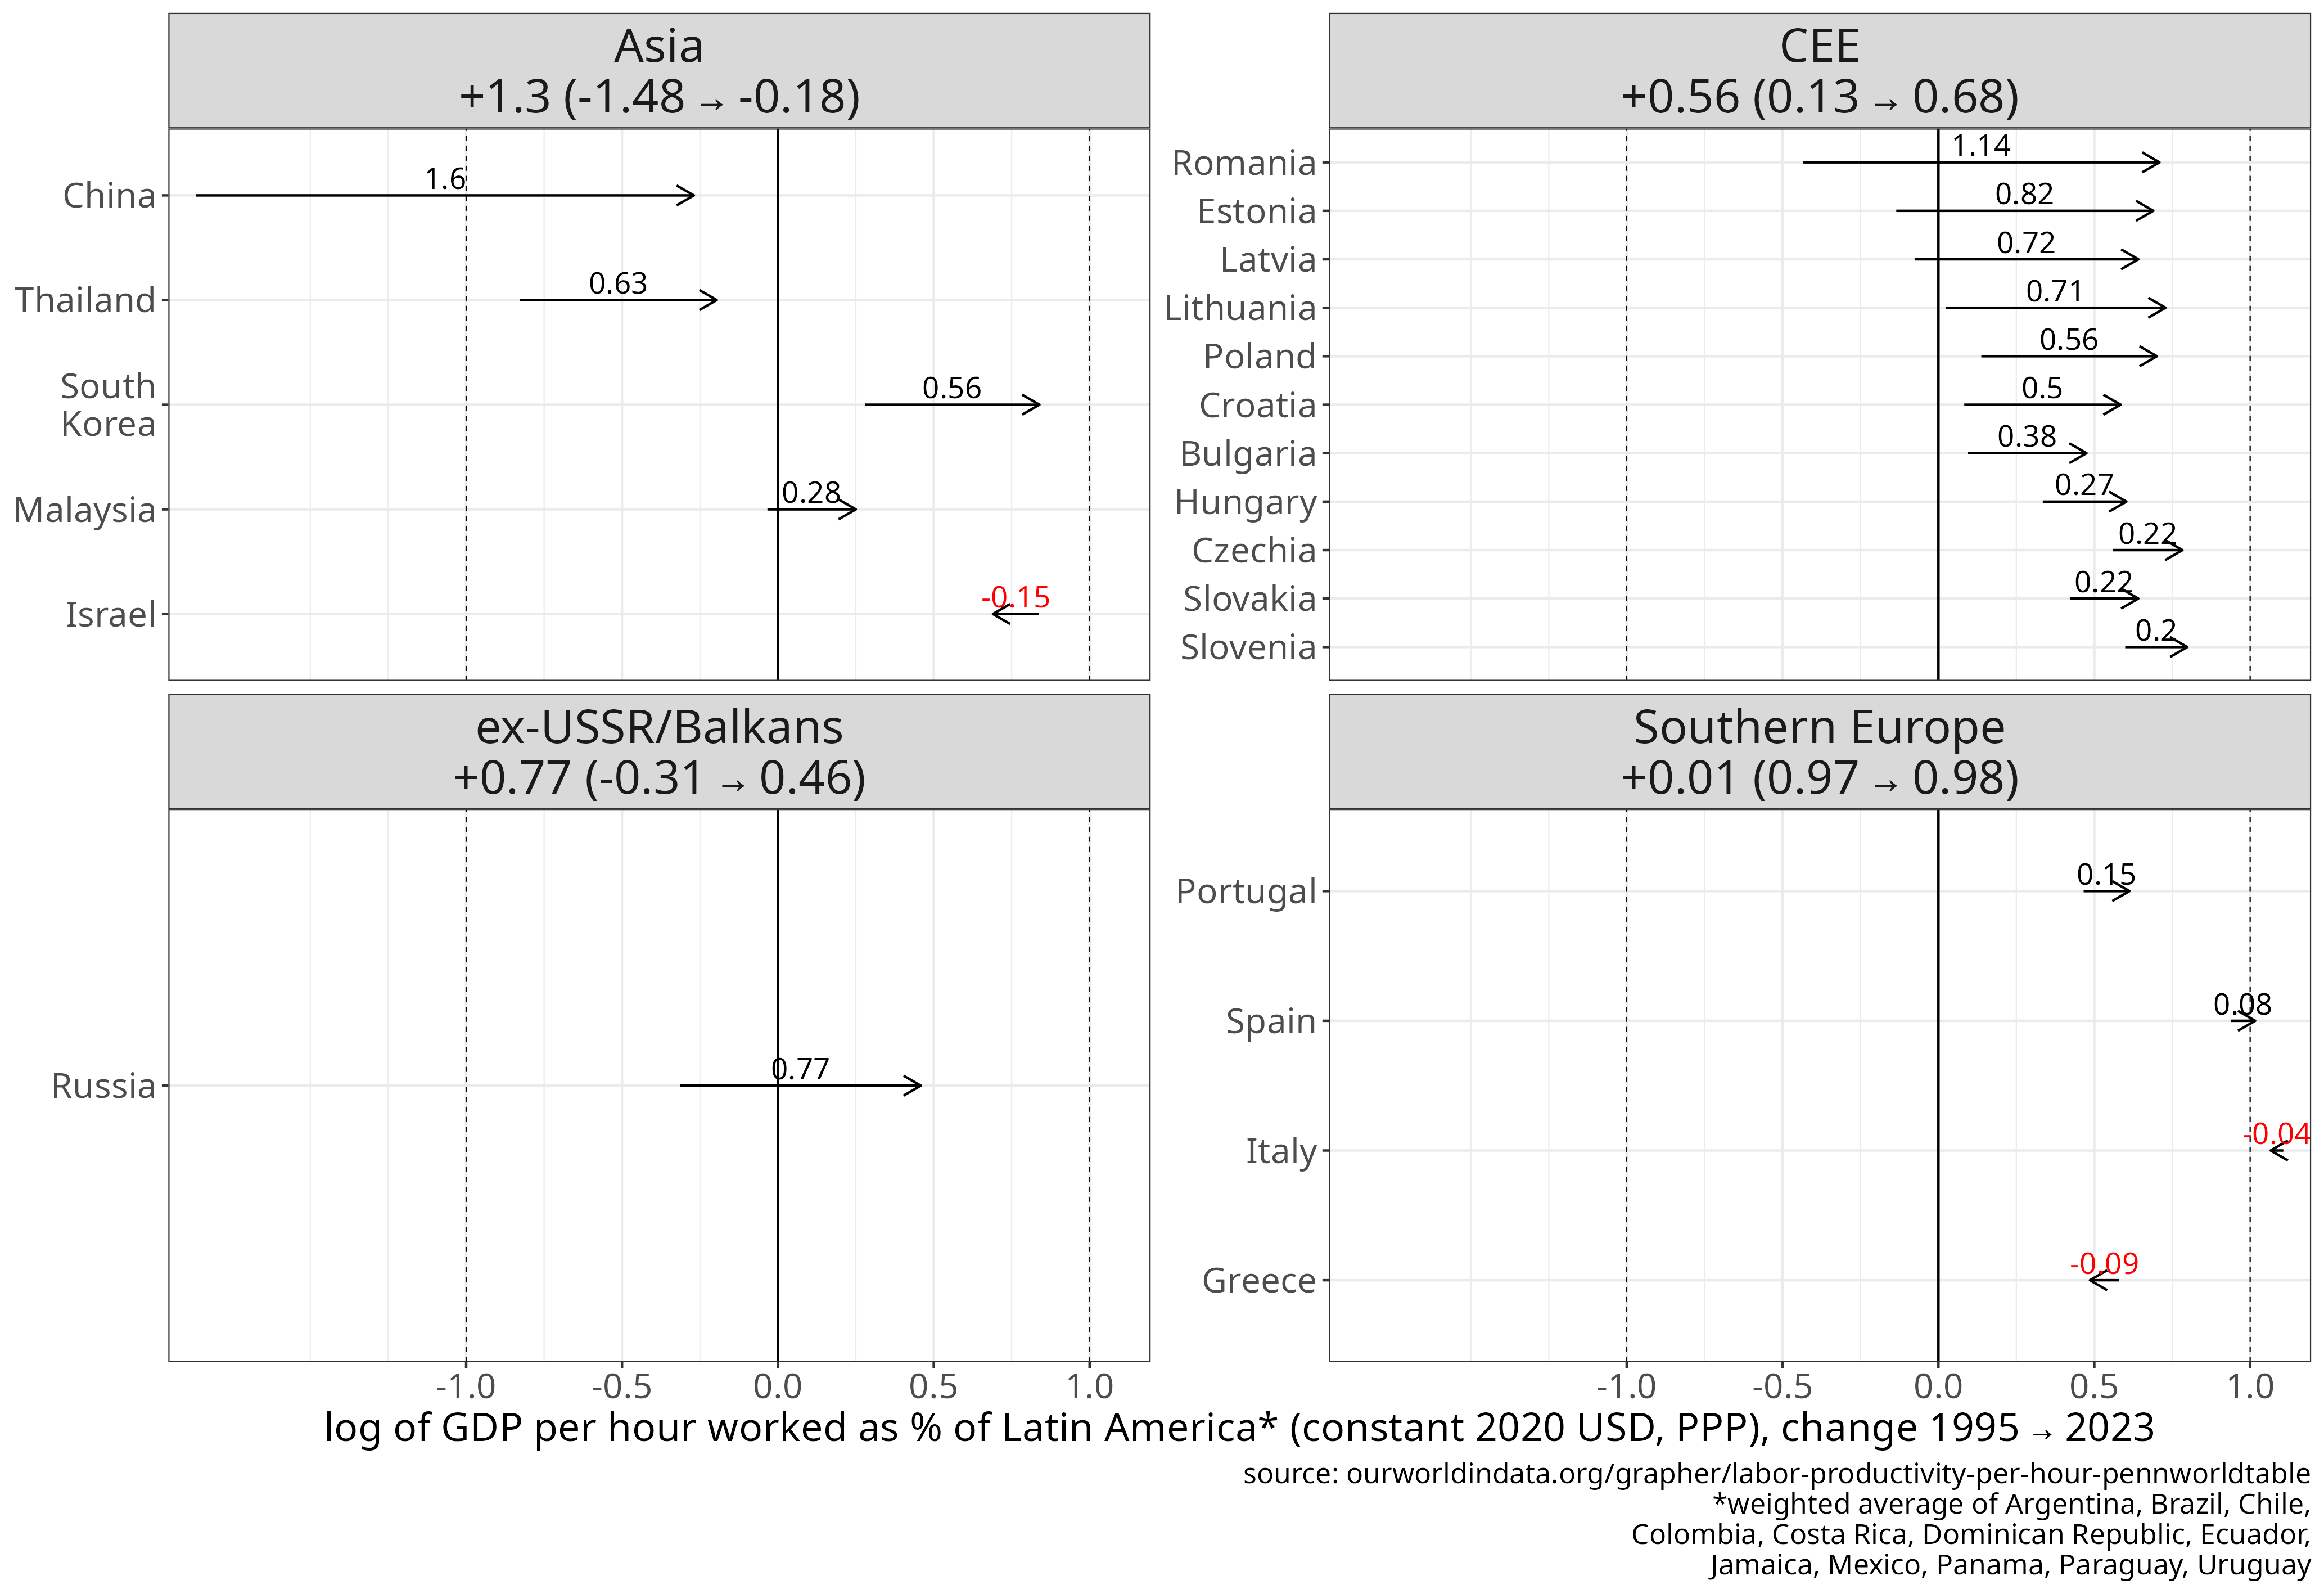
Figure 9 Cumulative change in GDP per hour worked. In constant USD PPP 2020, or expressed as % of the Western core (DE/G7), Southern Europe and Latin America. Linear scale shows the absolute difference between start and end point. Log scale show the (natural) logarithm of the ratio of the end to start value.
[download plot data]
[source]
Data for output per hour worked is sparser and missing for several non-OECD countries (mainly Africa and ex-USSR) before 2005; we analysed the data for those countries where it was available since 1995.
The basic trends are similar to productivity per employed person and to GDP/GNI per capita.
Again, the CEE countries had the biggest increase in absolute (constant USD) terms or as a % of the German/G7 level, followed closely by Asian economies, where the average is dominated by China.
If we are looking at relative increase from the initial baseline, then again Asia saw the largest increase (4.75x), again followed by CEE (2.4x).
Within CEE it is especially RO, PL, and the Baltics that showed strong convergence (+20-35%) towards the German level. In HU, CZ, SK and SI the increase was only around +6-8%, although CZ and SI were already at ~55% of the German level in 1995. The weighted average of CEE went from 36 to 56% of Germany’s level, substantially less than if we look by output per employee, where CEE reached 75% of the DE level.
This smaller increment for output per hour compared to per employee is also due to the fact that output per hour rose in Germany (+63%) much more than per employee (+22%), as parallel to rising (per hour) productivity in Germany annual working hours went down.
In that sense, Germany is a very high bar for the labour productivity per hour metric, as its value was as high as the USA’s in 2024.
CEE convergence compared to the G7 (38→62%), Southern Europe (44→74%) was stronger, and CEE pulled away from Latin America (116→197%).
GDP per capita in CEE grew faster than labour productivity relative to Germany and the G7, partly because employment rates have risen since the 2000s, lifting GDP per person.
Today the employment share of the 15+ population in CEE is similar to Germany’s, while annual working hours are still higher.
For CEE, raising labour productivity per hour is now the main lever for increasing output and income per person - not only for workers, but the entire population - and converge to the West European level.
While CEE has showed substantial convergence since 1995, moving from the 25-40% range of the German level to 55-62%, it still has a large gap to cover in this metric.
Wages, earnings and income: trends since 1990
At this point, one could raise the objection: all these metrics so far are output measures, but how much of the value produced went to the working population and their household members who do not work? Perhaps the rise in GDP/GNI per capita or labour productivity has not been reflected in the earnings and income of the working population. I review three metrics of wages/earnings and household income below, to analyse if labour/household income growth have been on a similar level as in output.
Annual average wages
The OECD have international data on annual average wages, which are the annual rates paid per employee in full-time equivalent unit in the total economy. This is an arithmetic average, not a median; in most HICs the median is around 65-80% of the average. This data only includes OECD members, which are high-income countries, so we have no data for any of the African peer countries, and only for three Latin American and two Asian economies. I plot the trends in Figure 9, using the same metrics as in the previous plots.
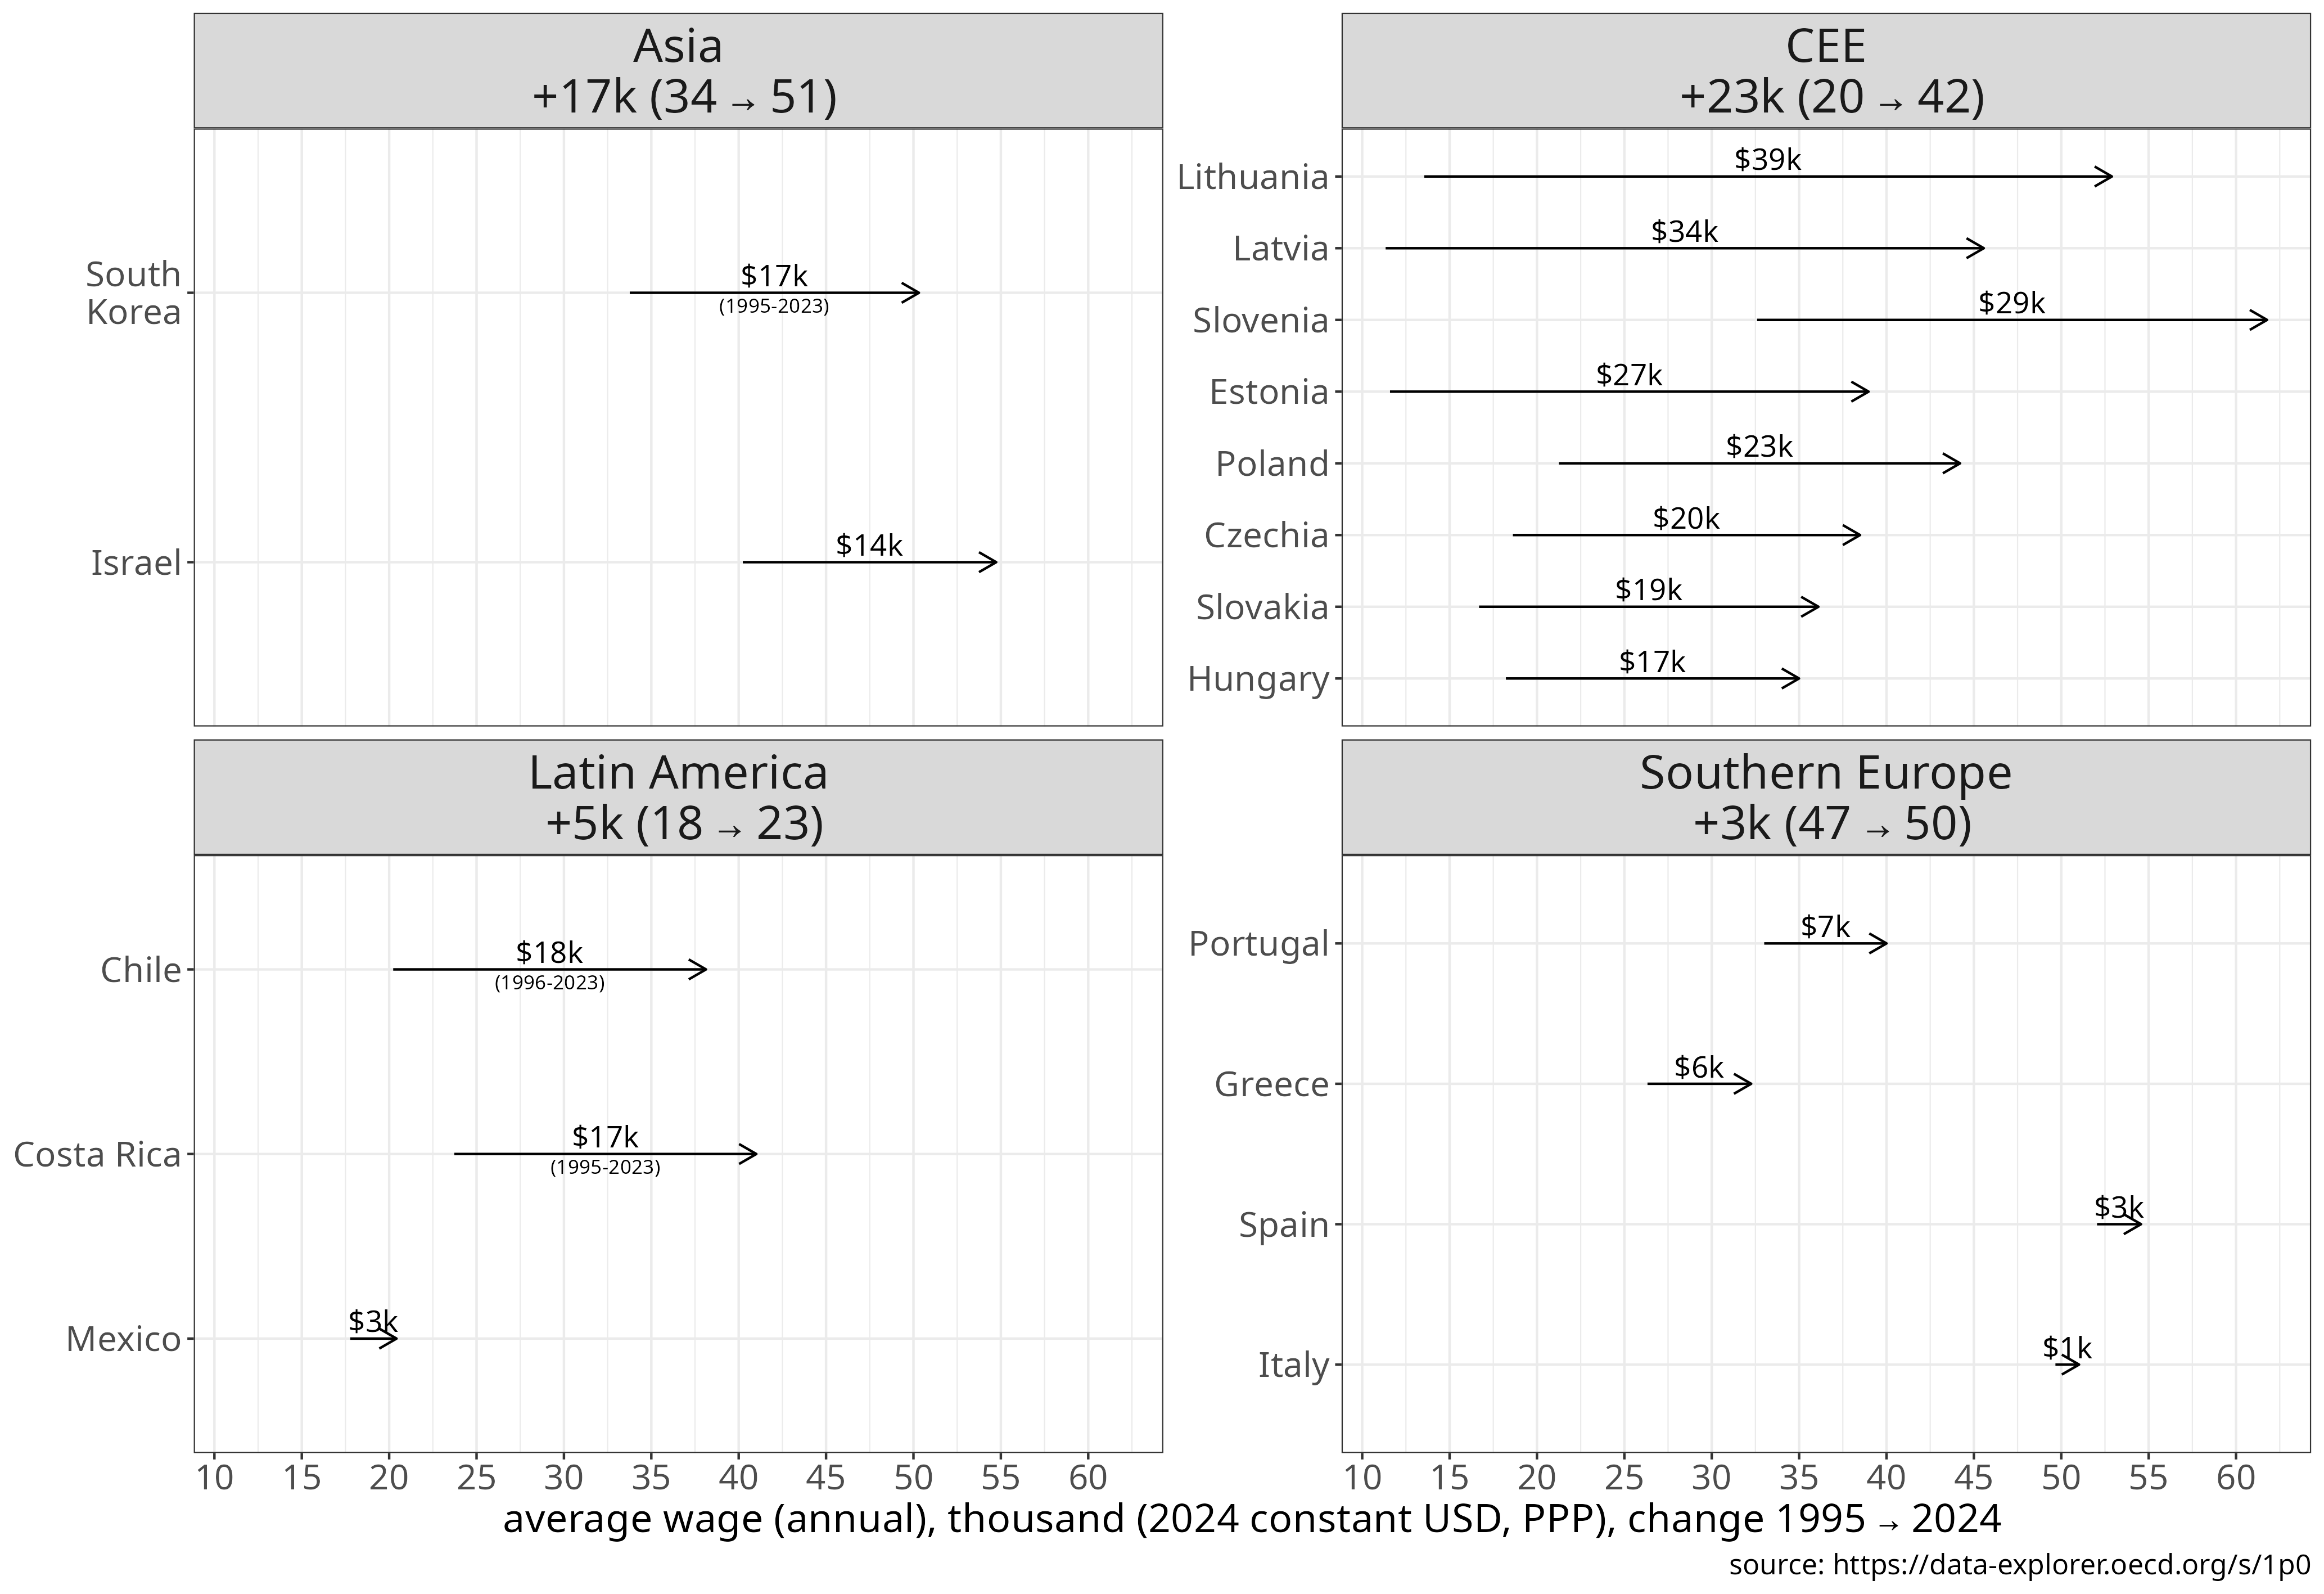
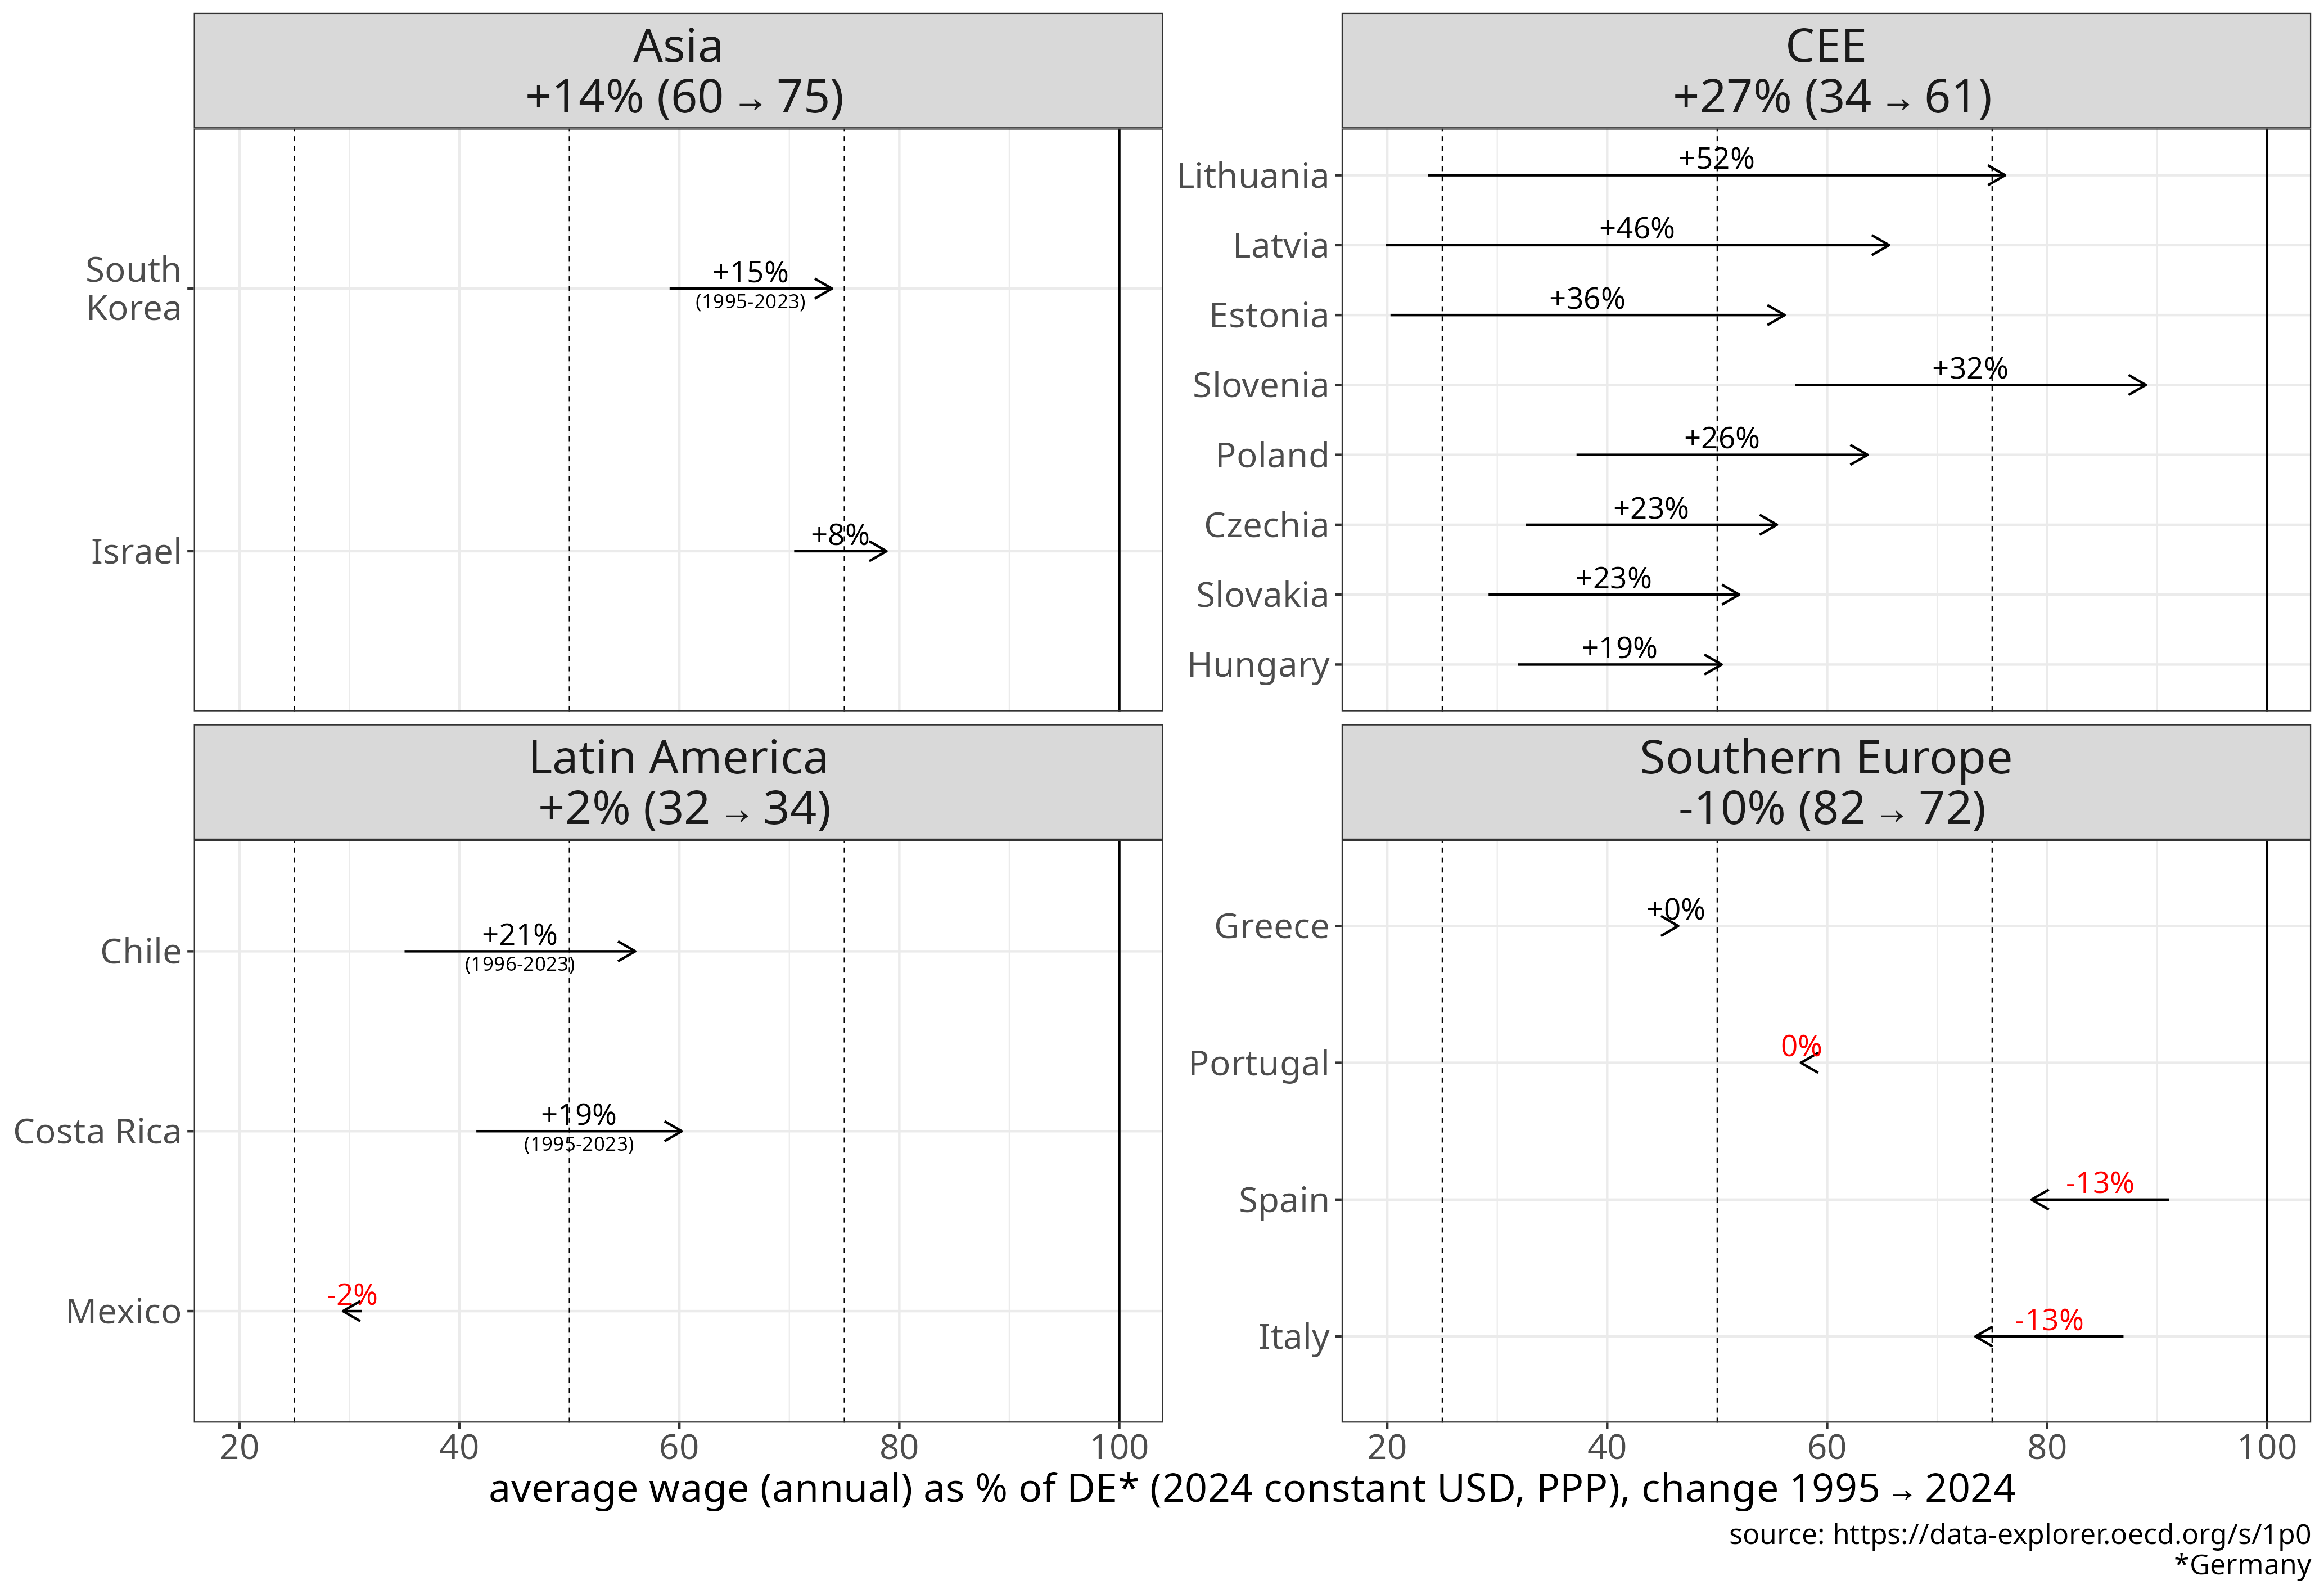
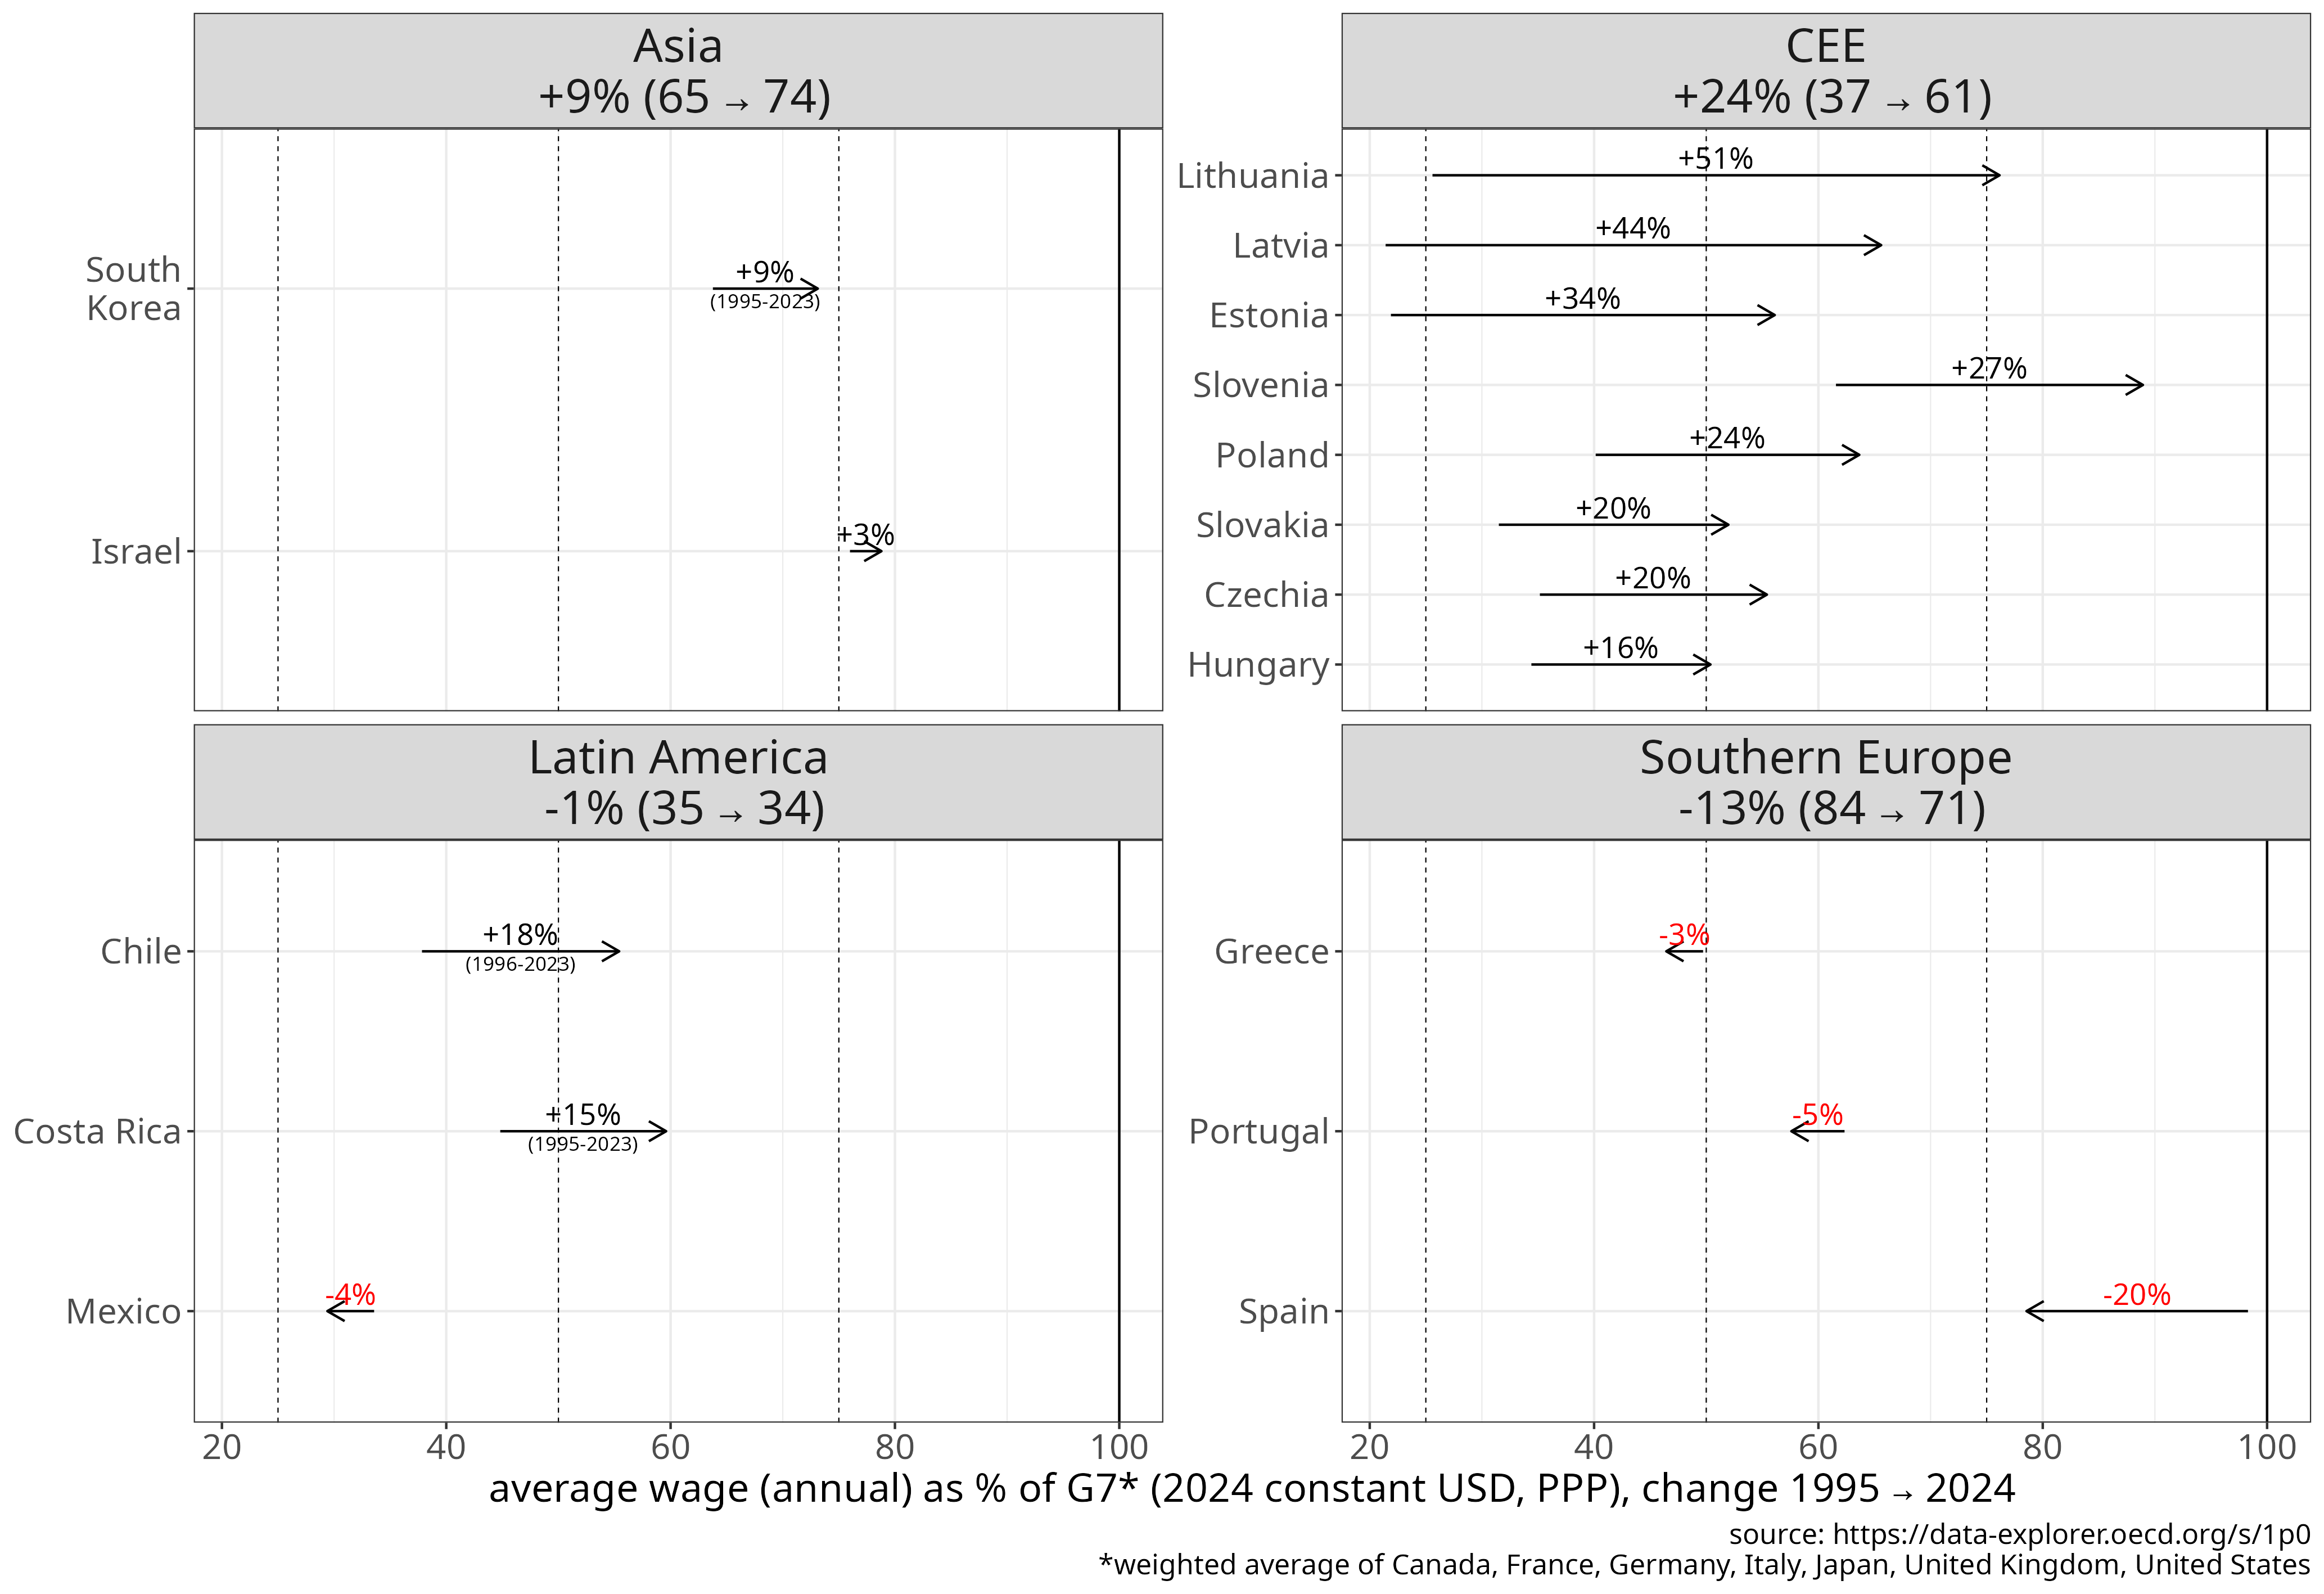
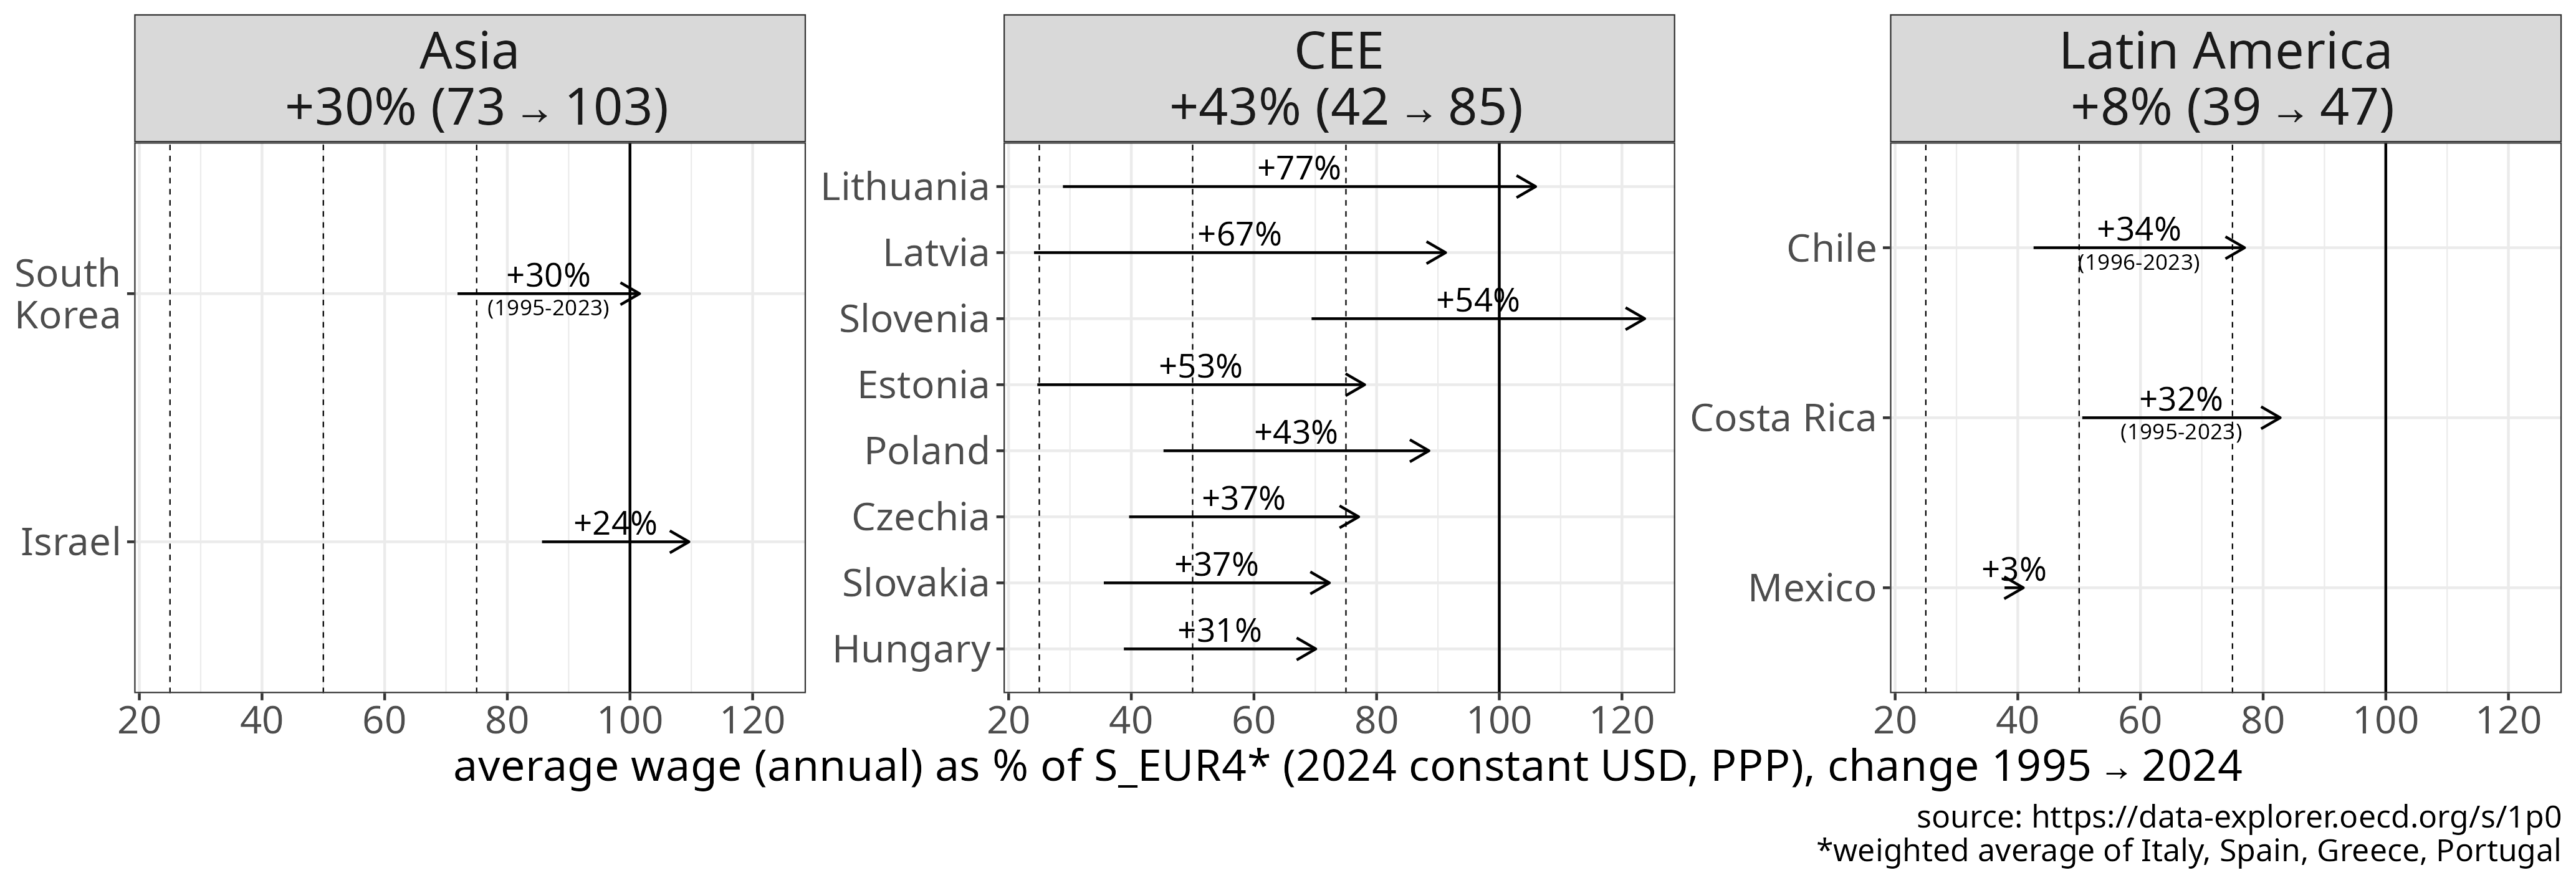
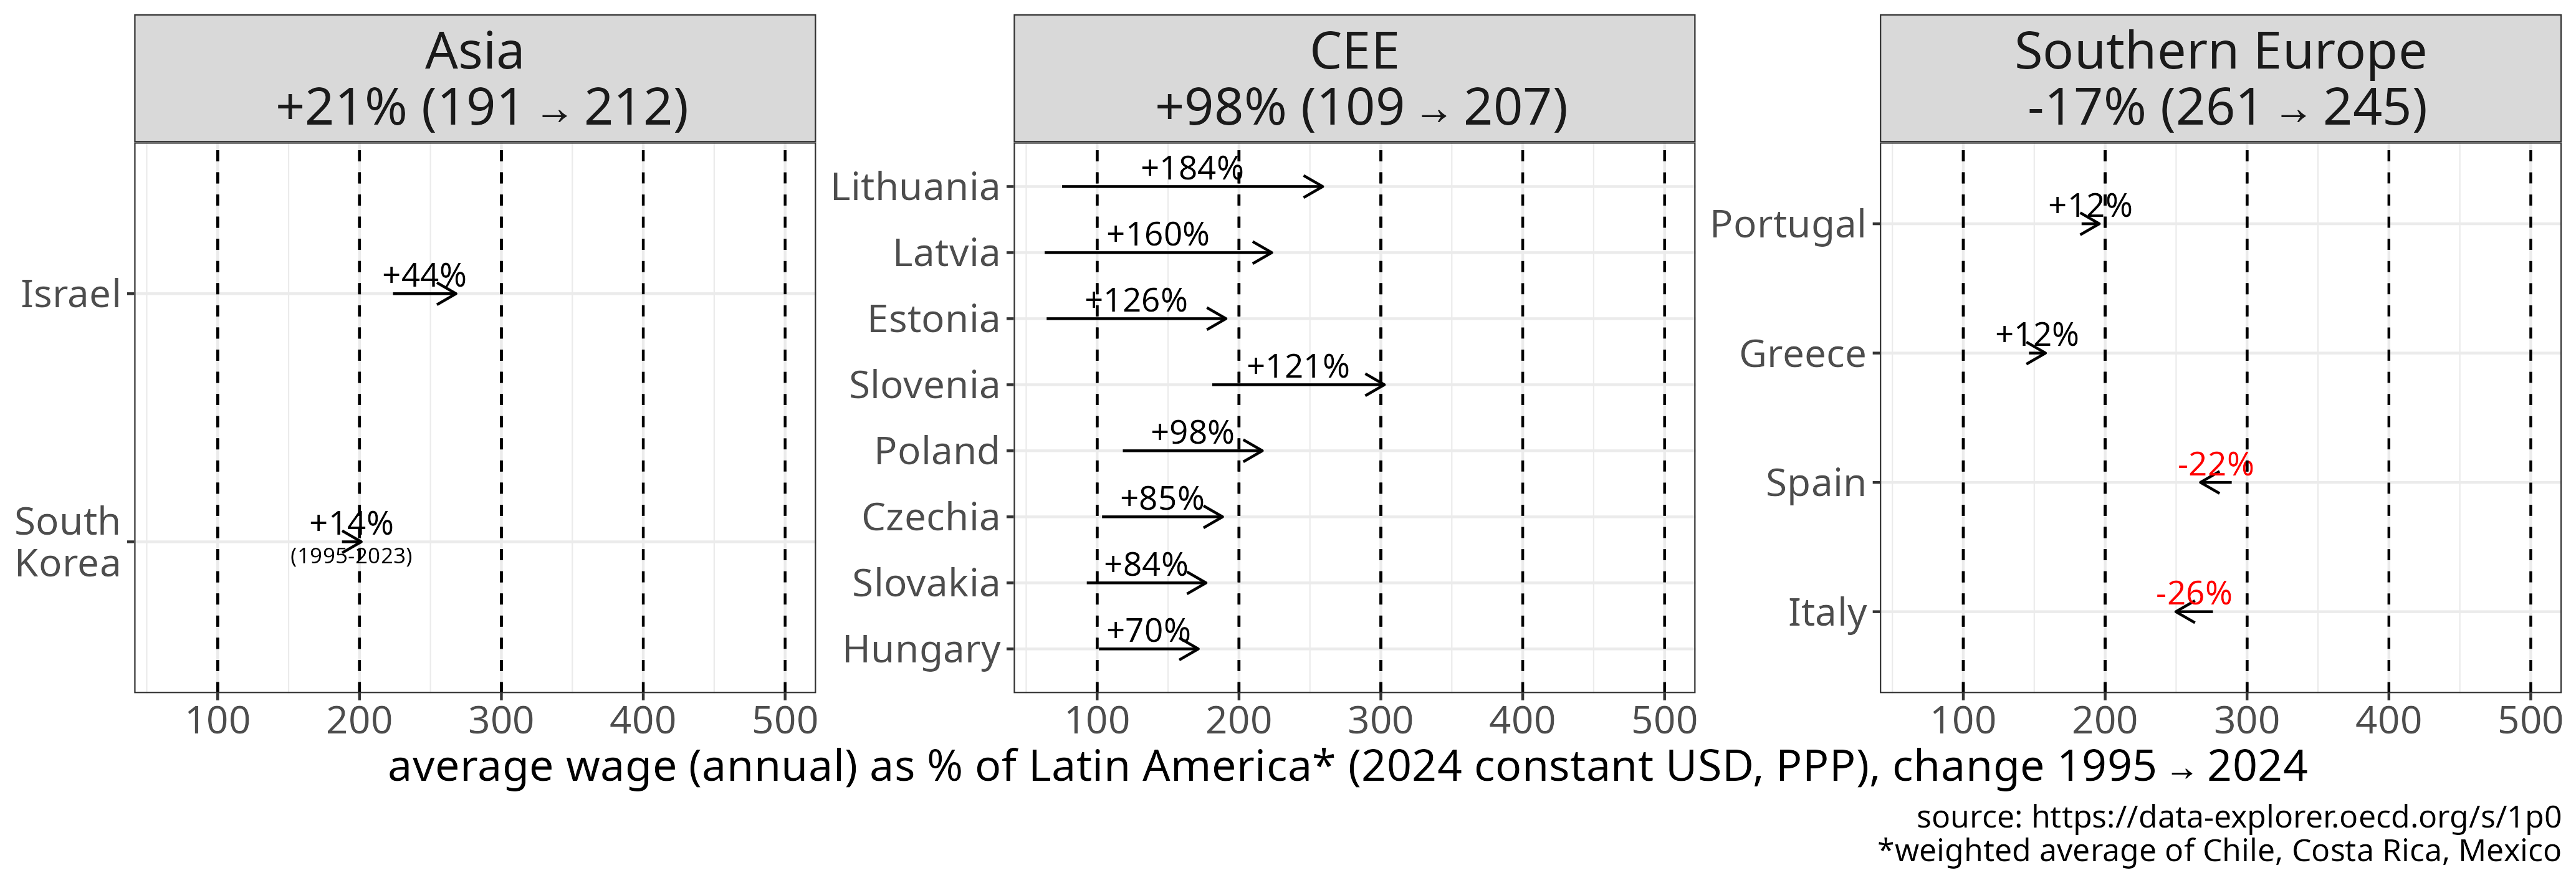
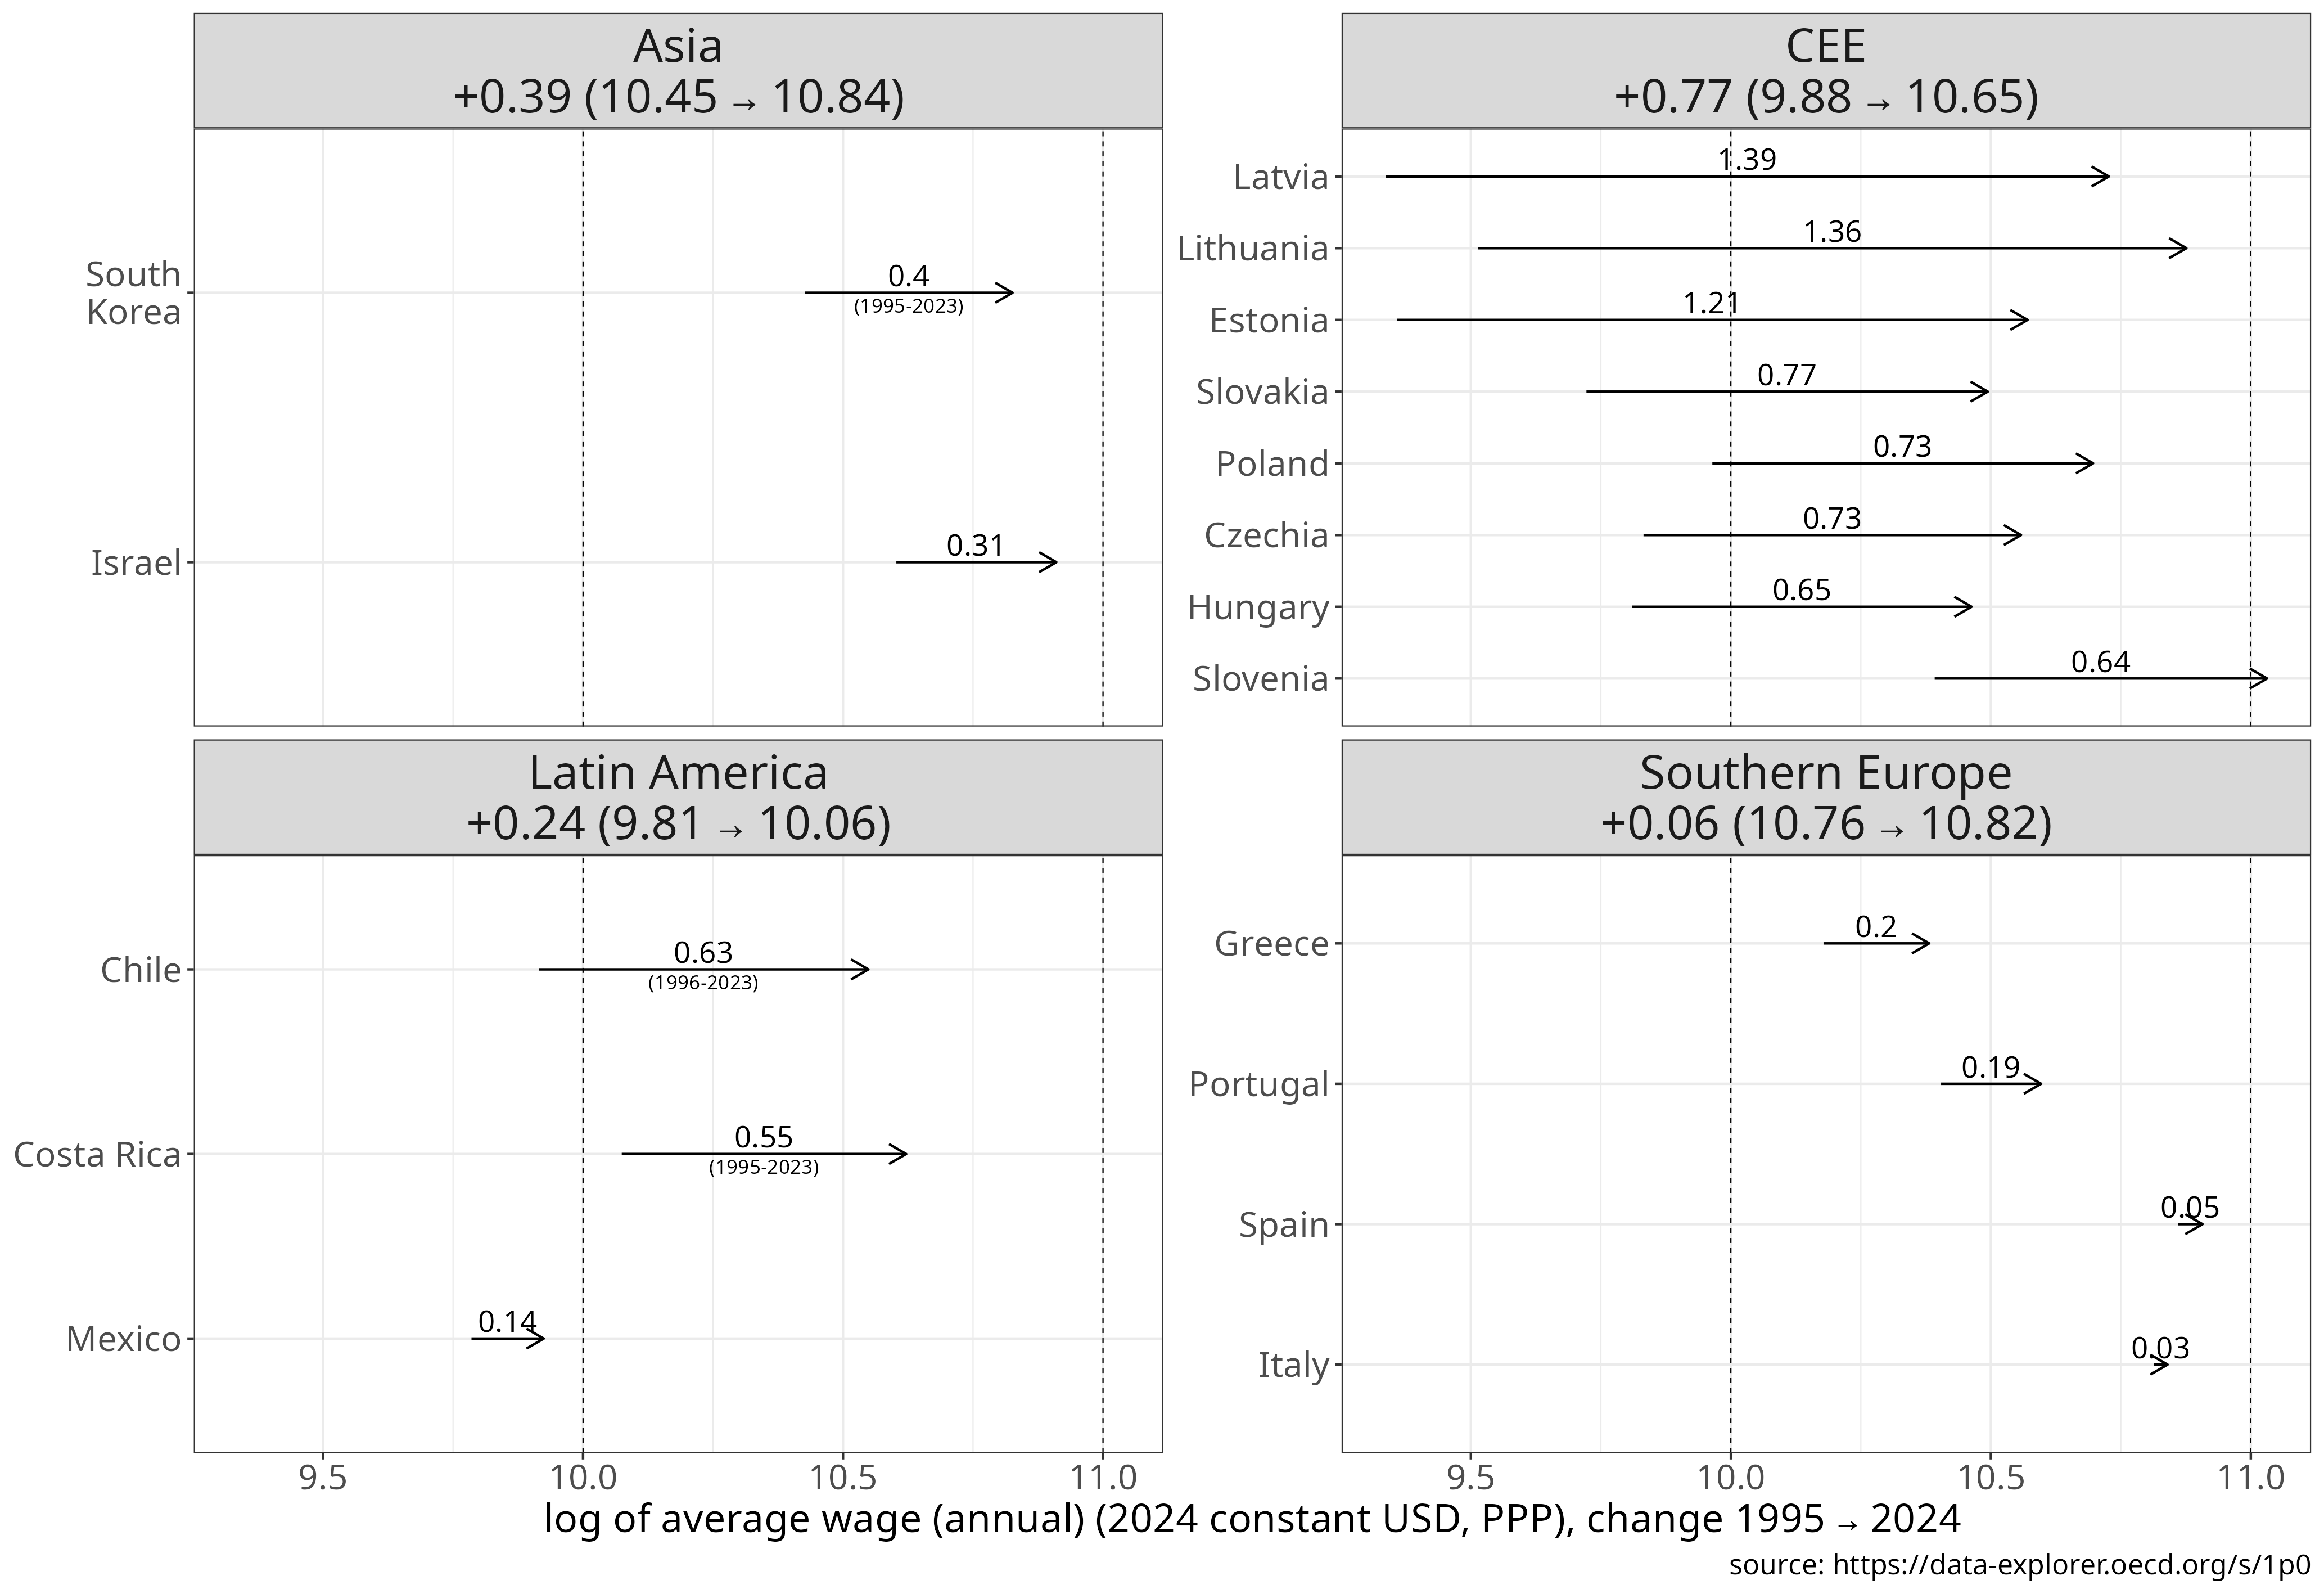
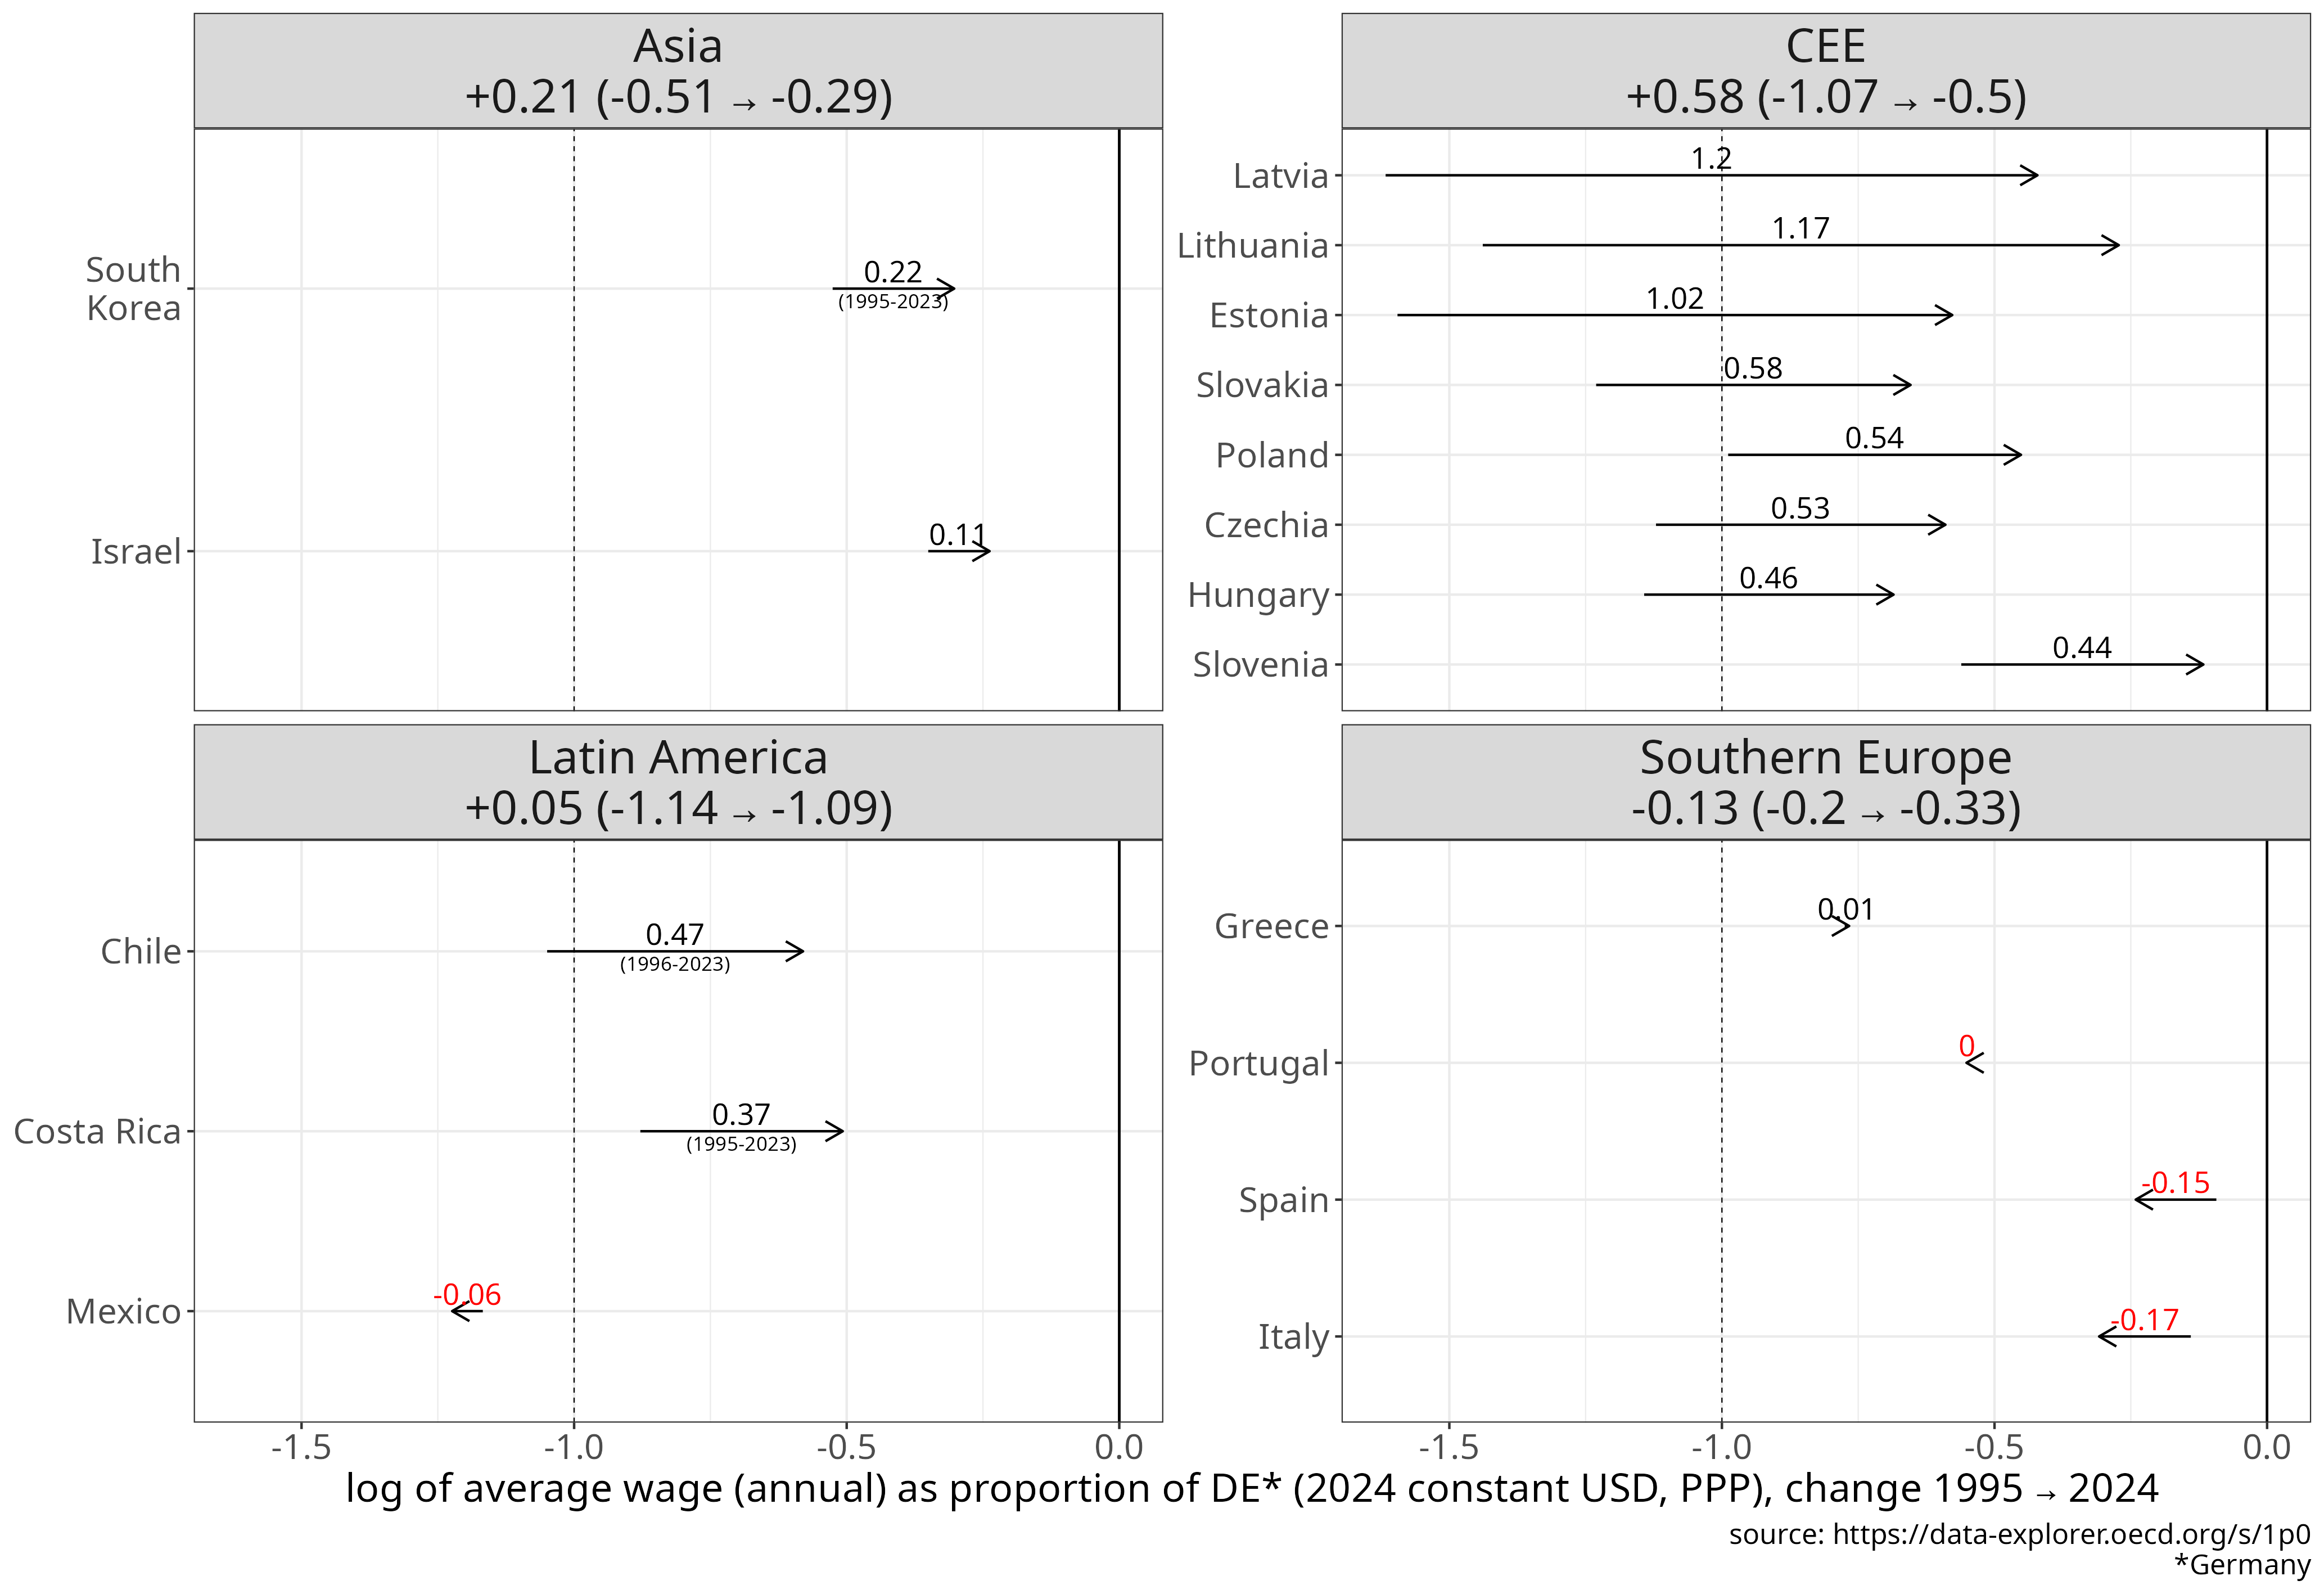

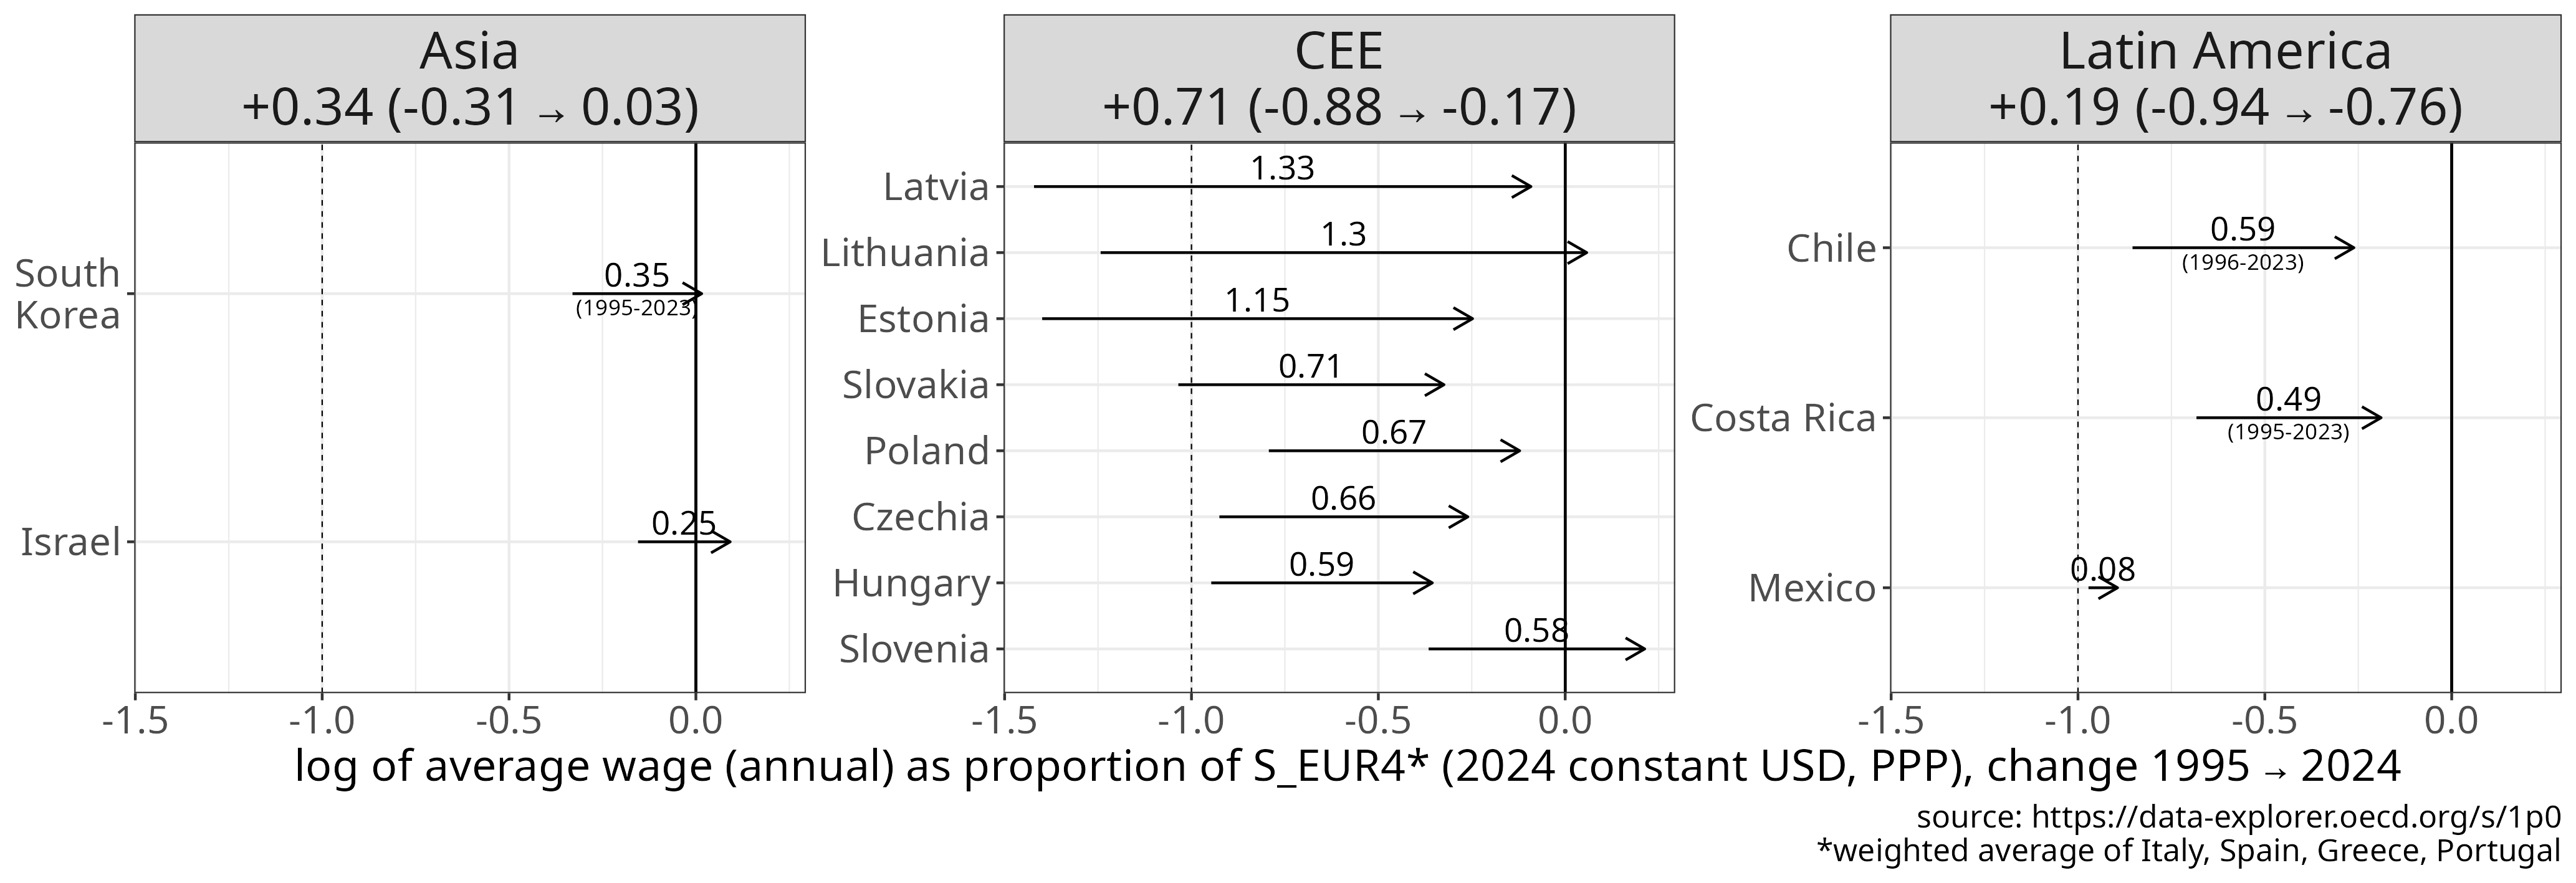
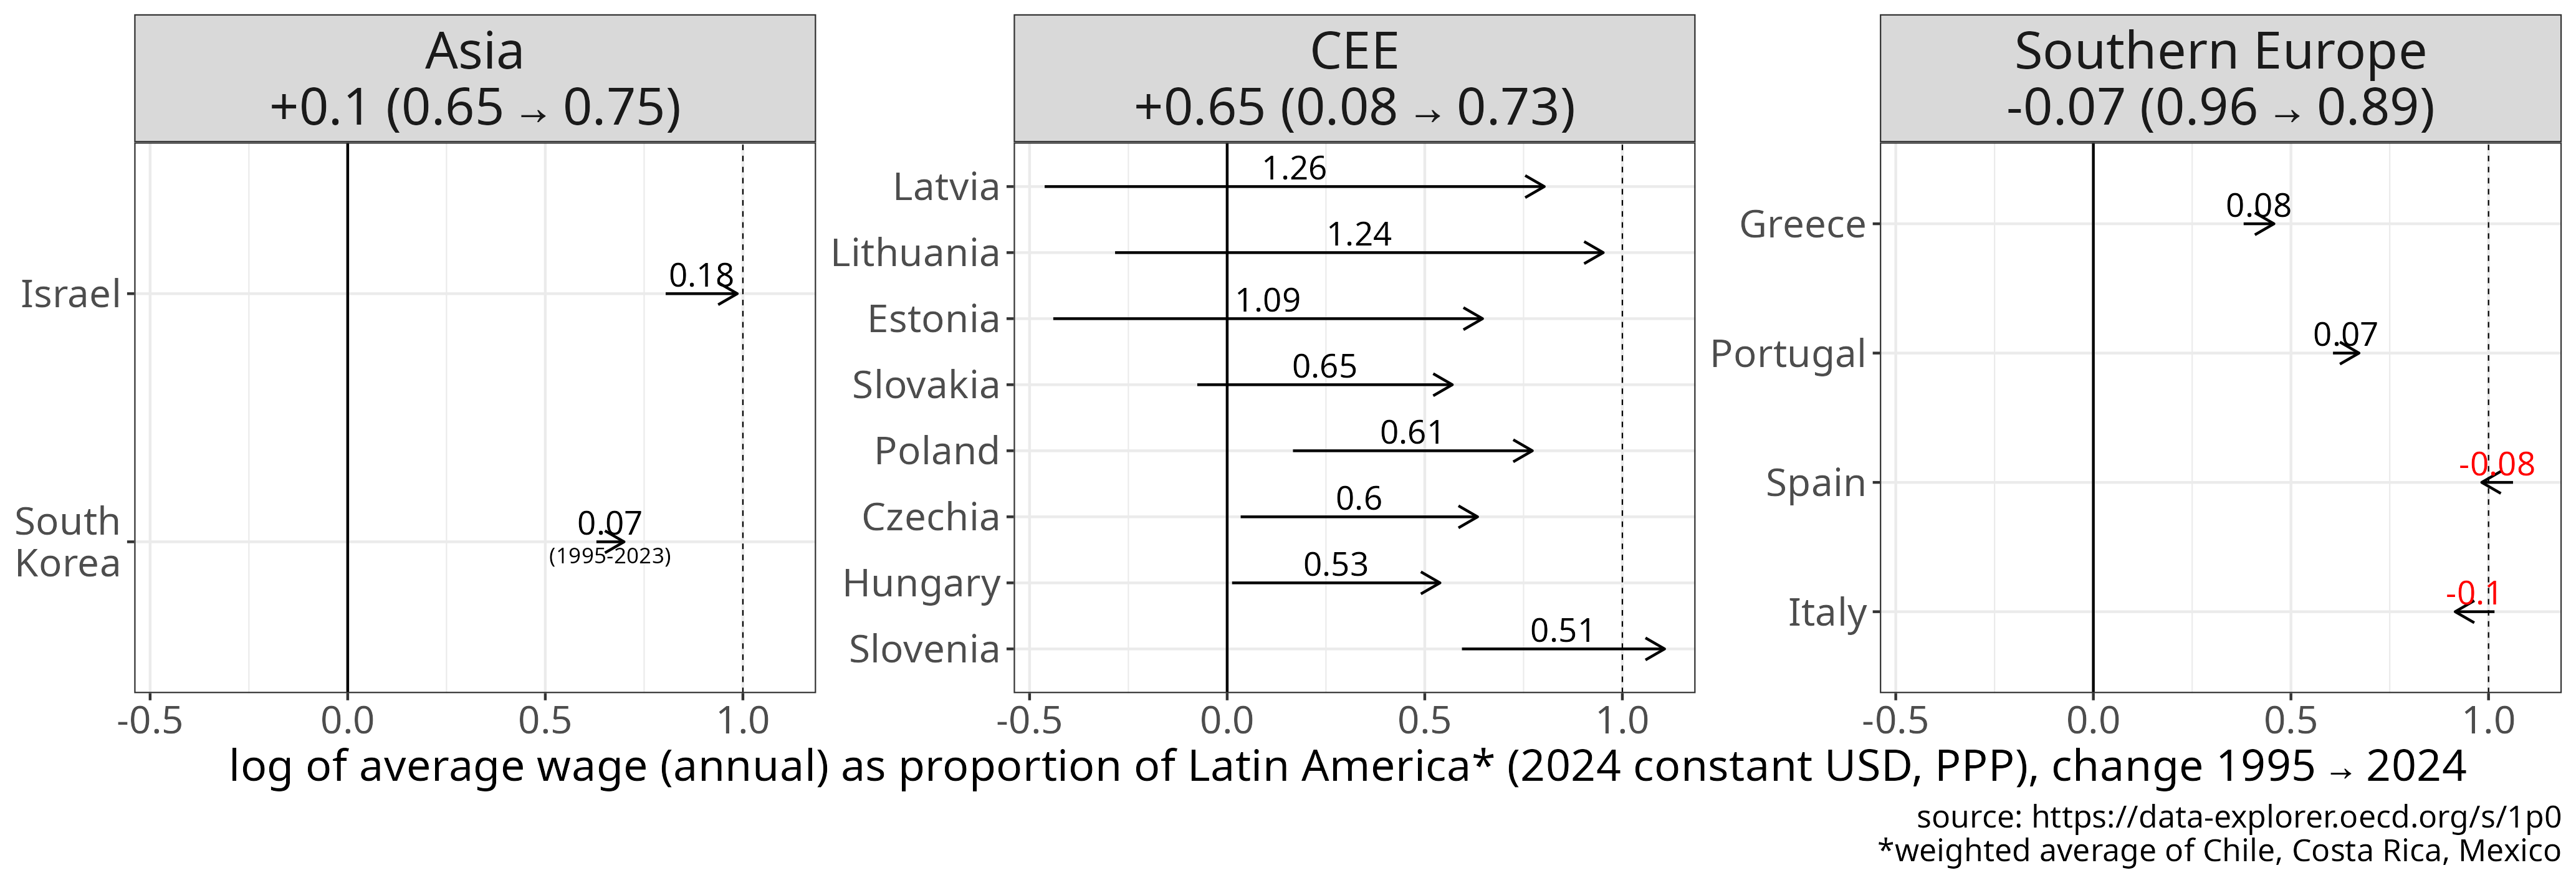
Figure 9
Annual average wage, by world region, from 1995 to 2024.
Units: constant USD PPP 2024, or as % of Germany, the G7, Southern Europe or Latin America.
Linear scale shows the absolute difference between the end and start values (in thousand USD or in % of the benchmark value).
Log scale shows the difference on a logarithmic scale.
[download plot data]
[source]
Again, in absolute terms the CEE region’s weighted average shows the largest increase, approximately 23k constant (2024) USD in PPPs from 1995 to 2024. This is again closely followed by the average of the Asian economies (+17k) and much smaller values for Latin America (+5k) and Southern Europe (+3k). The Southern European economies and Mexico showed very little real wage growth over this period.
Since in this case the Asian group only include two countries (that are HICs: South Korea and Israel), starting from a higher basis, the increase of the CEE average is the largest across the four peer regions in relative terms as well, a 2.1x increase compared to 1.5x in Asia and 1.27x in Latin America.
Expressed as a % of Germany’s level this meant moving from 34 to 61% over the 30 year period, while Latin America stagnated around 35% (dominated by Mexico) and Southern Europe fell about 10%. As a consequence the CEE region’s average annual wages approached Southern Europe’s (85% in 2024) with two CEE countries (Lithuania and Slovenia) actually exceeding it.
Compared to Latin America, CEE moved from parity to ~210% of the Latin-American average, pulling away to a similar extent as in terms of GDP per capita.
In summary, average wages in CEE have been converging toward German levels at a pace similar to GDP per capita (+27% cumulatively). Starting from a lower base, wages still lag slightly behind GDP per capita in relative terms - reaching 61% of Germany’s level compared with 68% for GDP per capita.
Minimum wages
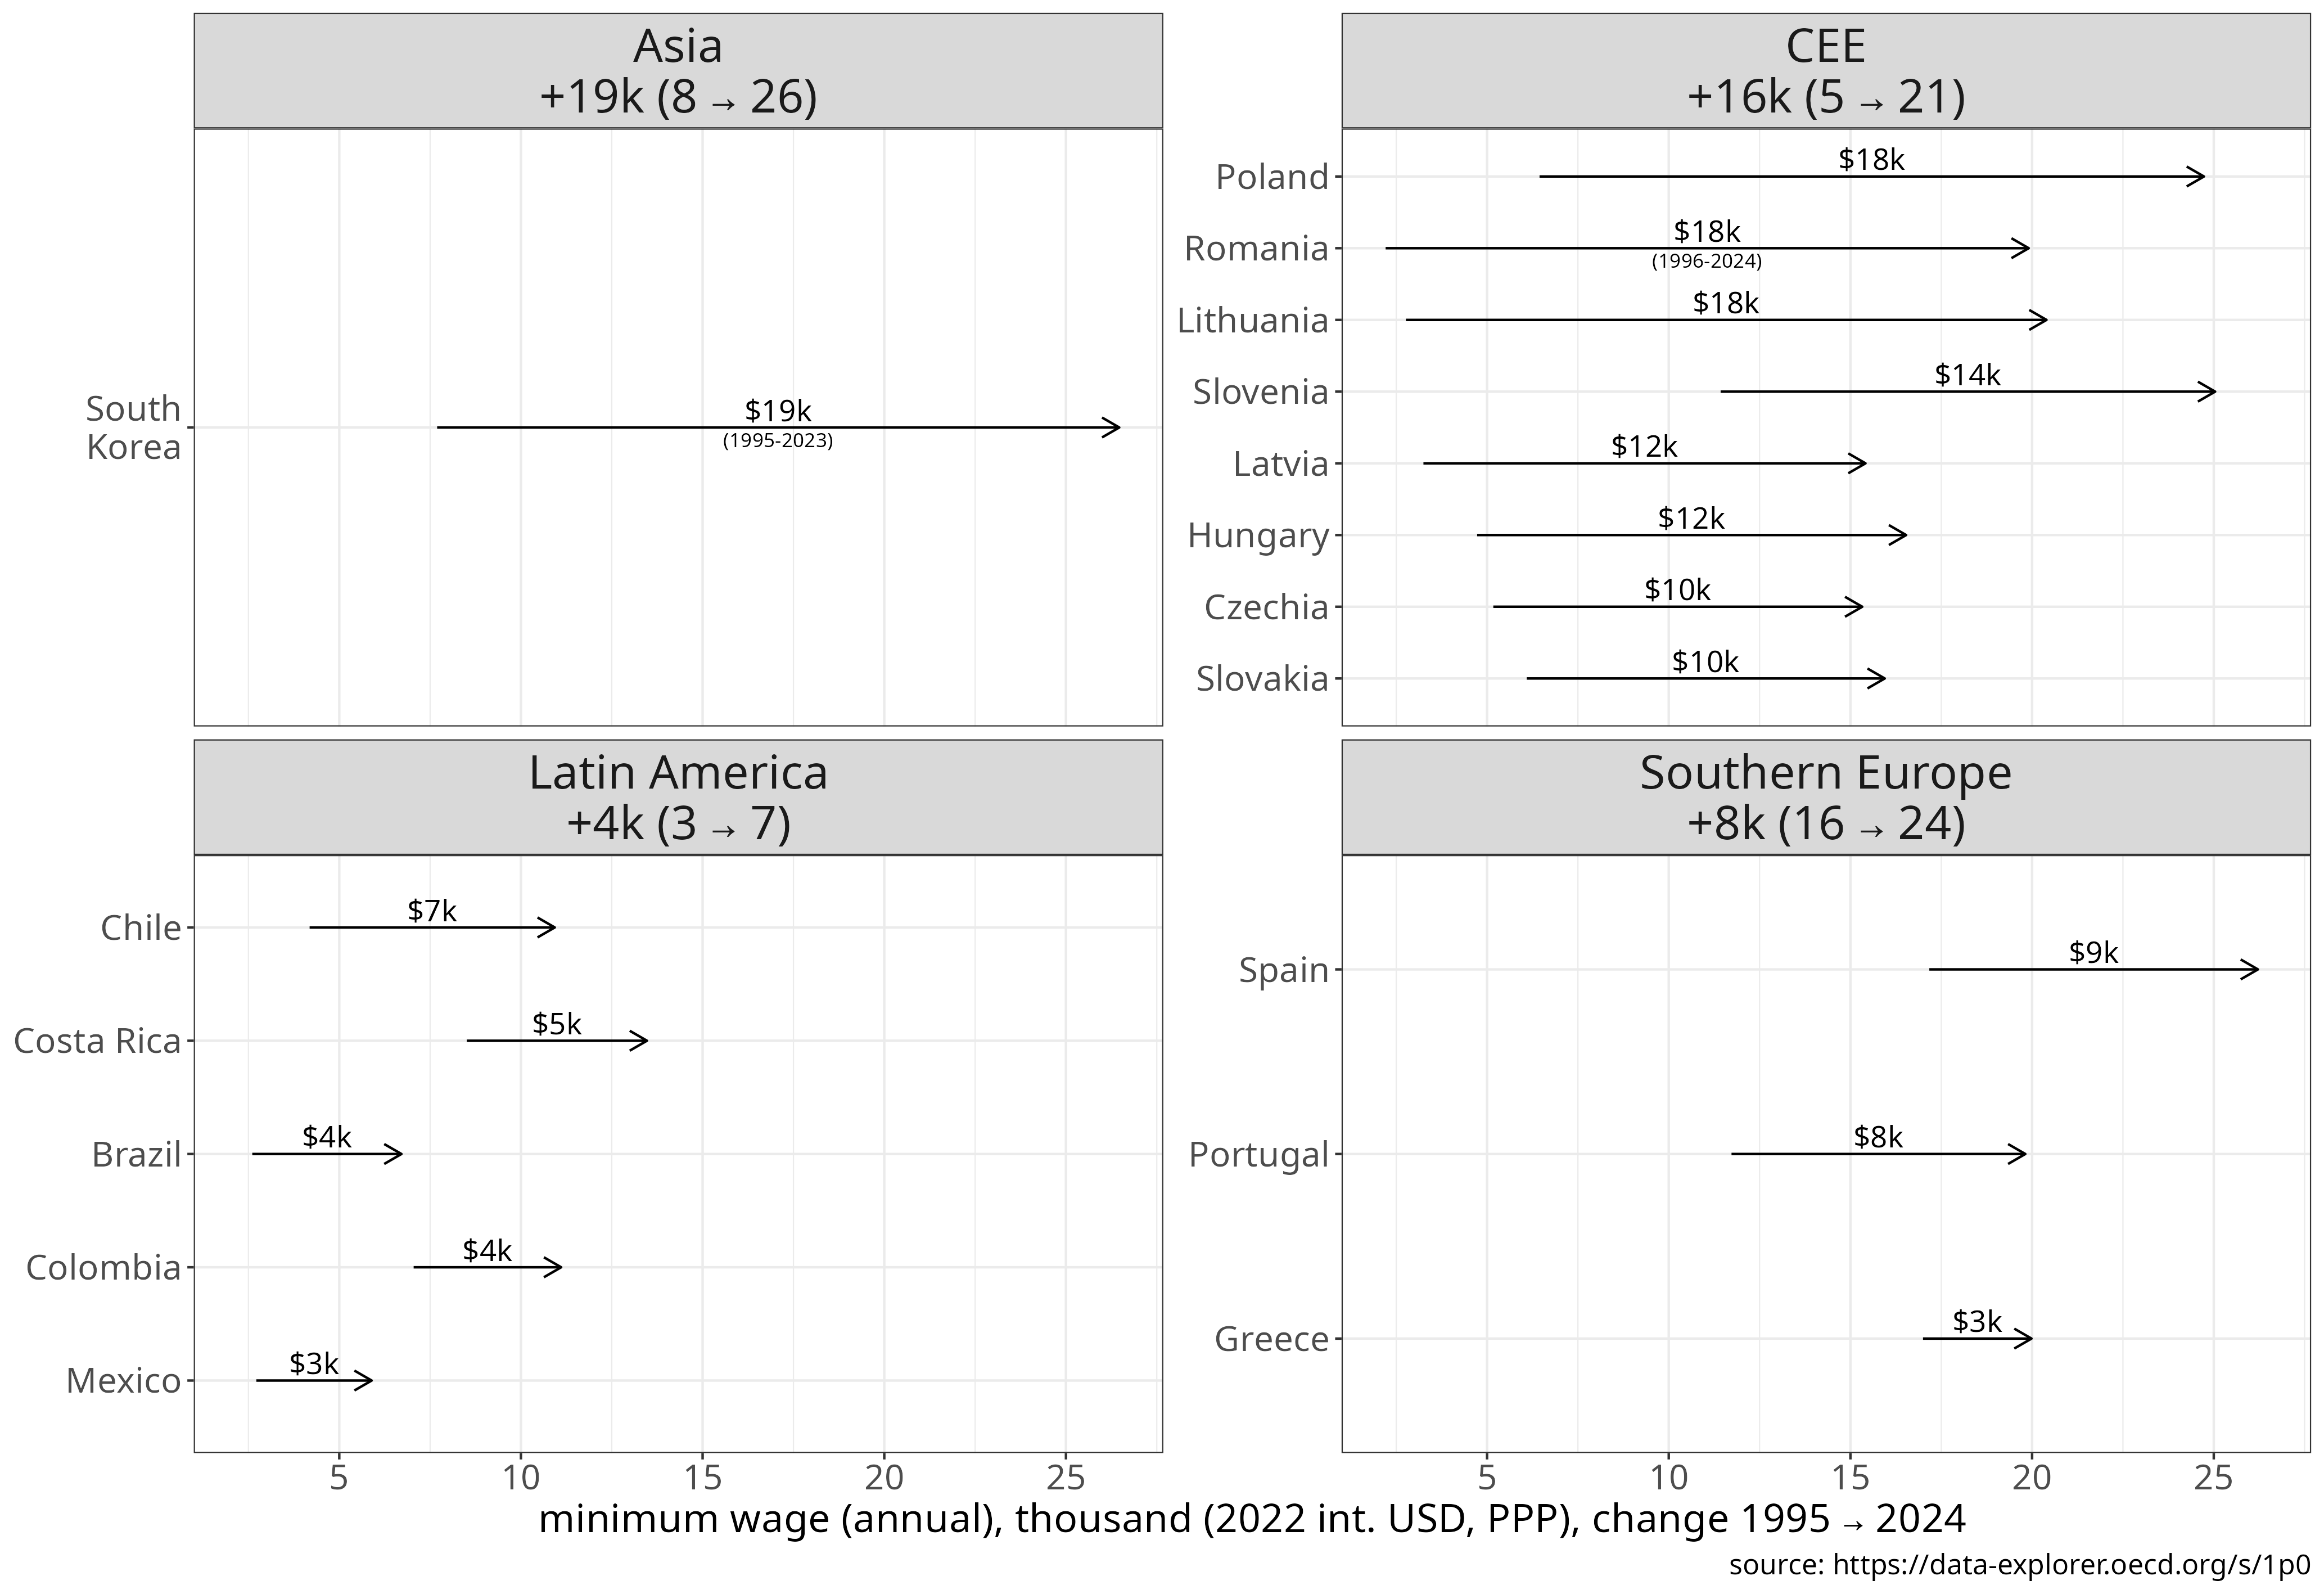
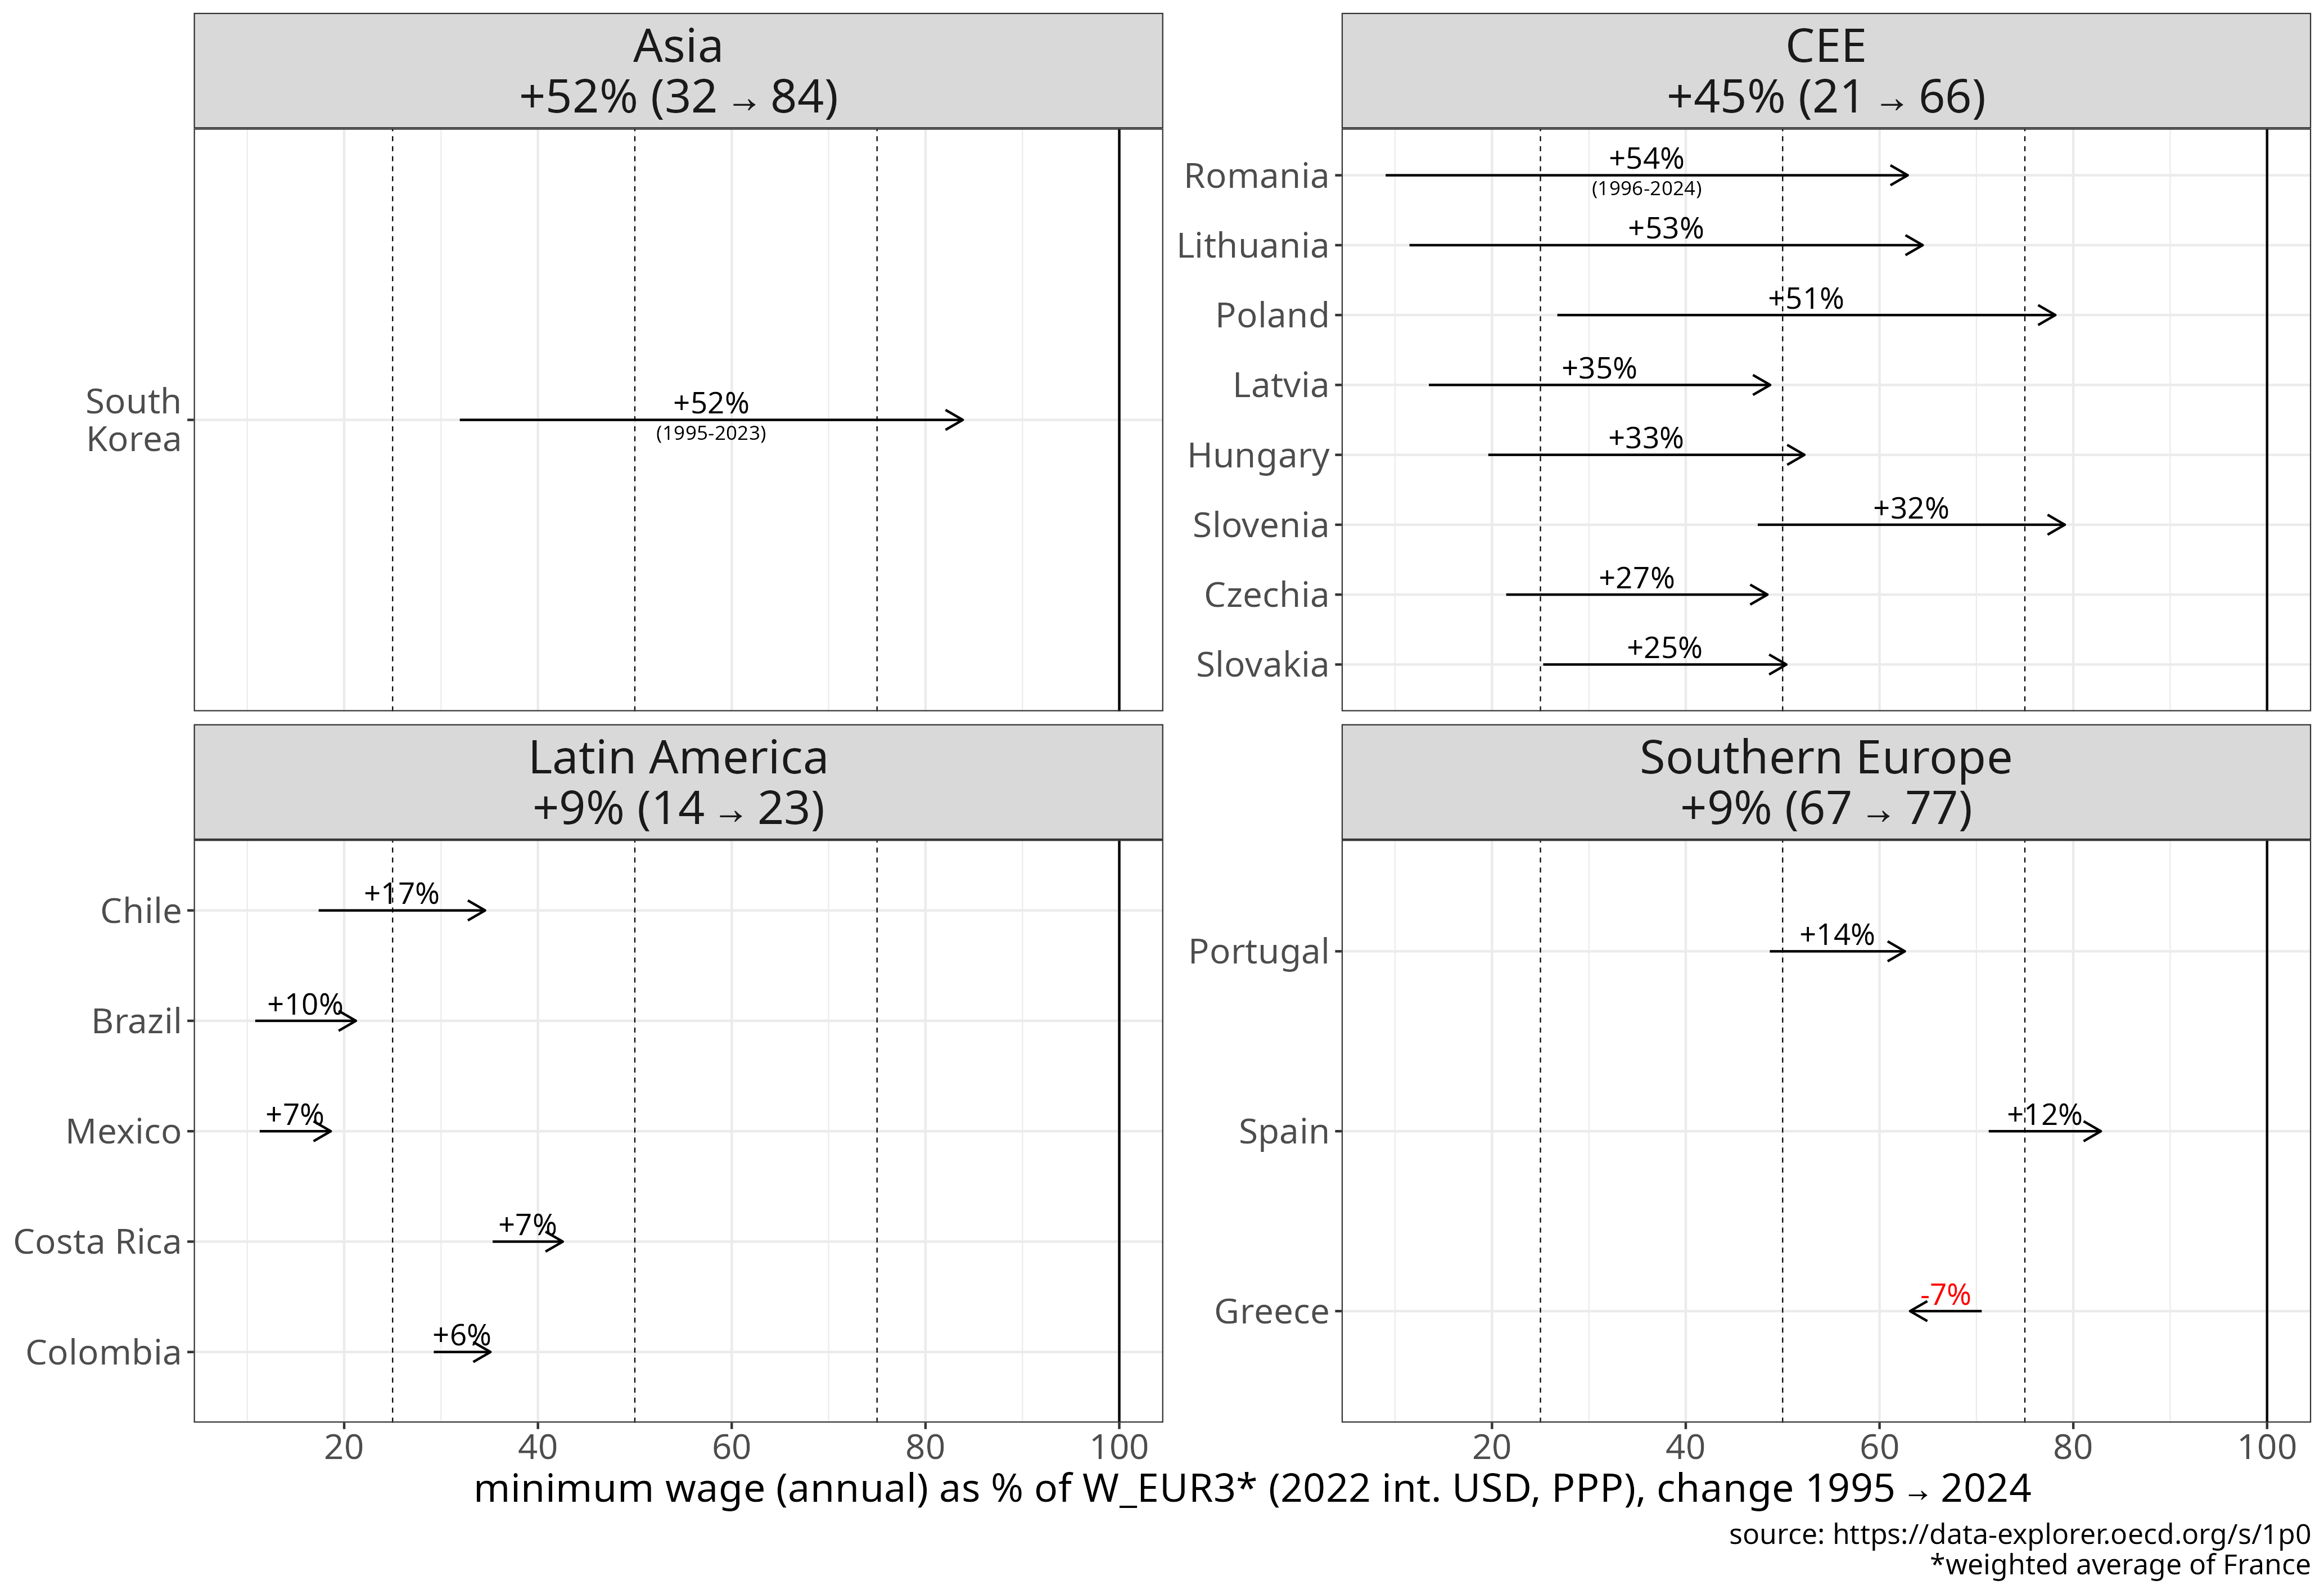
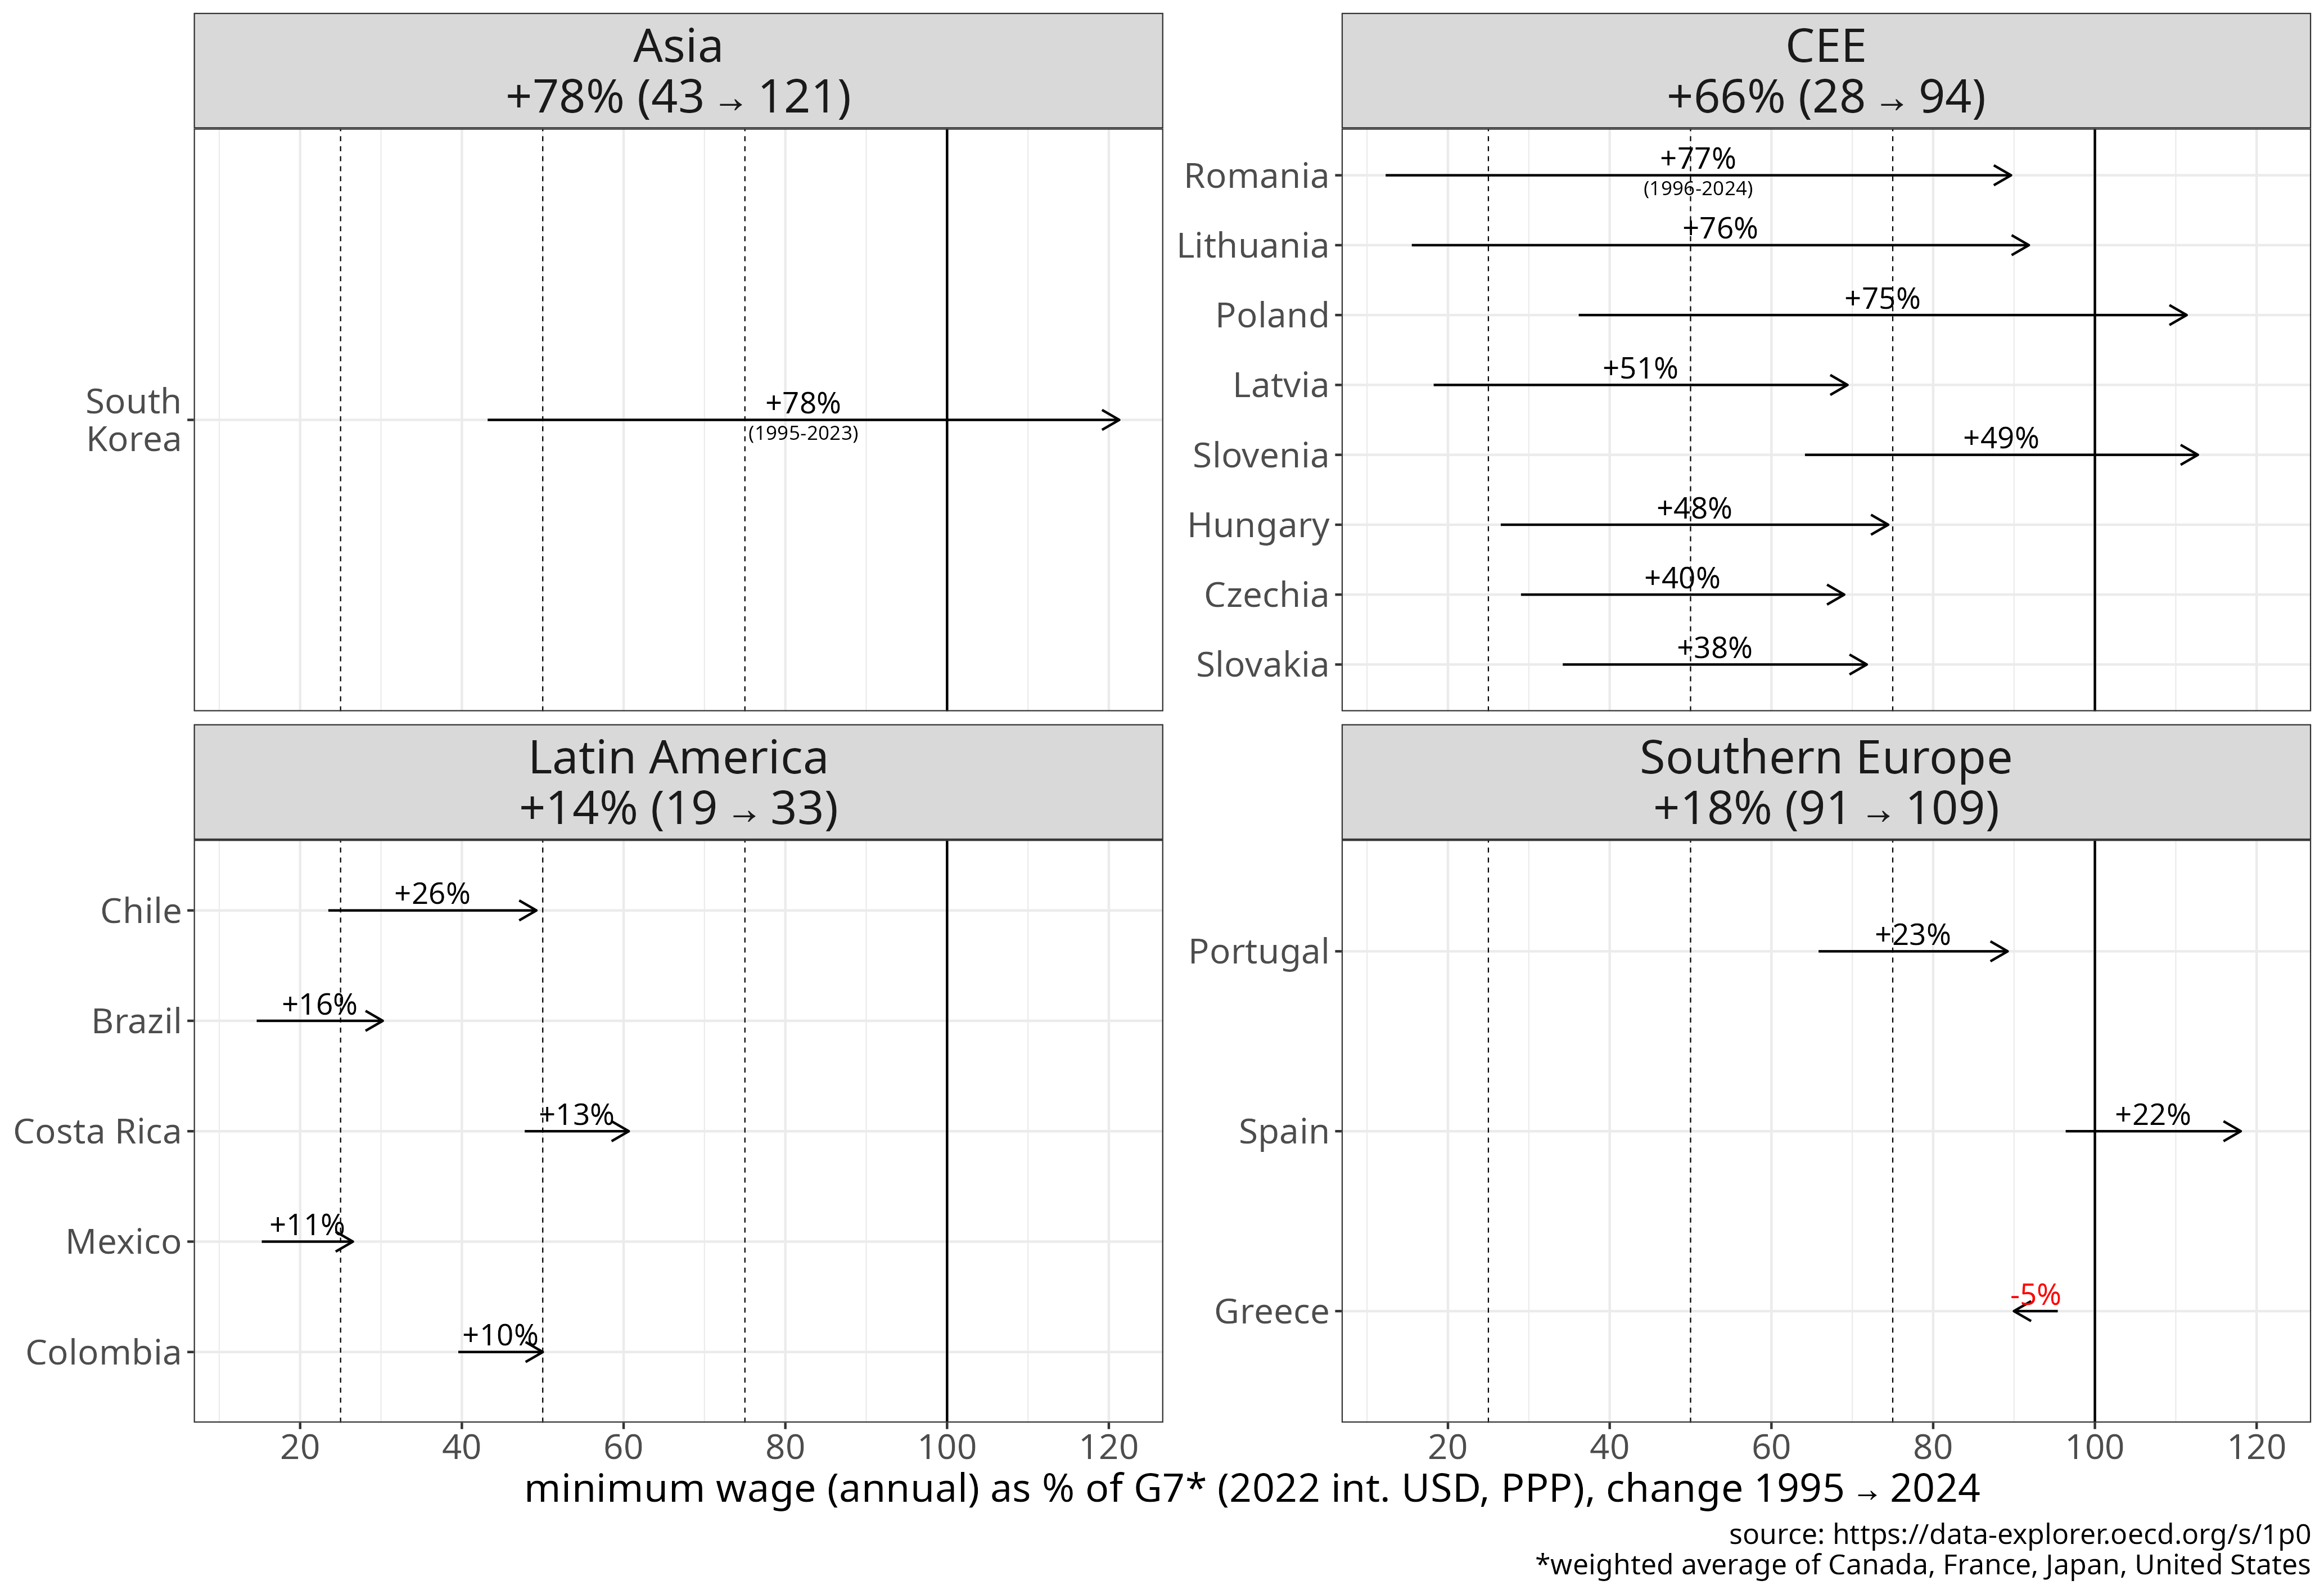
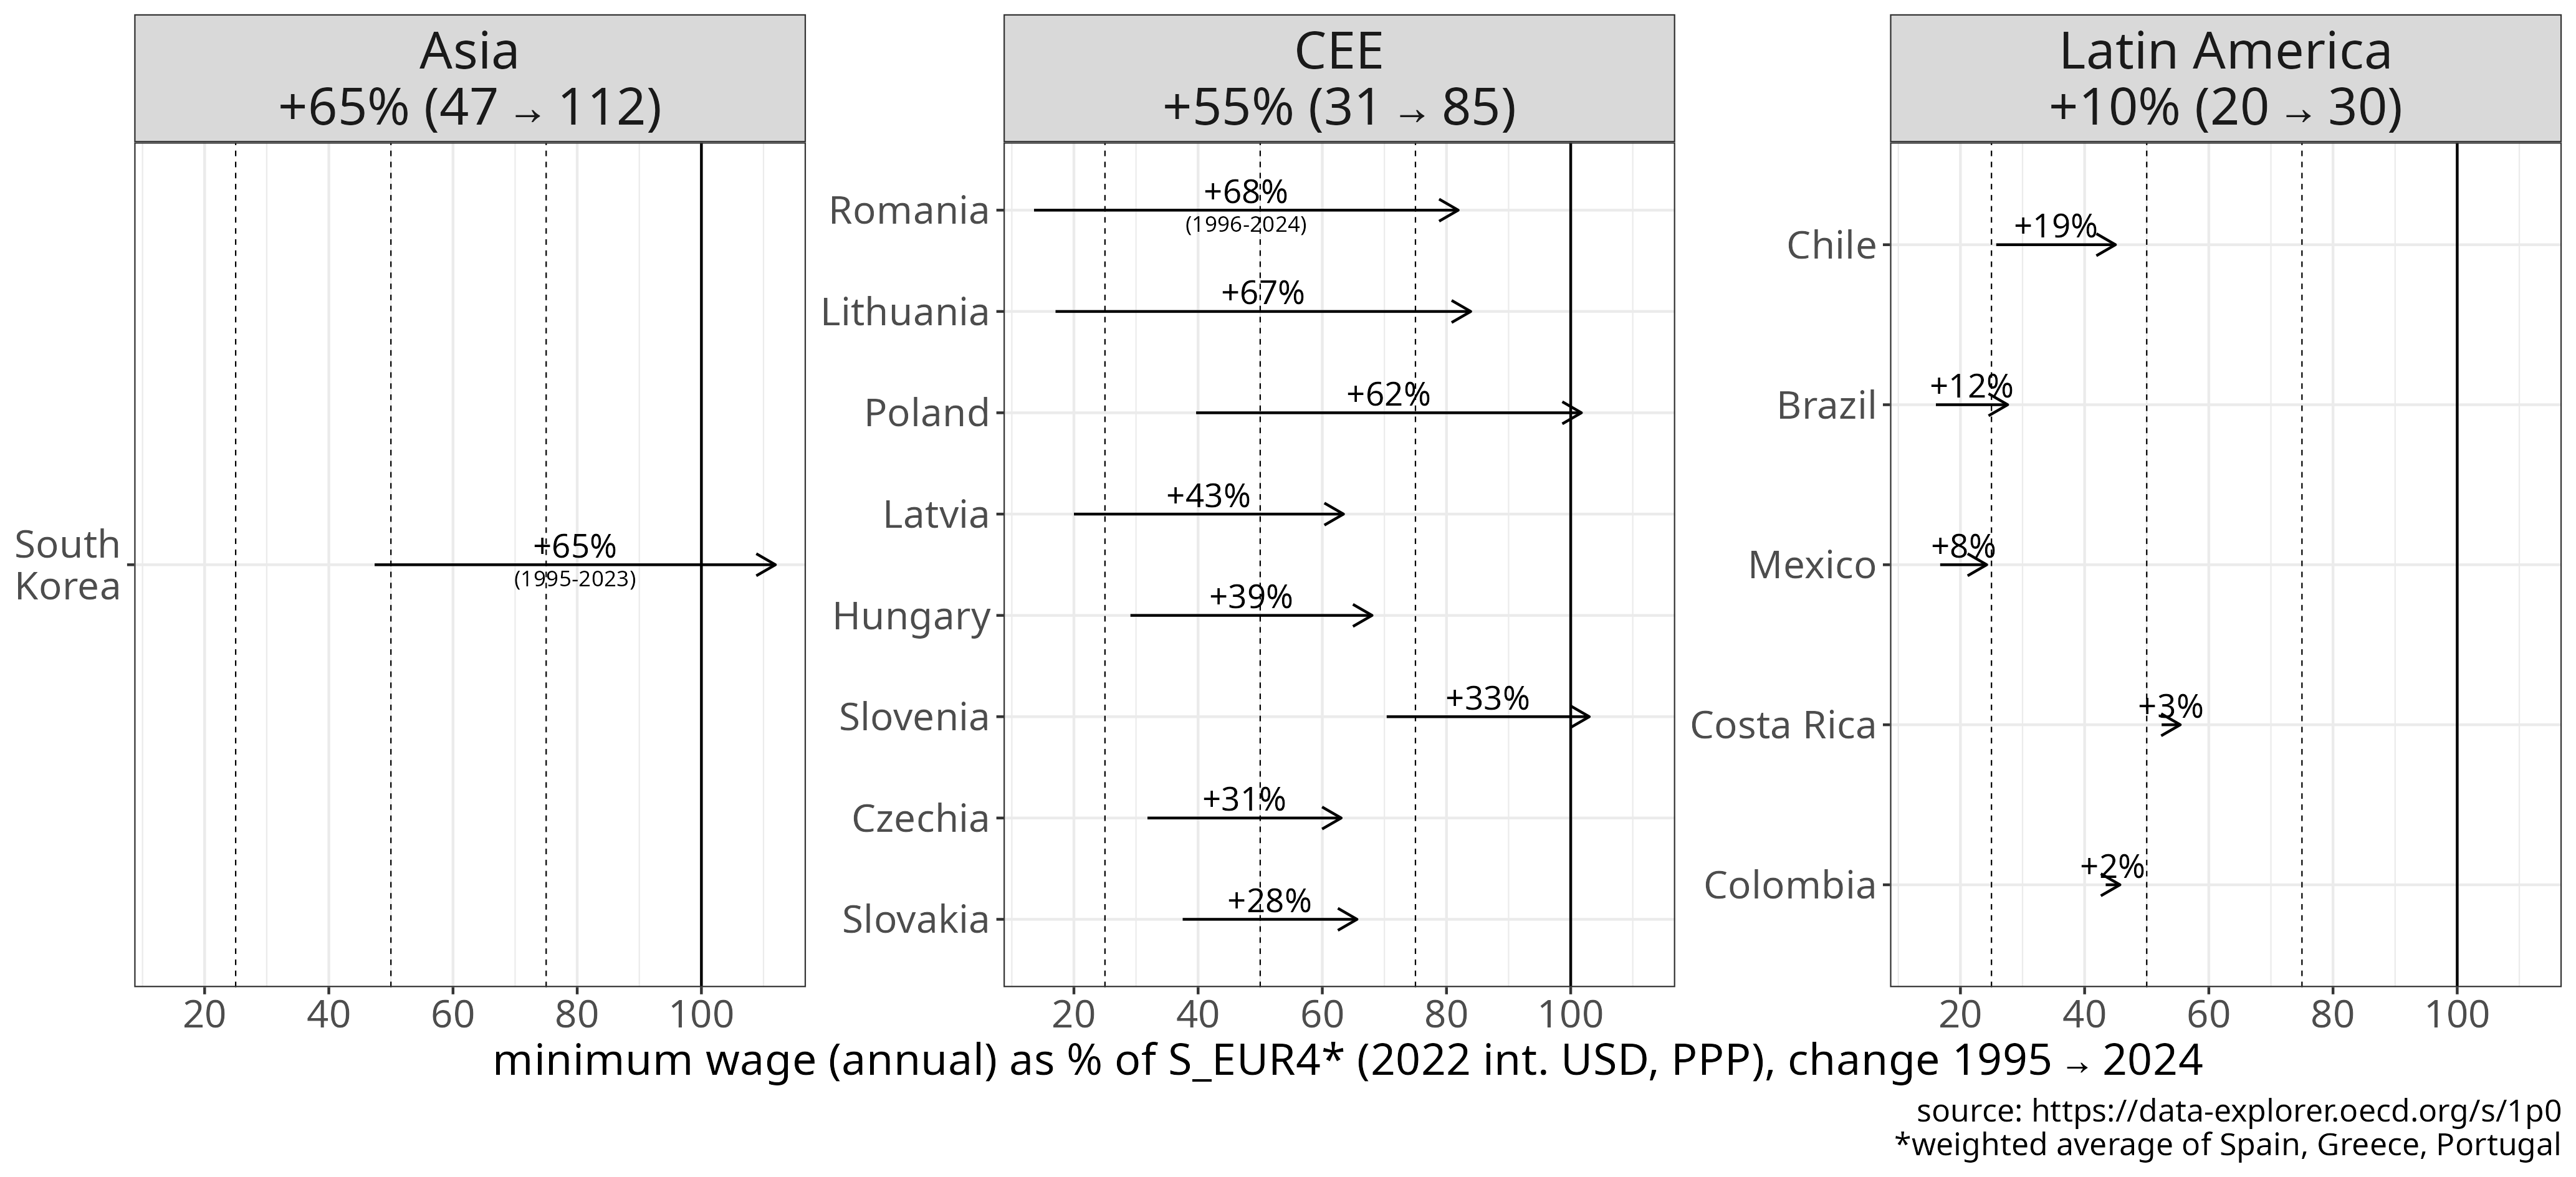
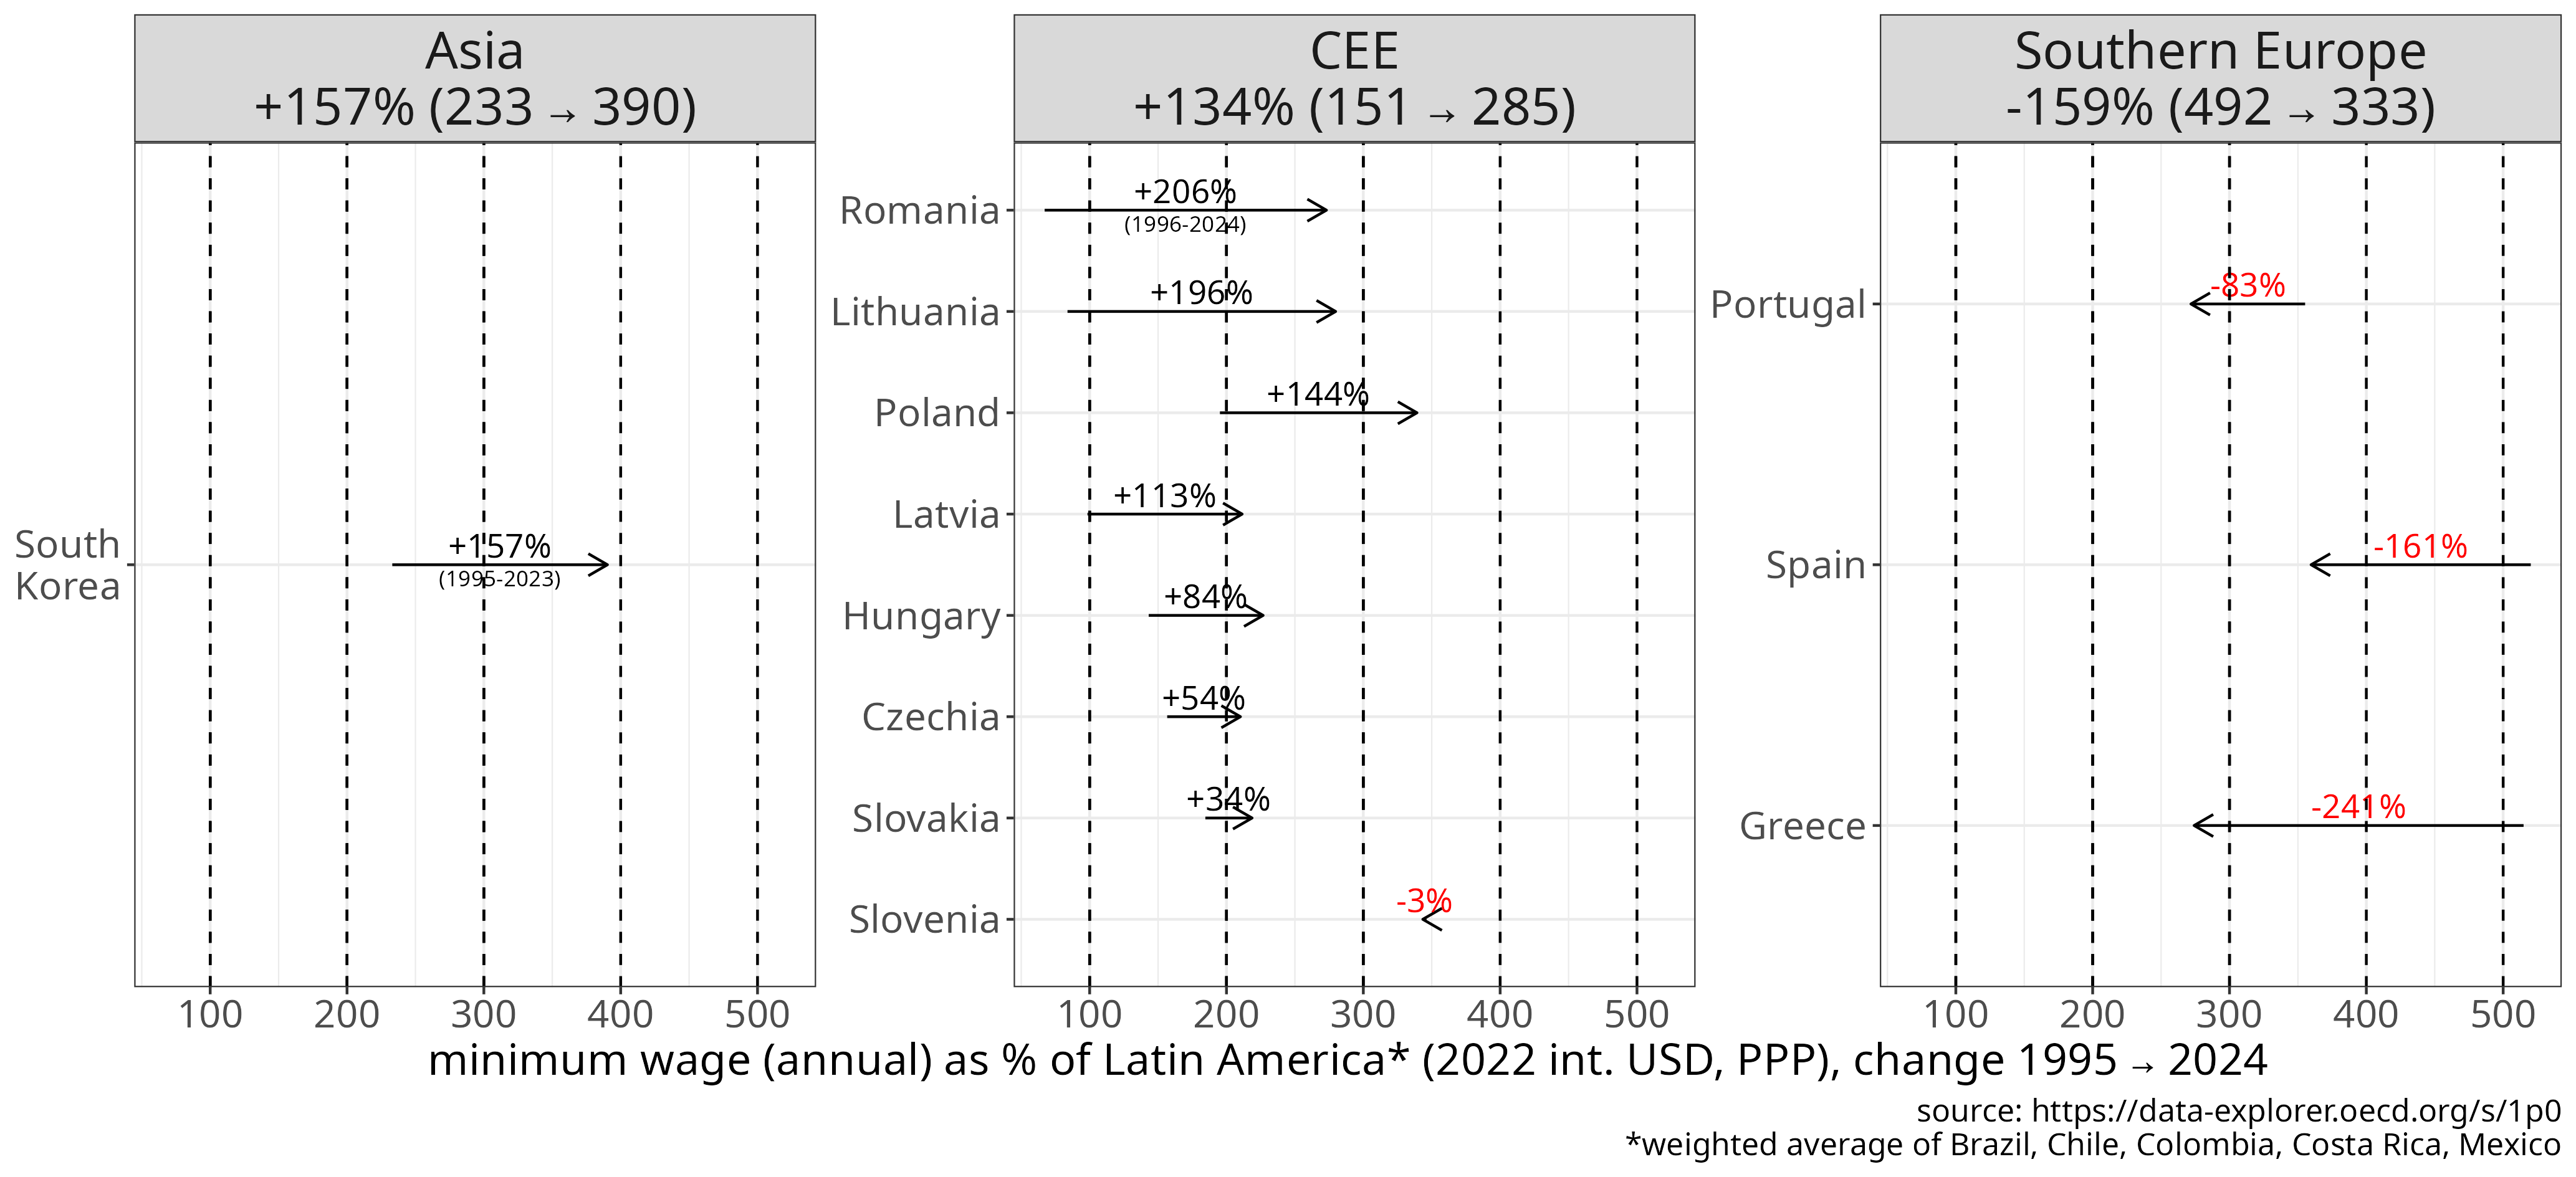
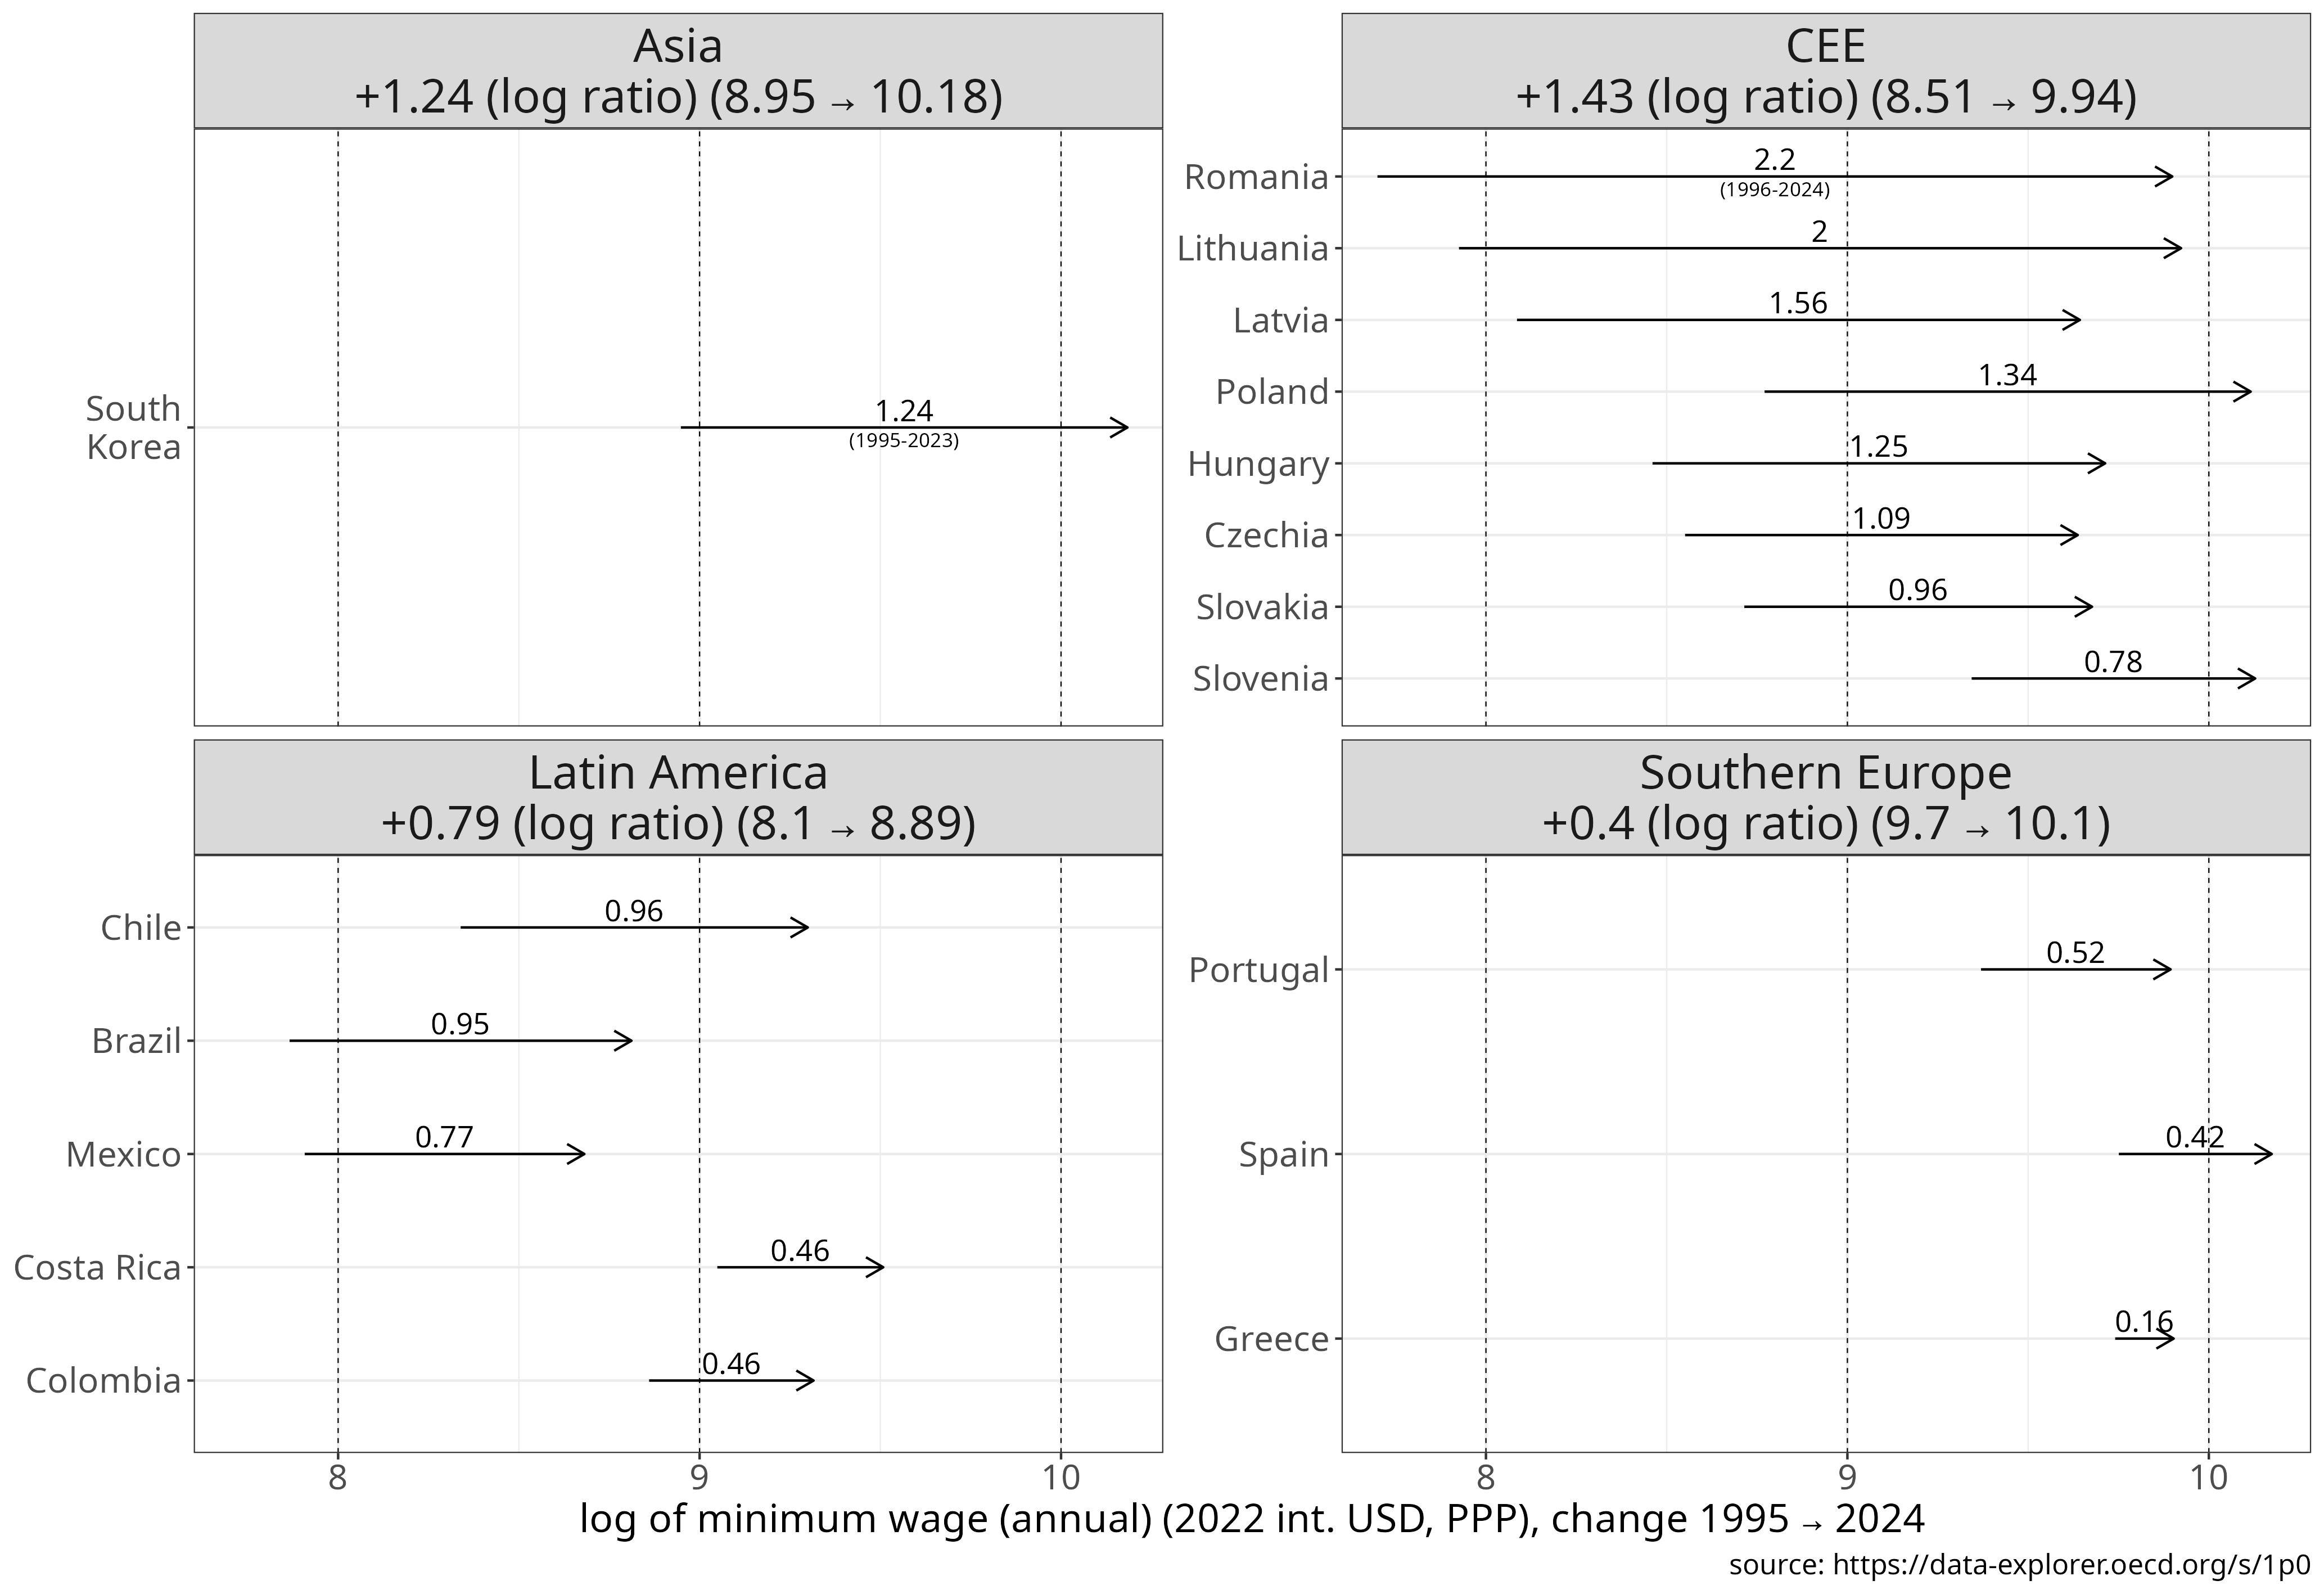
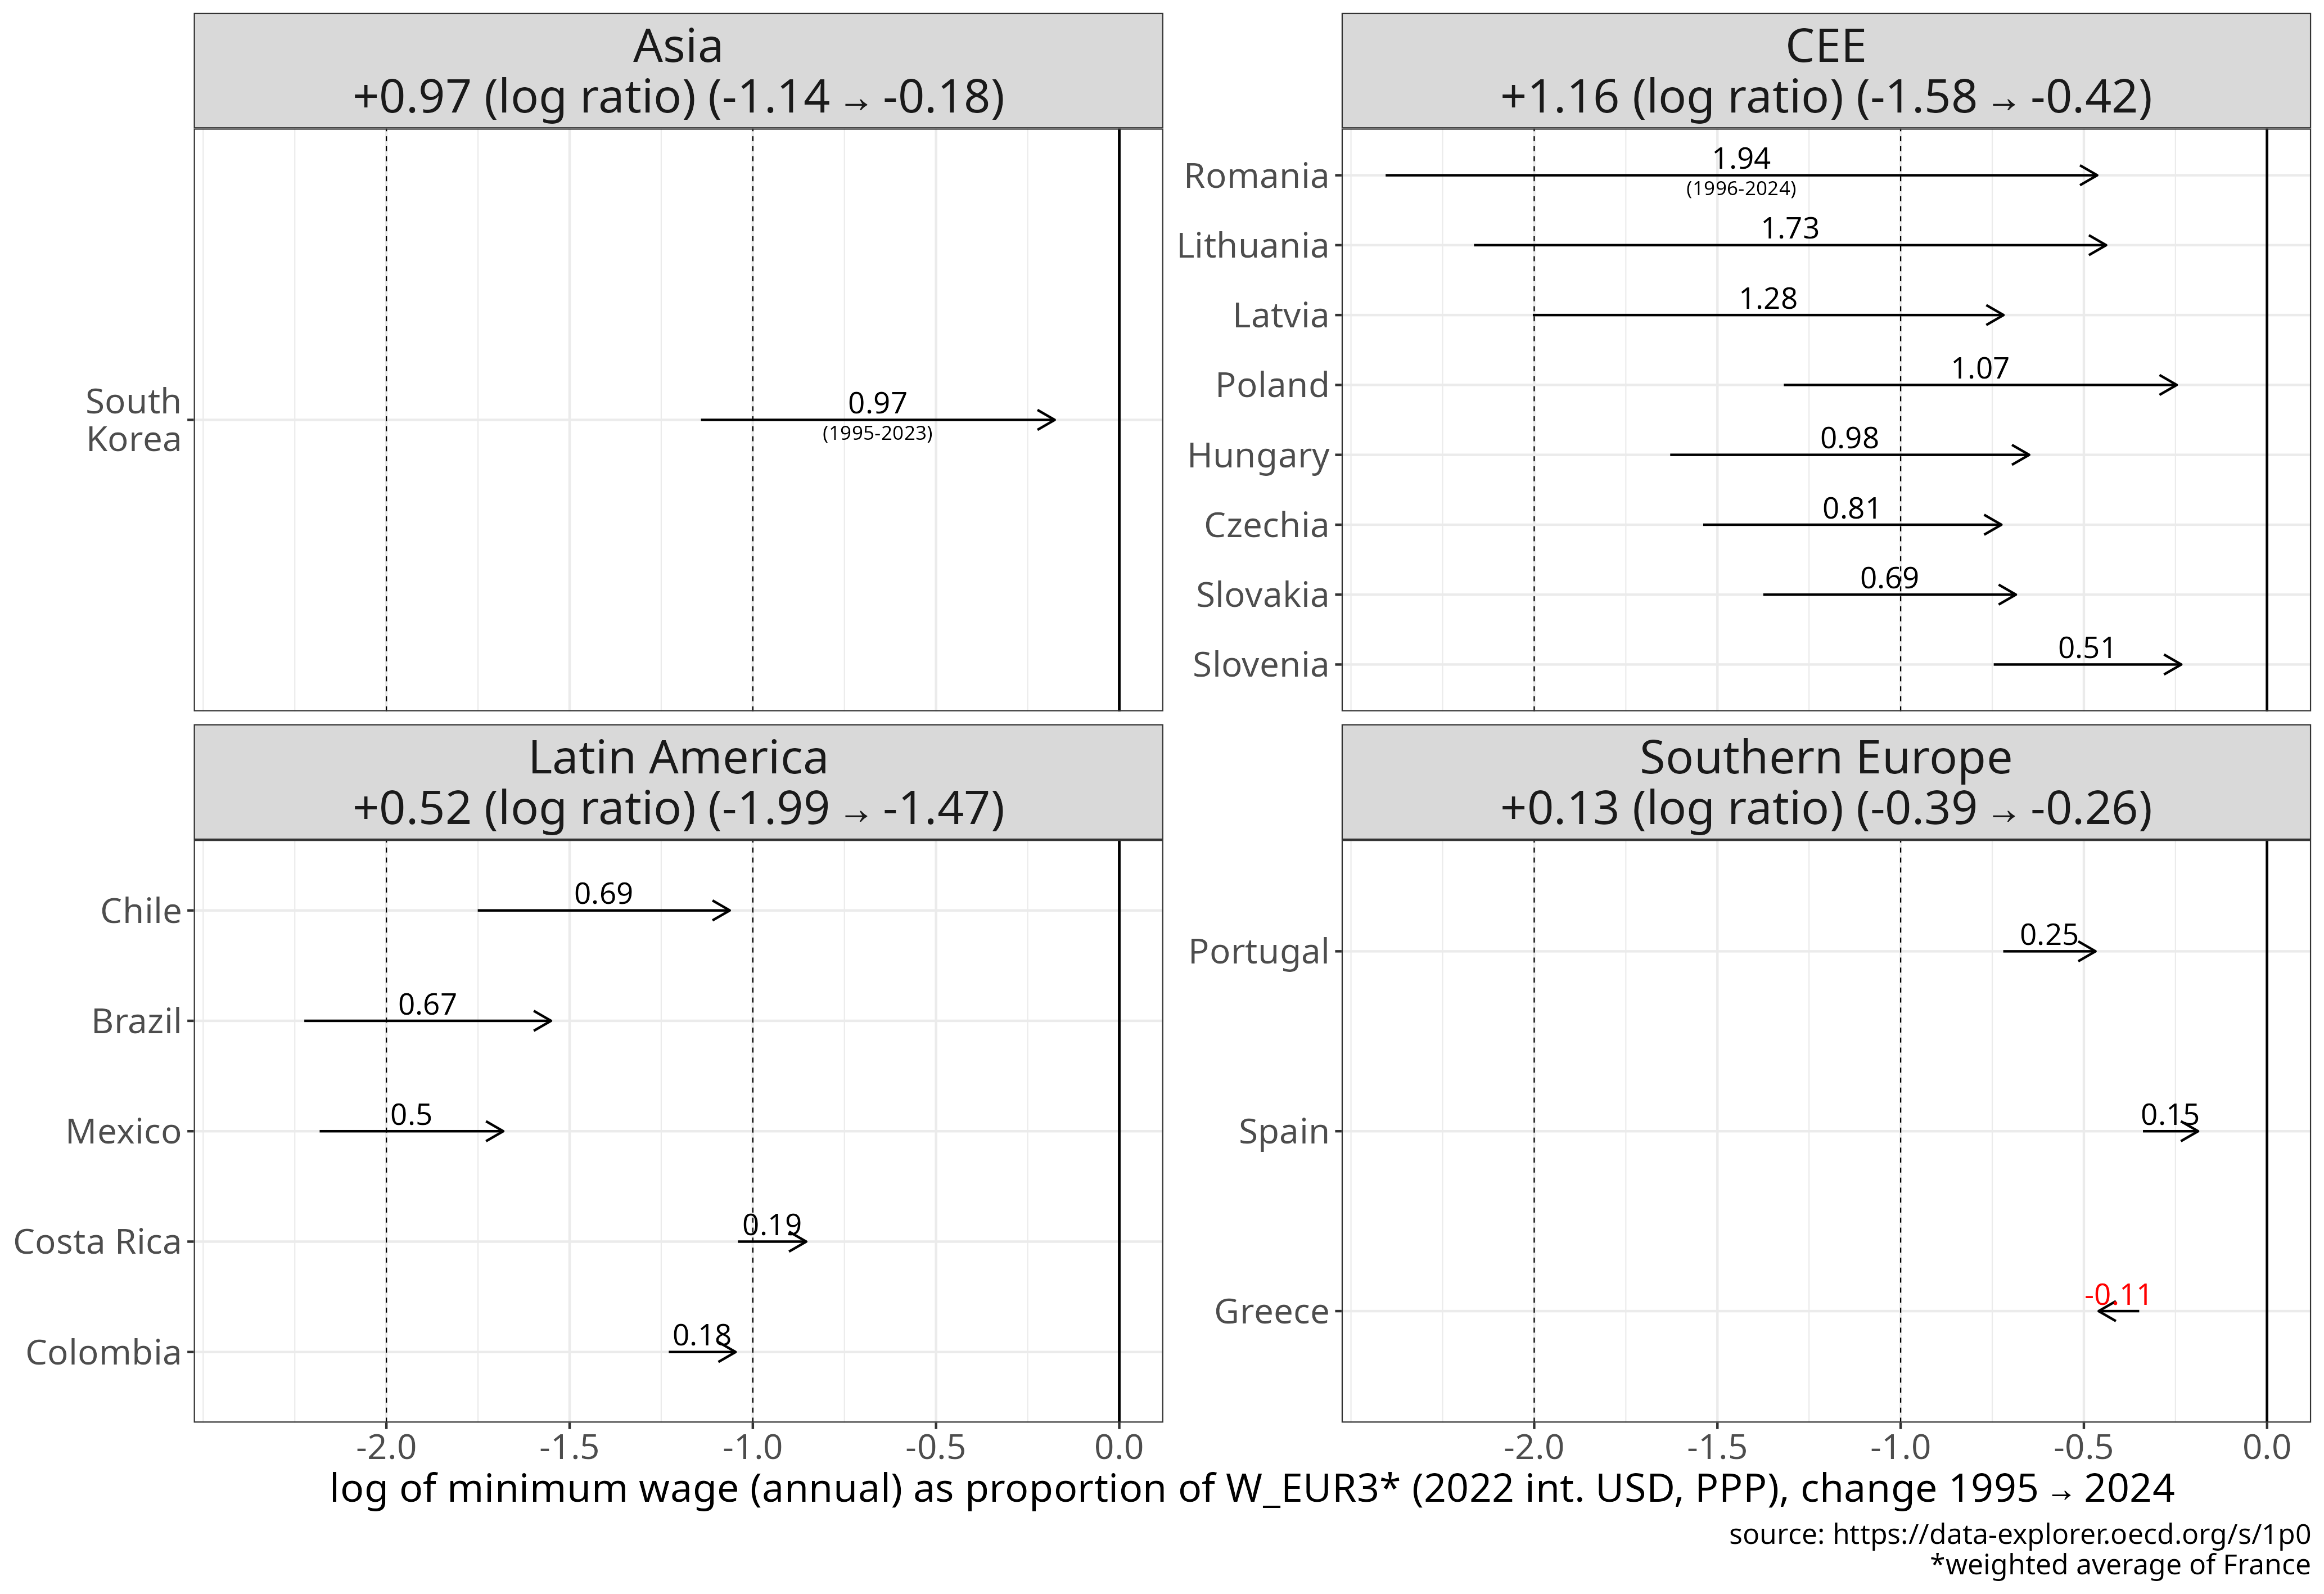

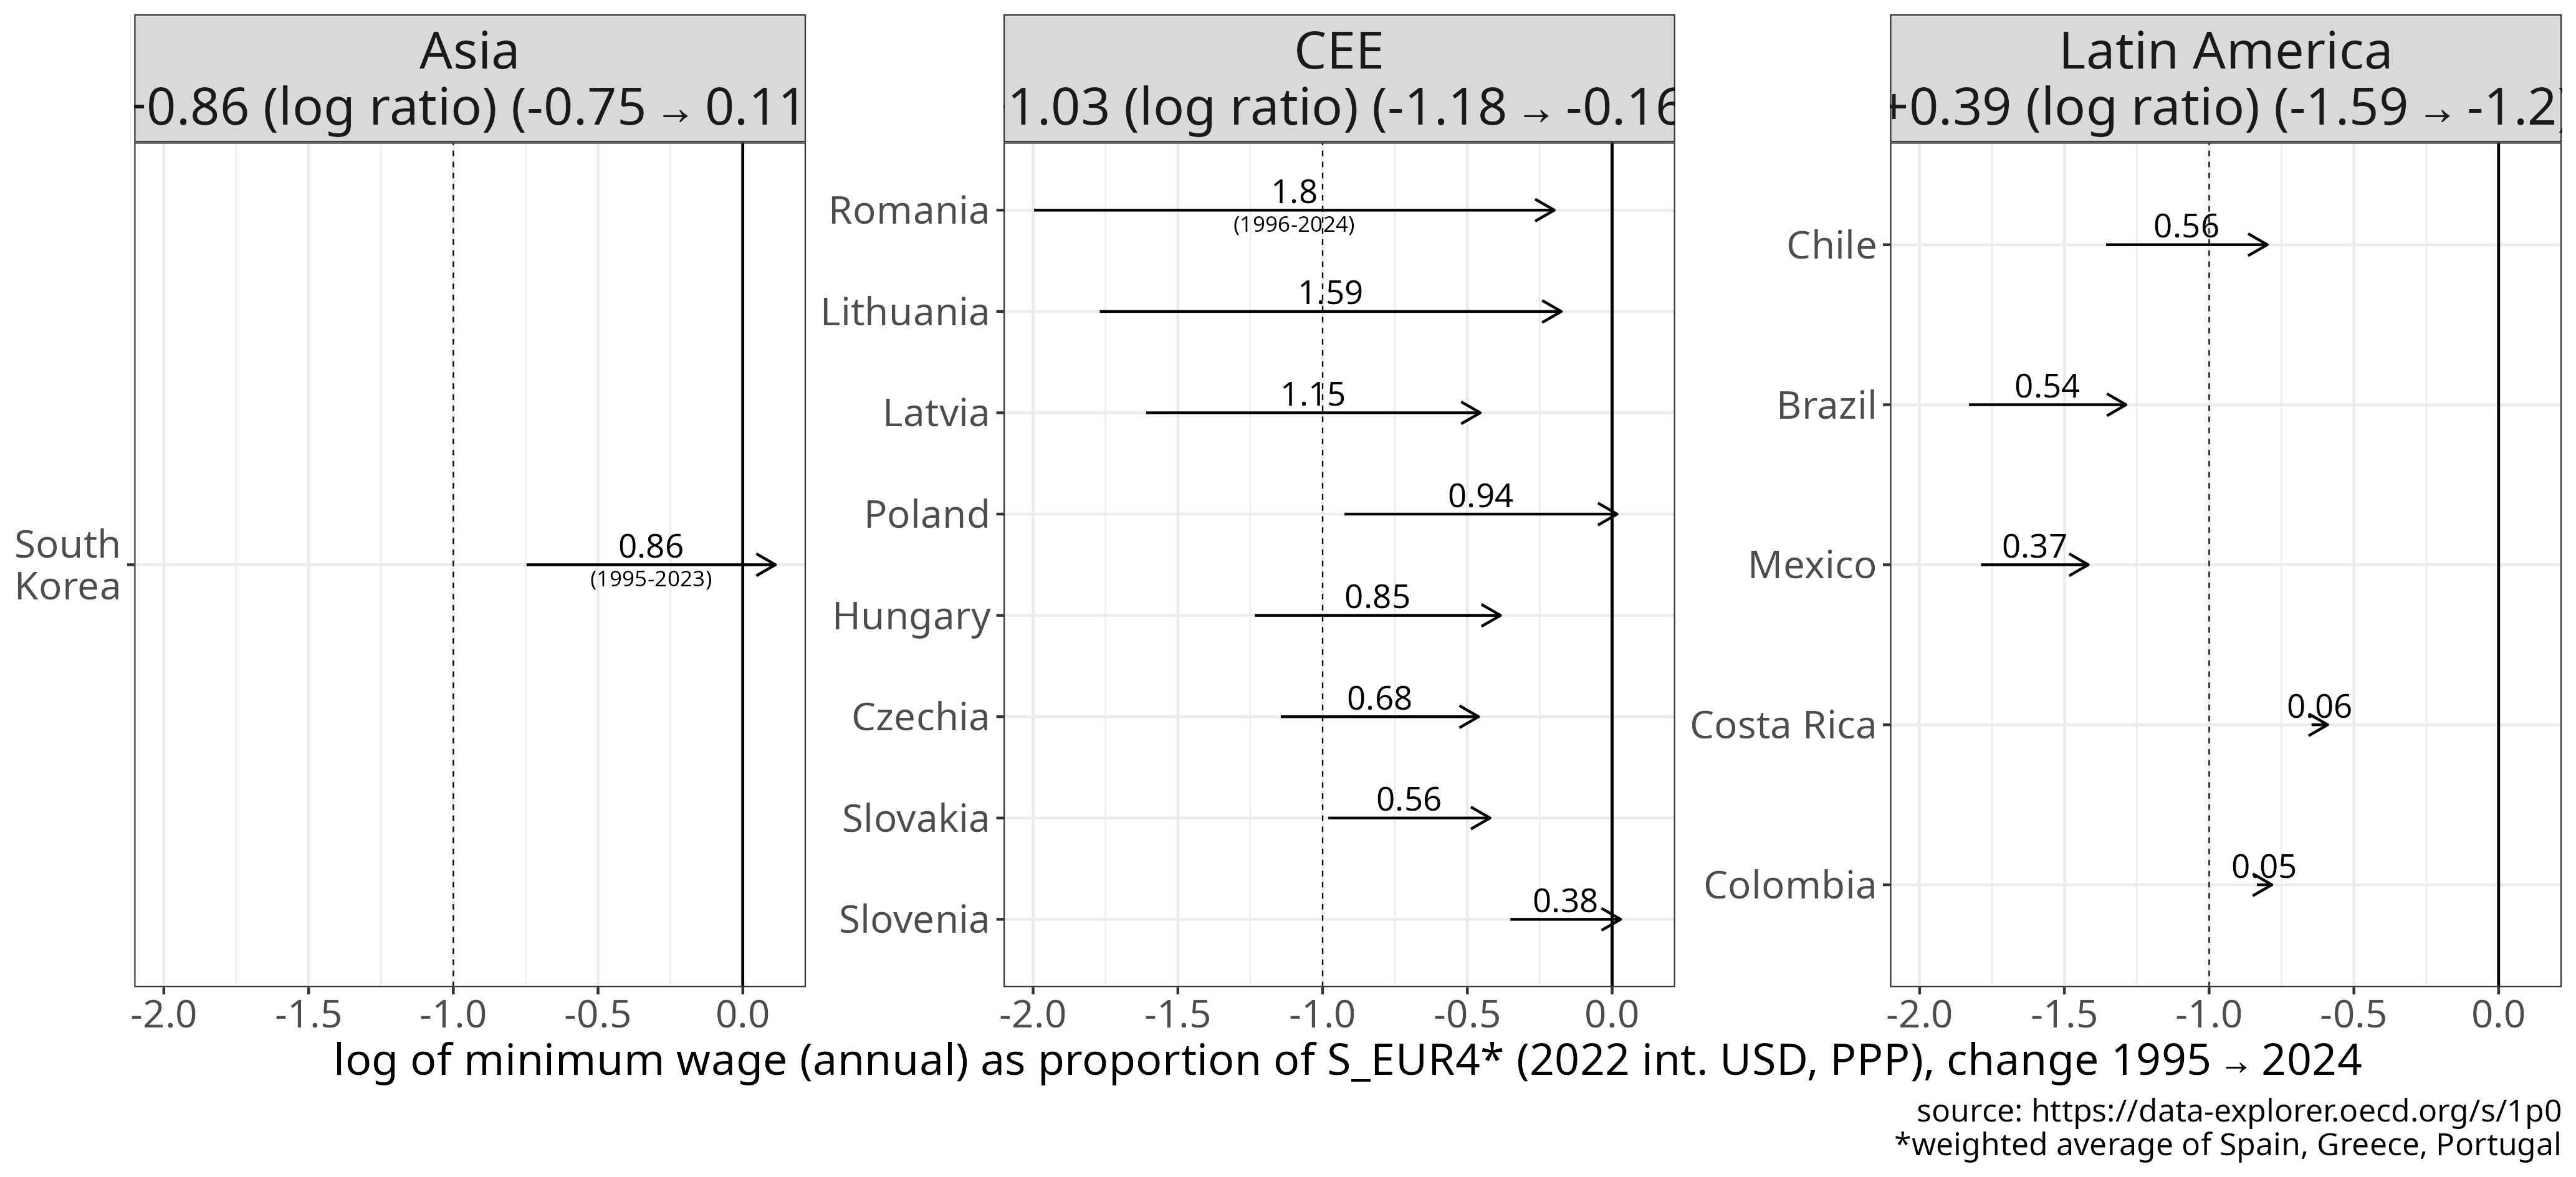
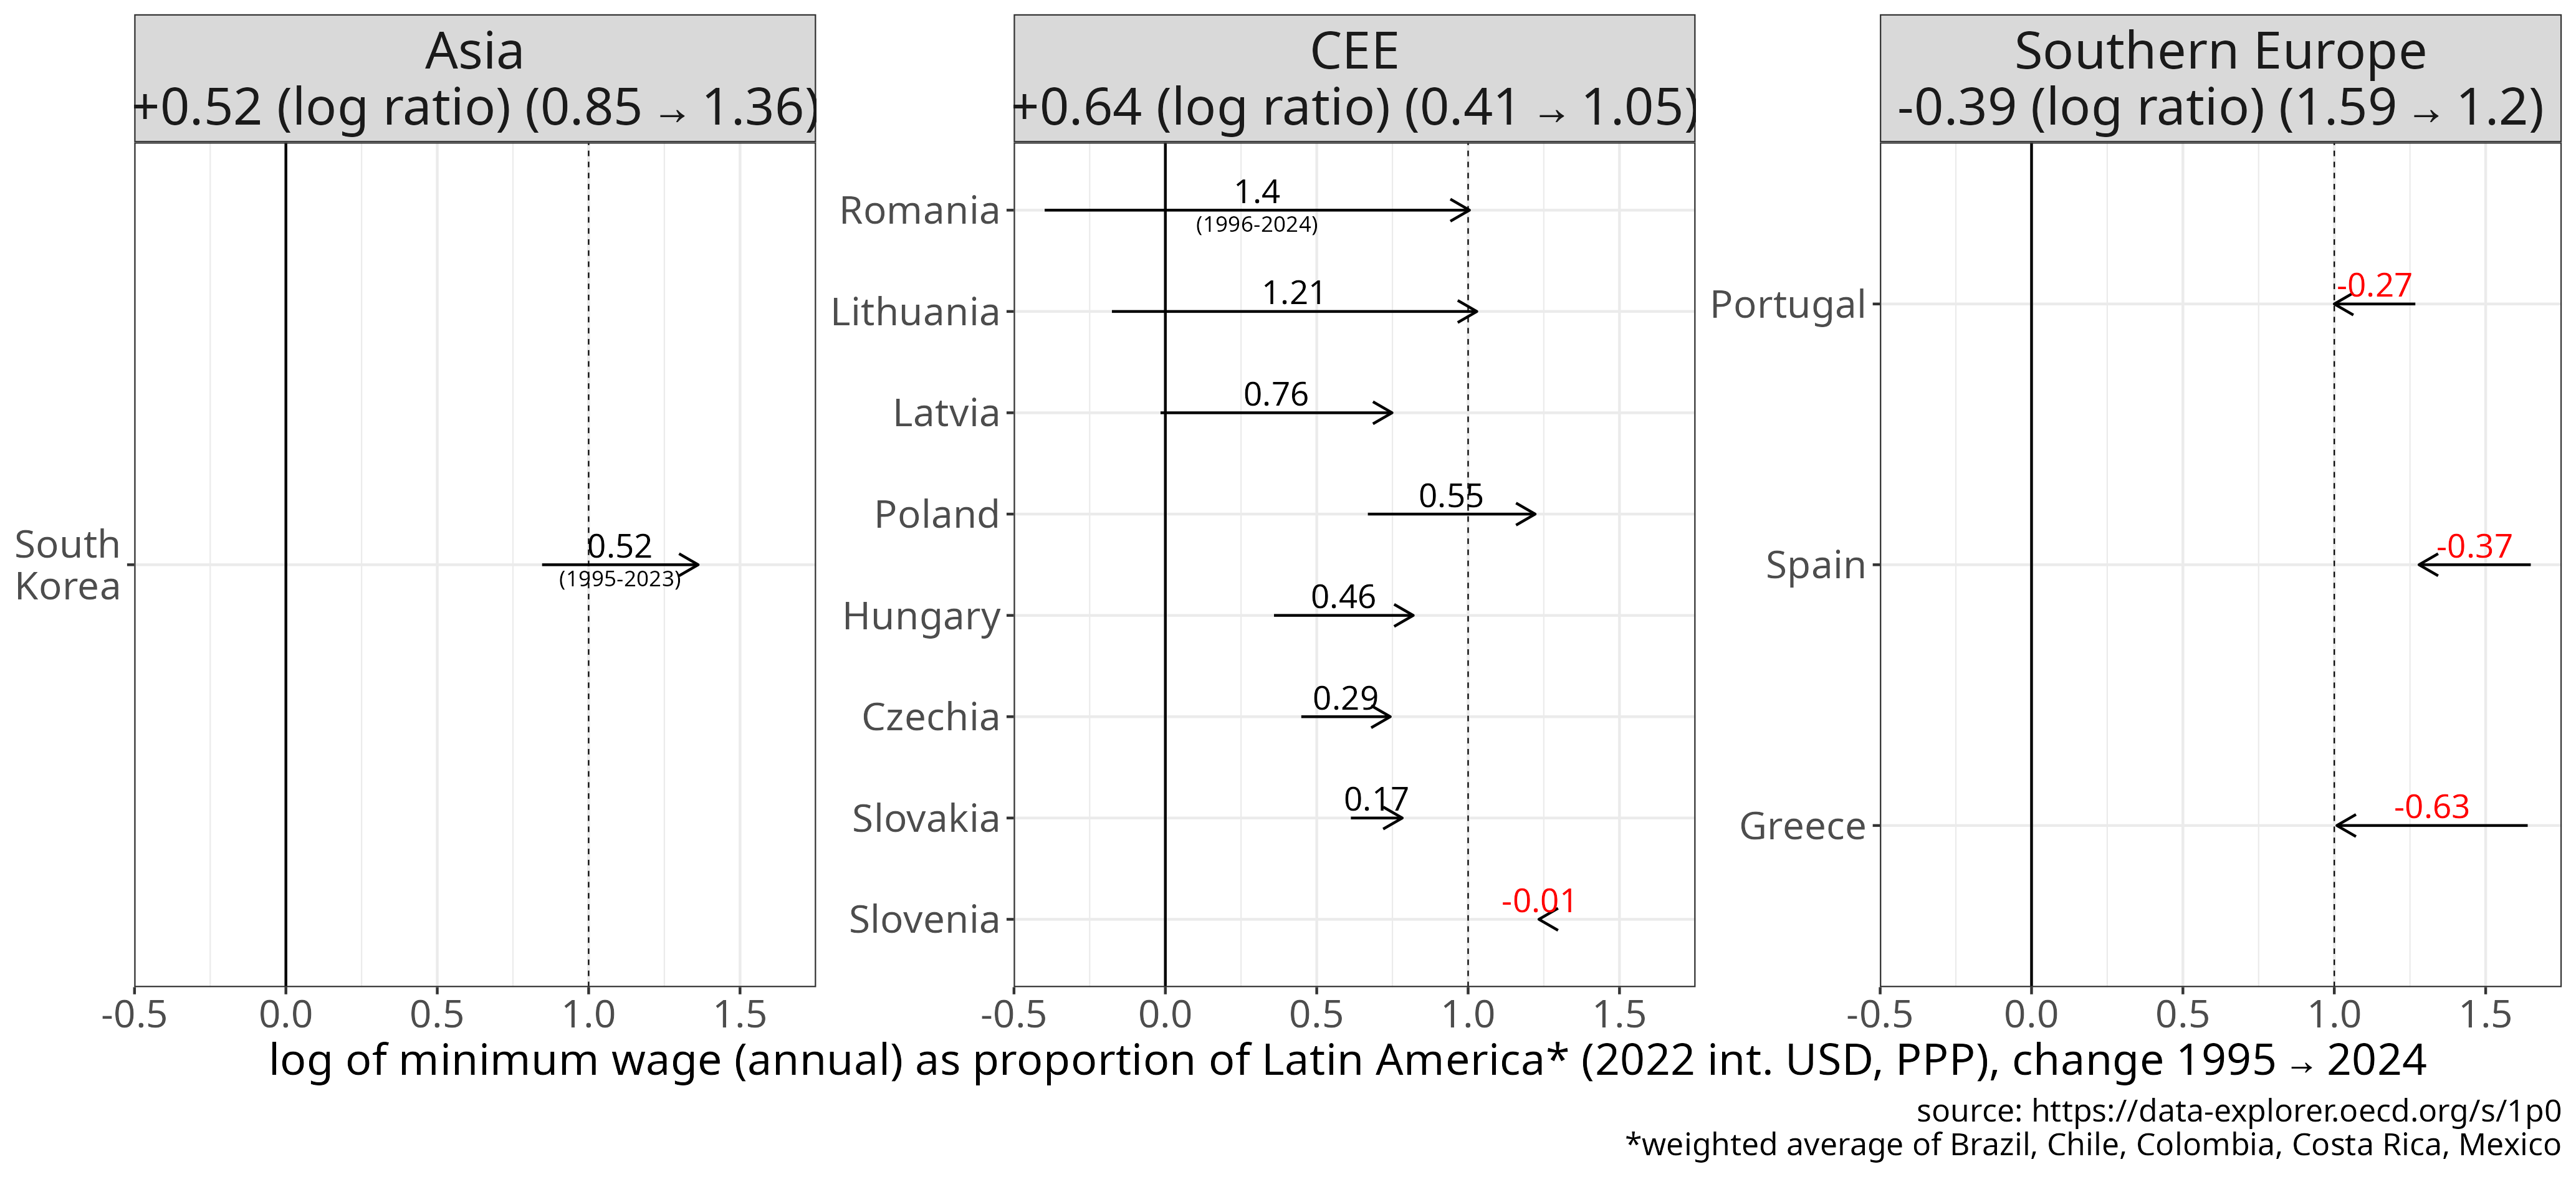
Figure 10 Change in minimum wage, by world region, from 1995 to 2024.
Units: constant USD PPP 2022, or as % of Germany, the G7, Southern Europe or Latin America. Linear scale shows the absolute difference between the end and start values (in thousand USD or in % of the benchmark value). Log scale shows the difference on a logarithmic scale.
[download plot data]
[source]
Minimum wage levels, Figure 10, show similar trends as average wages from 1995 to 2024. The only Asian economy in the OECD data set is South Korea, which showed the largest absolute increase in its minimum wage, +19k (constant 2022) USD. This is closely followed by the +16k USD increase of the CEE region’s average, which is larger (4.2x) in relative terms. In the absence of a national minimum wage in Germany, France was used as the reference point; the CEE average increased from 21% to 66% of the French level. The increase is even larger (28 to 94%) if we use the four G7 countries as a benchmark where data is available, however this is to a large extent due to a very low national minimum wage in the US, that does not reflect well median US wage levels. Compared with Latin America, the average CEE minimum wage rose from about 1.5x (151%) of the Latin American level to nearly 3x (285%), a widening gap even larger than that observed for average wages or GDP/GNI per capita.
Median hourly earnings
When income inequality is high, average earnings can be 25-50% higher than the median, so the median reflects better what a typical wage earner actually earns. Eurostat publishes median hourly earnings data since 2006 every four years, using its own purchasing power standards (PPS). This is a metric that adjusts for price differences across countries, so that 1 PPS would buy the same amount of goods in any two countries. It is also adjusted for price changes, albeit not by domestic CPI, but rather by the EU-wide price structure. This data is for Europe only, so we can only assess convergence of the CEE group (not its peer groups) to Germany, the three largest EU economies (DE, FR, IT) and Southern Europe (IT, ES, GR, PT), shown in Figure 11.
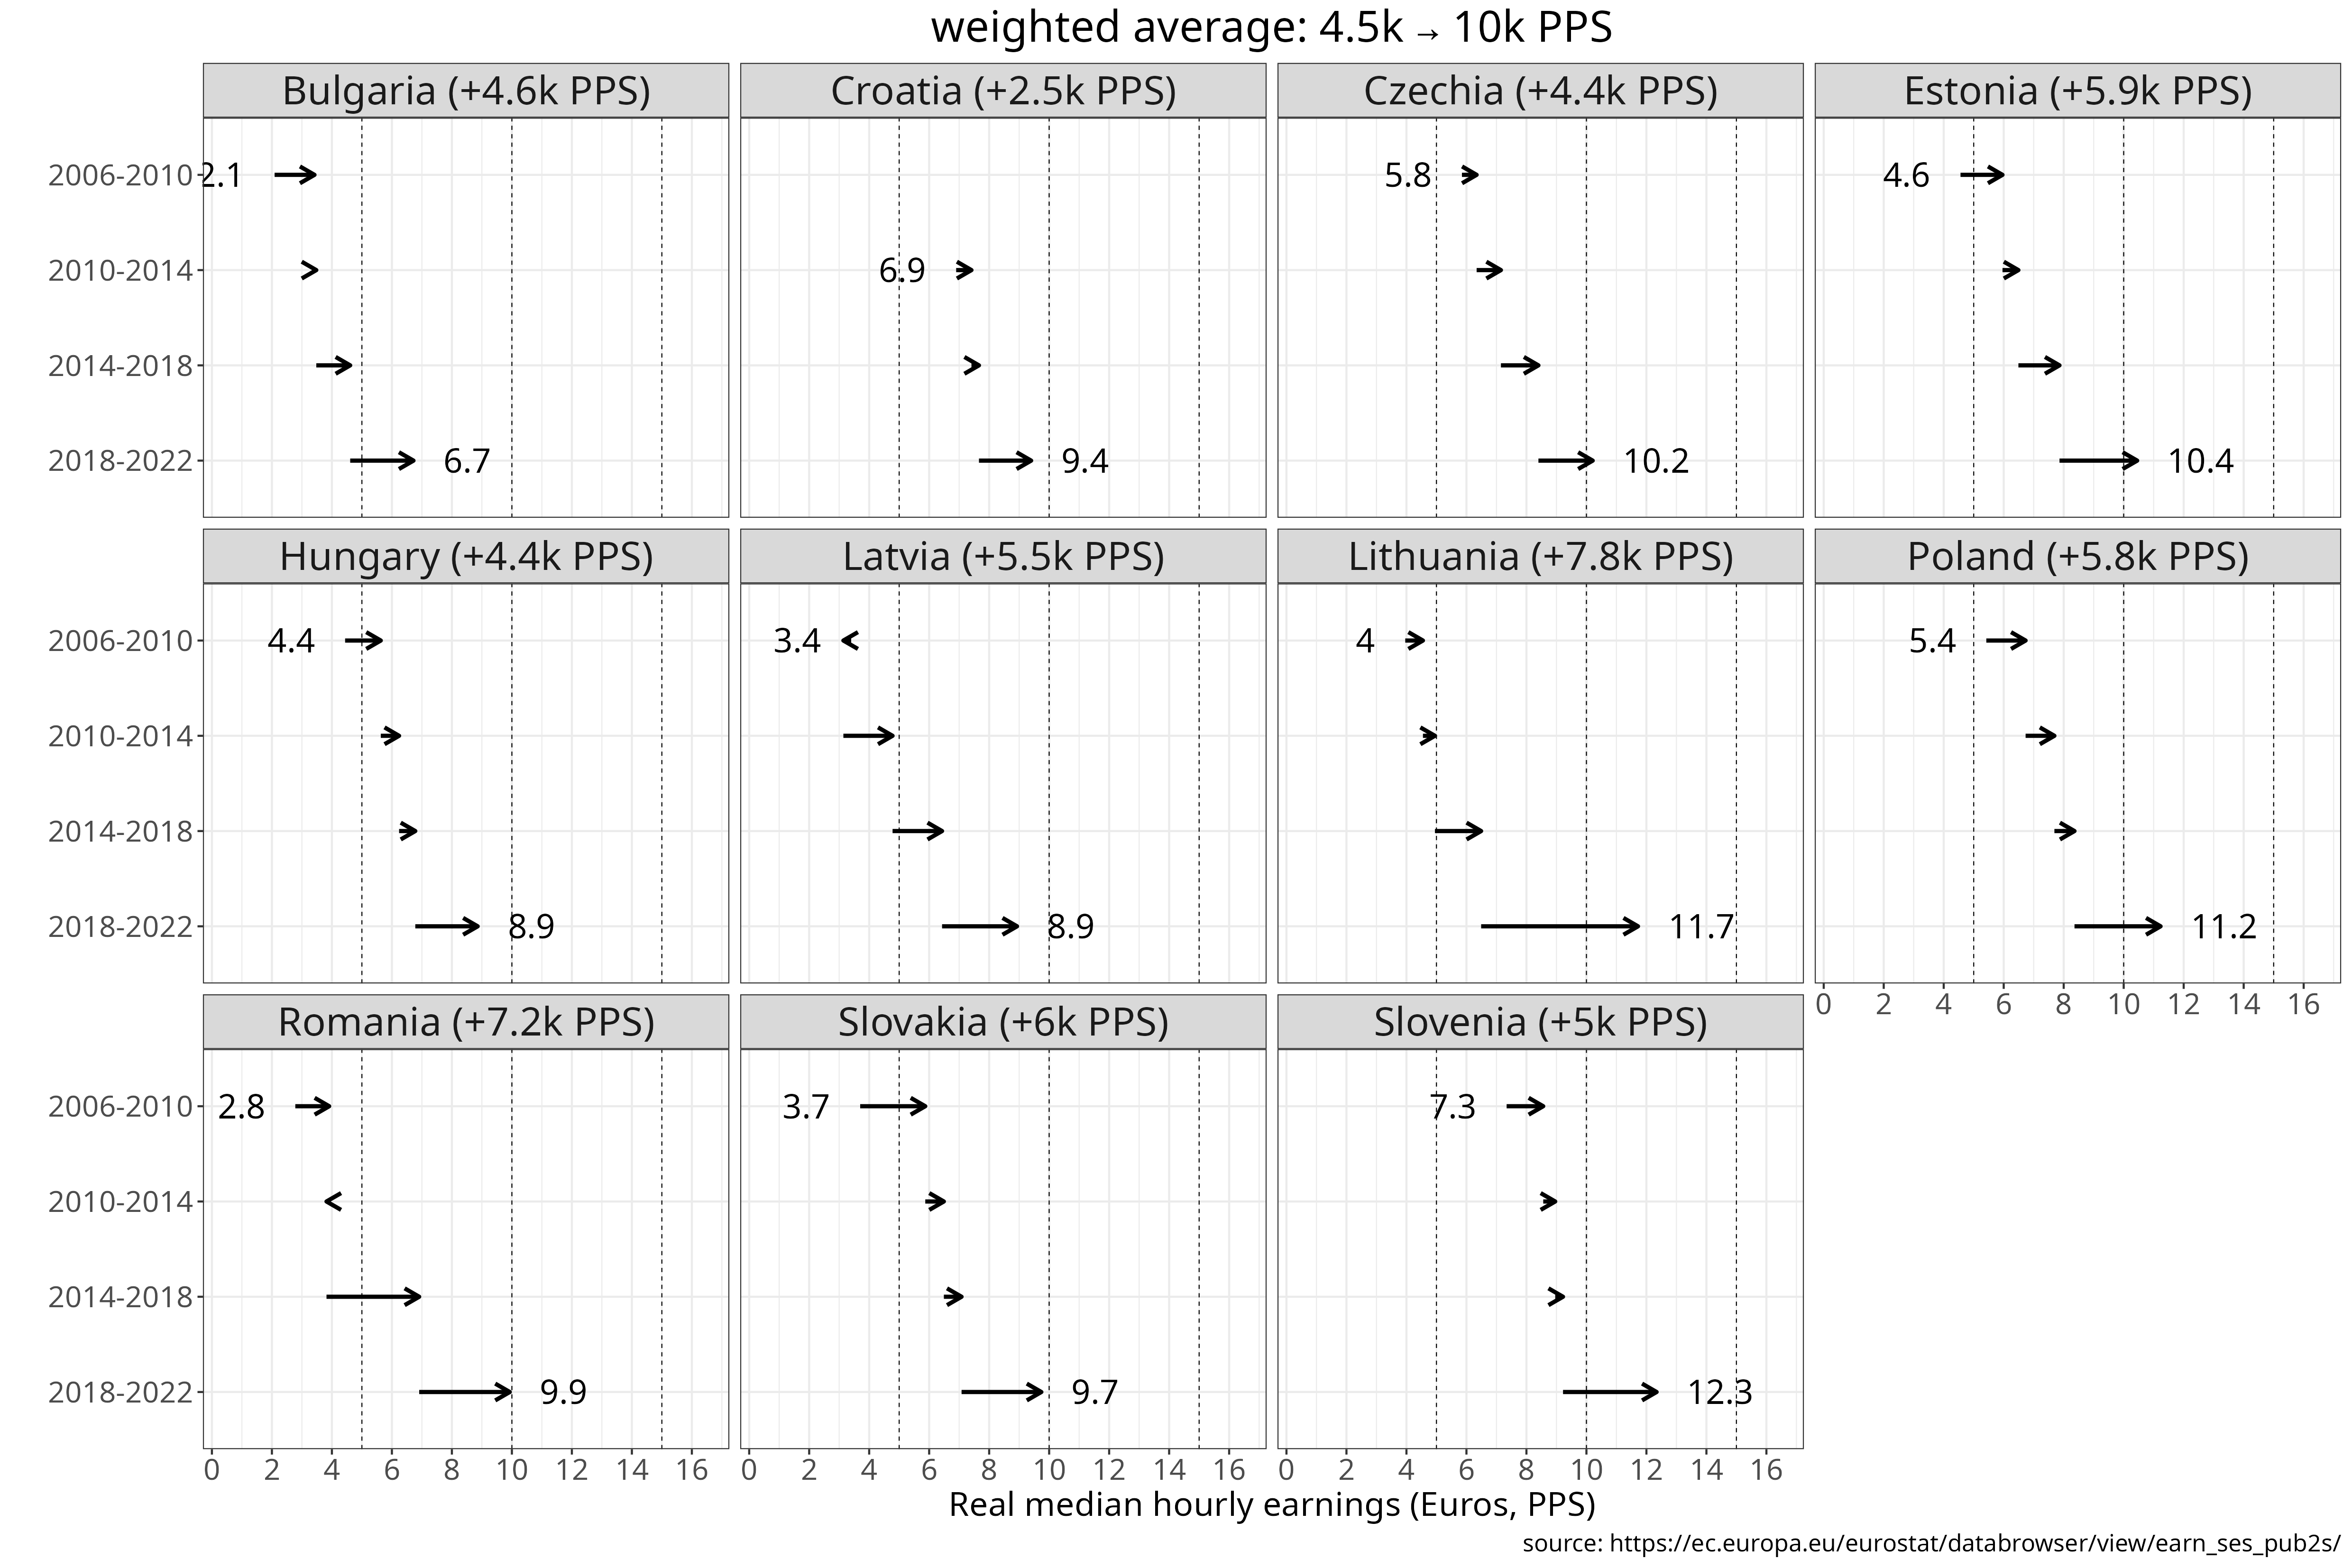
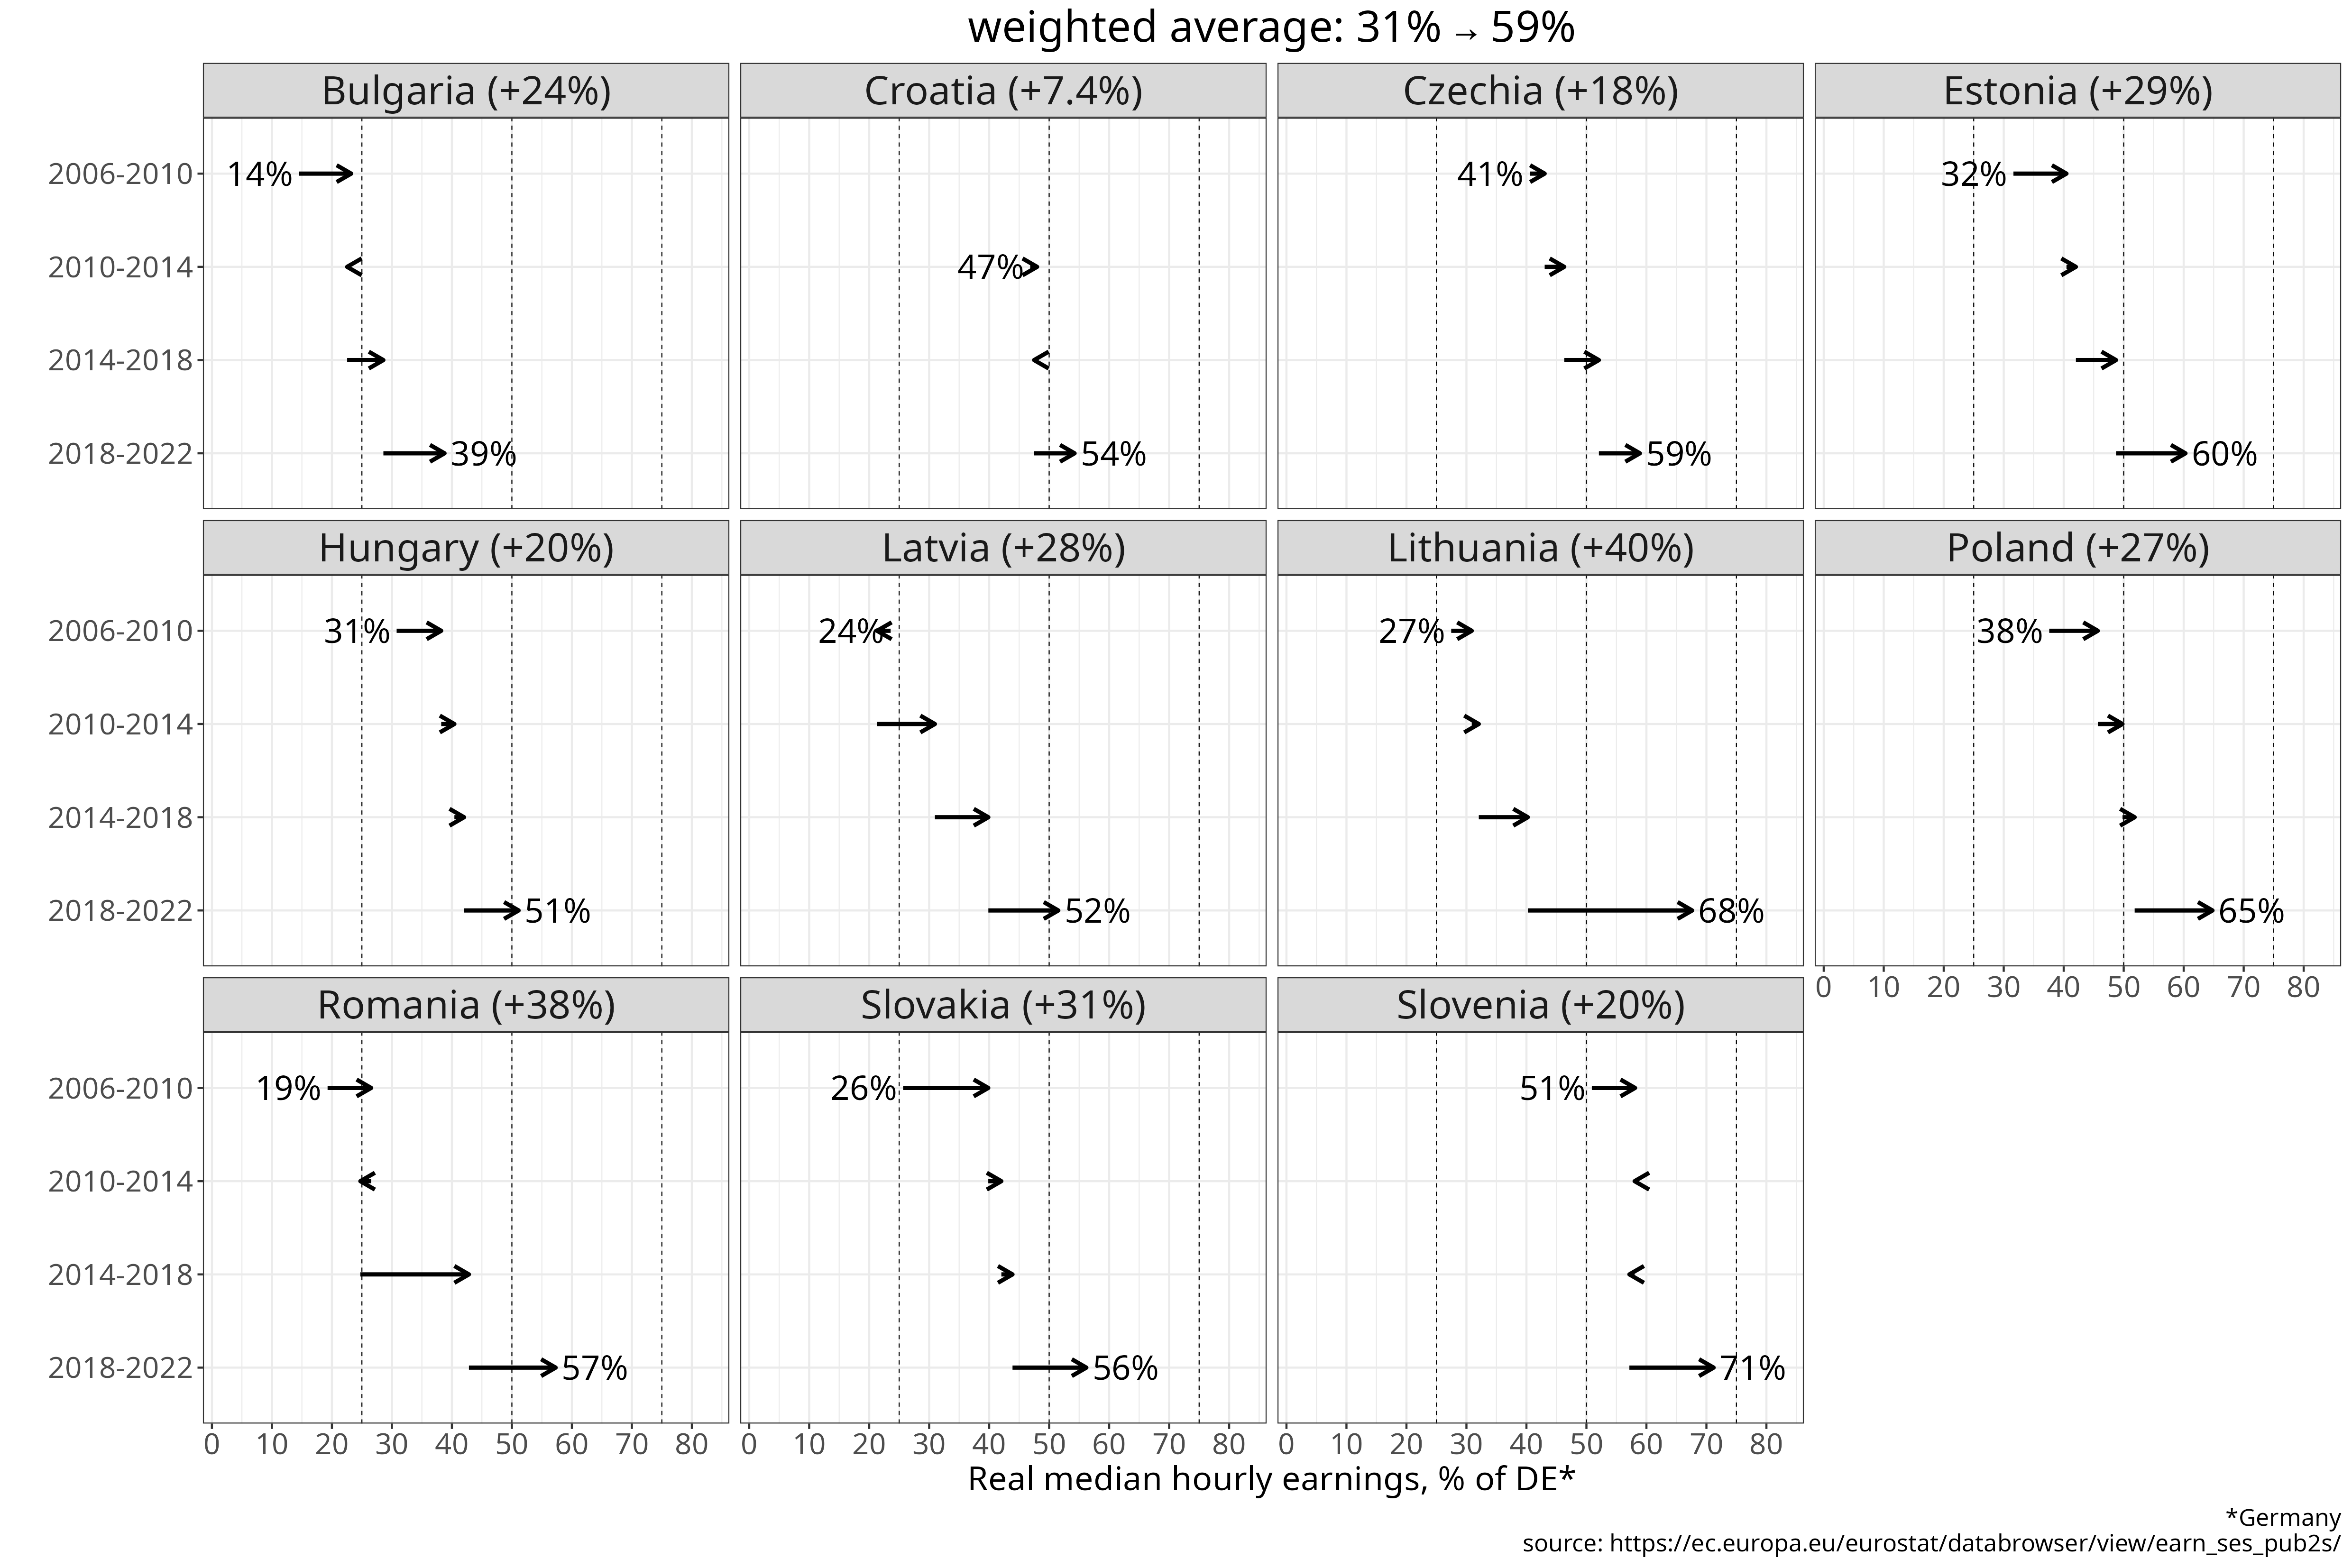
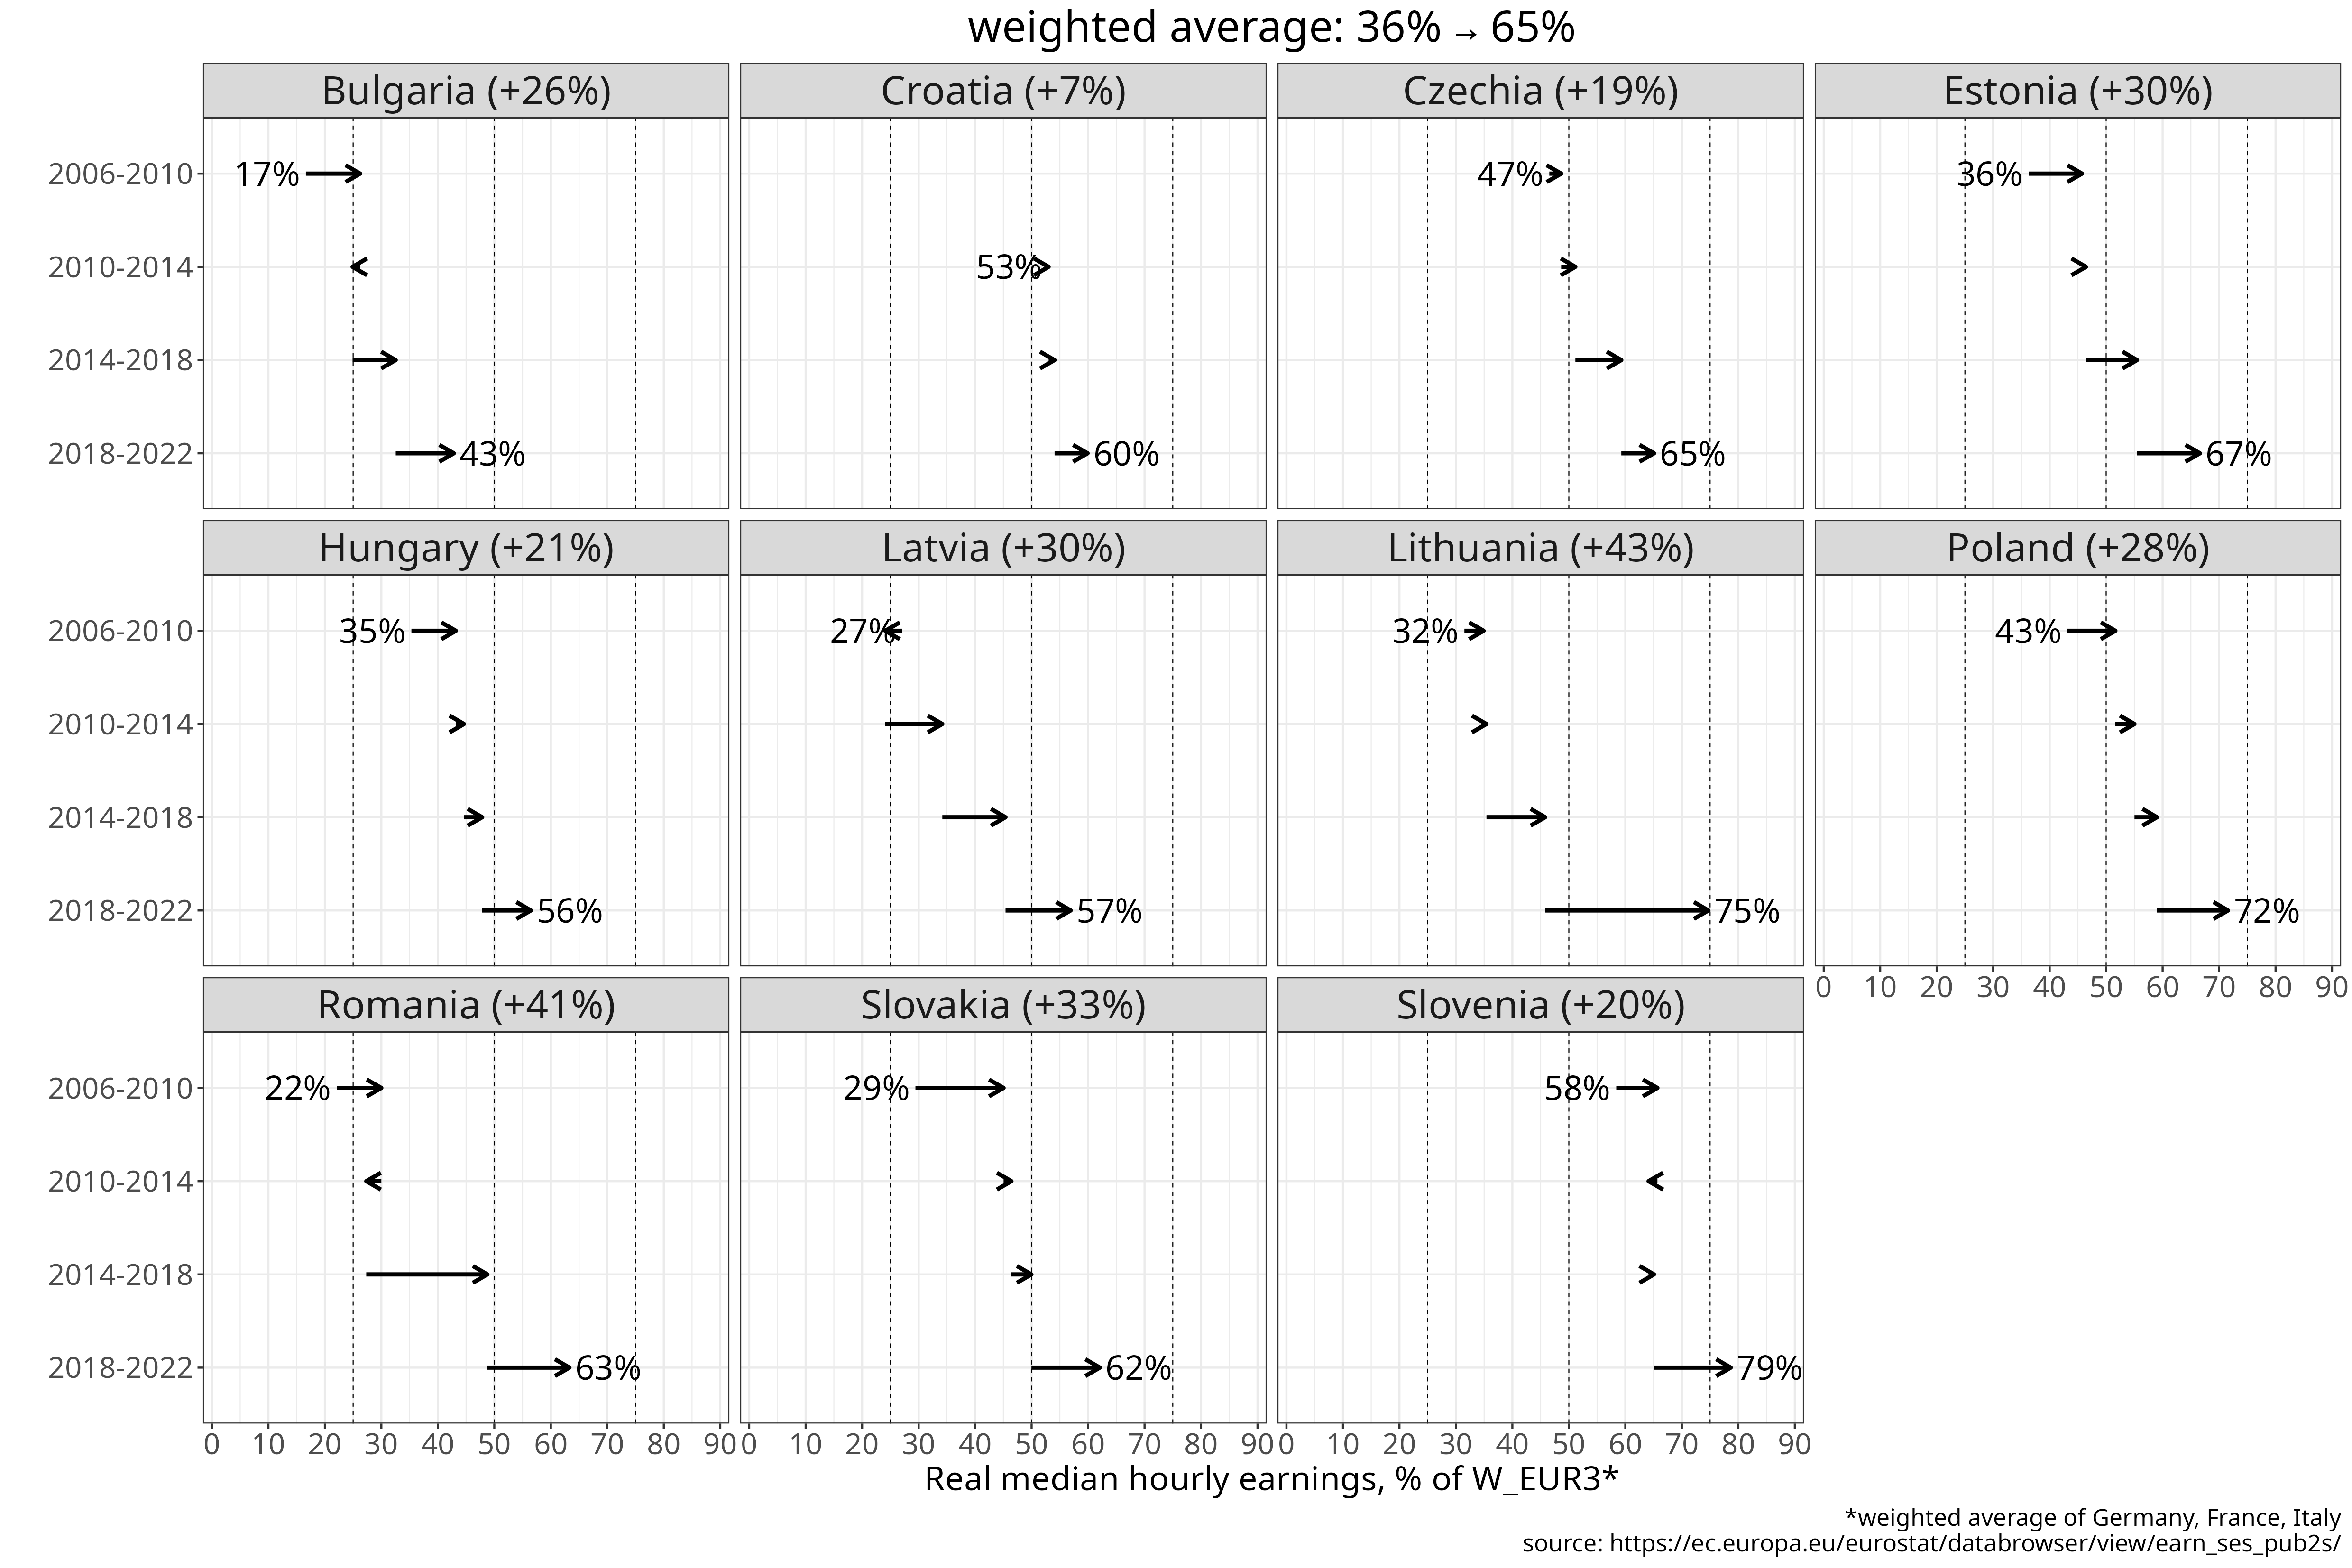

Figure 11 Median hourly earnings between 2006 and 2022 in Purchasing Power Standards (PPS).
Units: Values shown in PPS, or as a percentage relative to Germany, EU3 (DE, FR, IT), or Southern Europe, with all comparisons calculated in PPS.
Data includes all employees working for companies of 10 employees or more.
[download plot data]
[source: Eurostat]
The weighted average of CEE median hourly earnings moved from 31% to 59% of the German level from 2006 to 2022, a nearly 30% increase. When France and Italy are included in the benchmark (W_EUR3) beside Germany, the CEE average reached 65% of the benchmark in 2022, or 84% of the Southern European average. The increases are similar to those of GDP per capita (but over a shorter period for earnings), whereas the relative level (% of DE) reached by the CEE region is almost identical to their GNI per capita level. In 2022 hourly earnings were approximately 70% of the German level in Slovenia and Lithuania, followed closely by Poland (65%); other countries were in the 50 to 60% range, with Bulgaria still below half the German level (39%). By 2022 Slovenia exceeded the Southern European average, while Lithuania (97%) and Poland (93%) almost reached it. These figures are about earnings in the private sector, but do not include public sector salaries or other types of income like government transfers. Let us also look at a broader income measure that includes all household income in Figure 12.
Median equivalised net income
Median equivalised net income is a broader Eurostat measure that covers the entire population and includes all sources of household disposable income after taxes and transfers, expressed on a per-person basis adjusted for household size and composition. Figure 12 shows its evolution in absolute terms (in PPS) and relative to our three benchmarks (Germany, W_EUR3 [DE, FR, IT], Southern Europe) from 2005 to 2024.

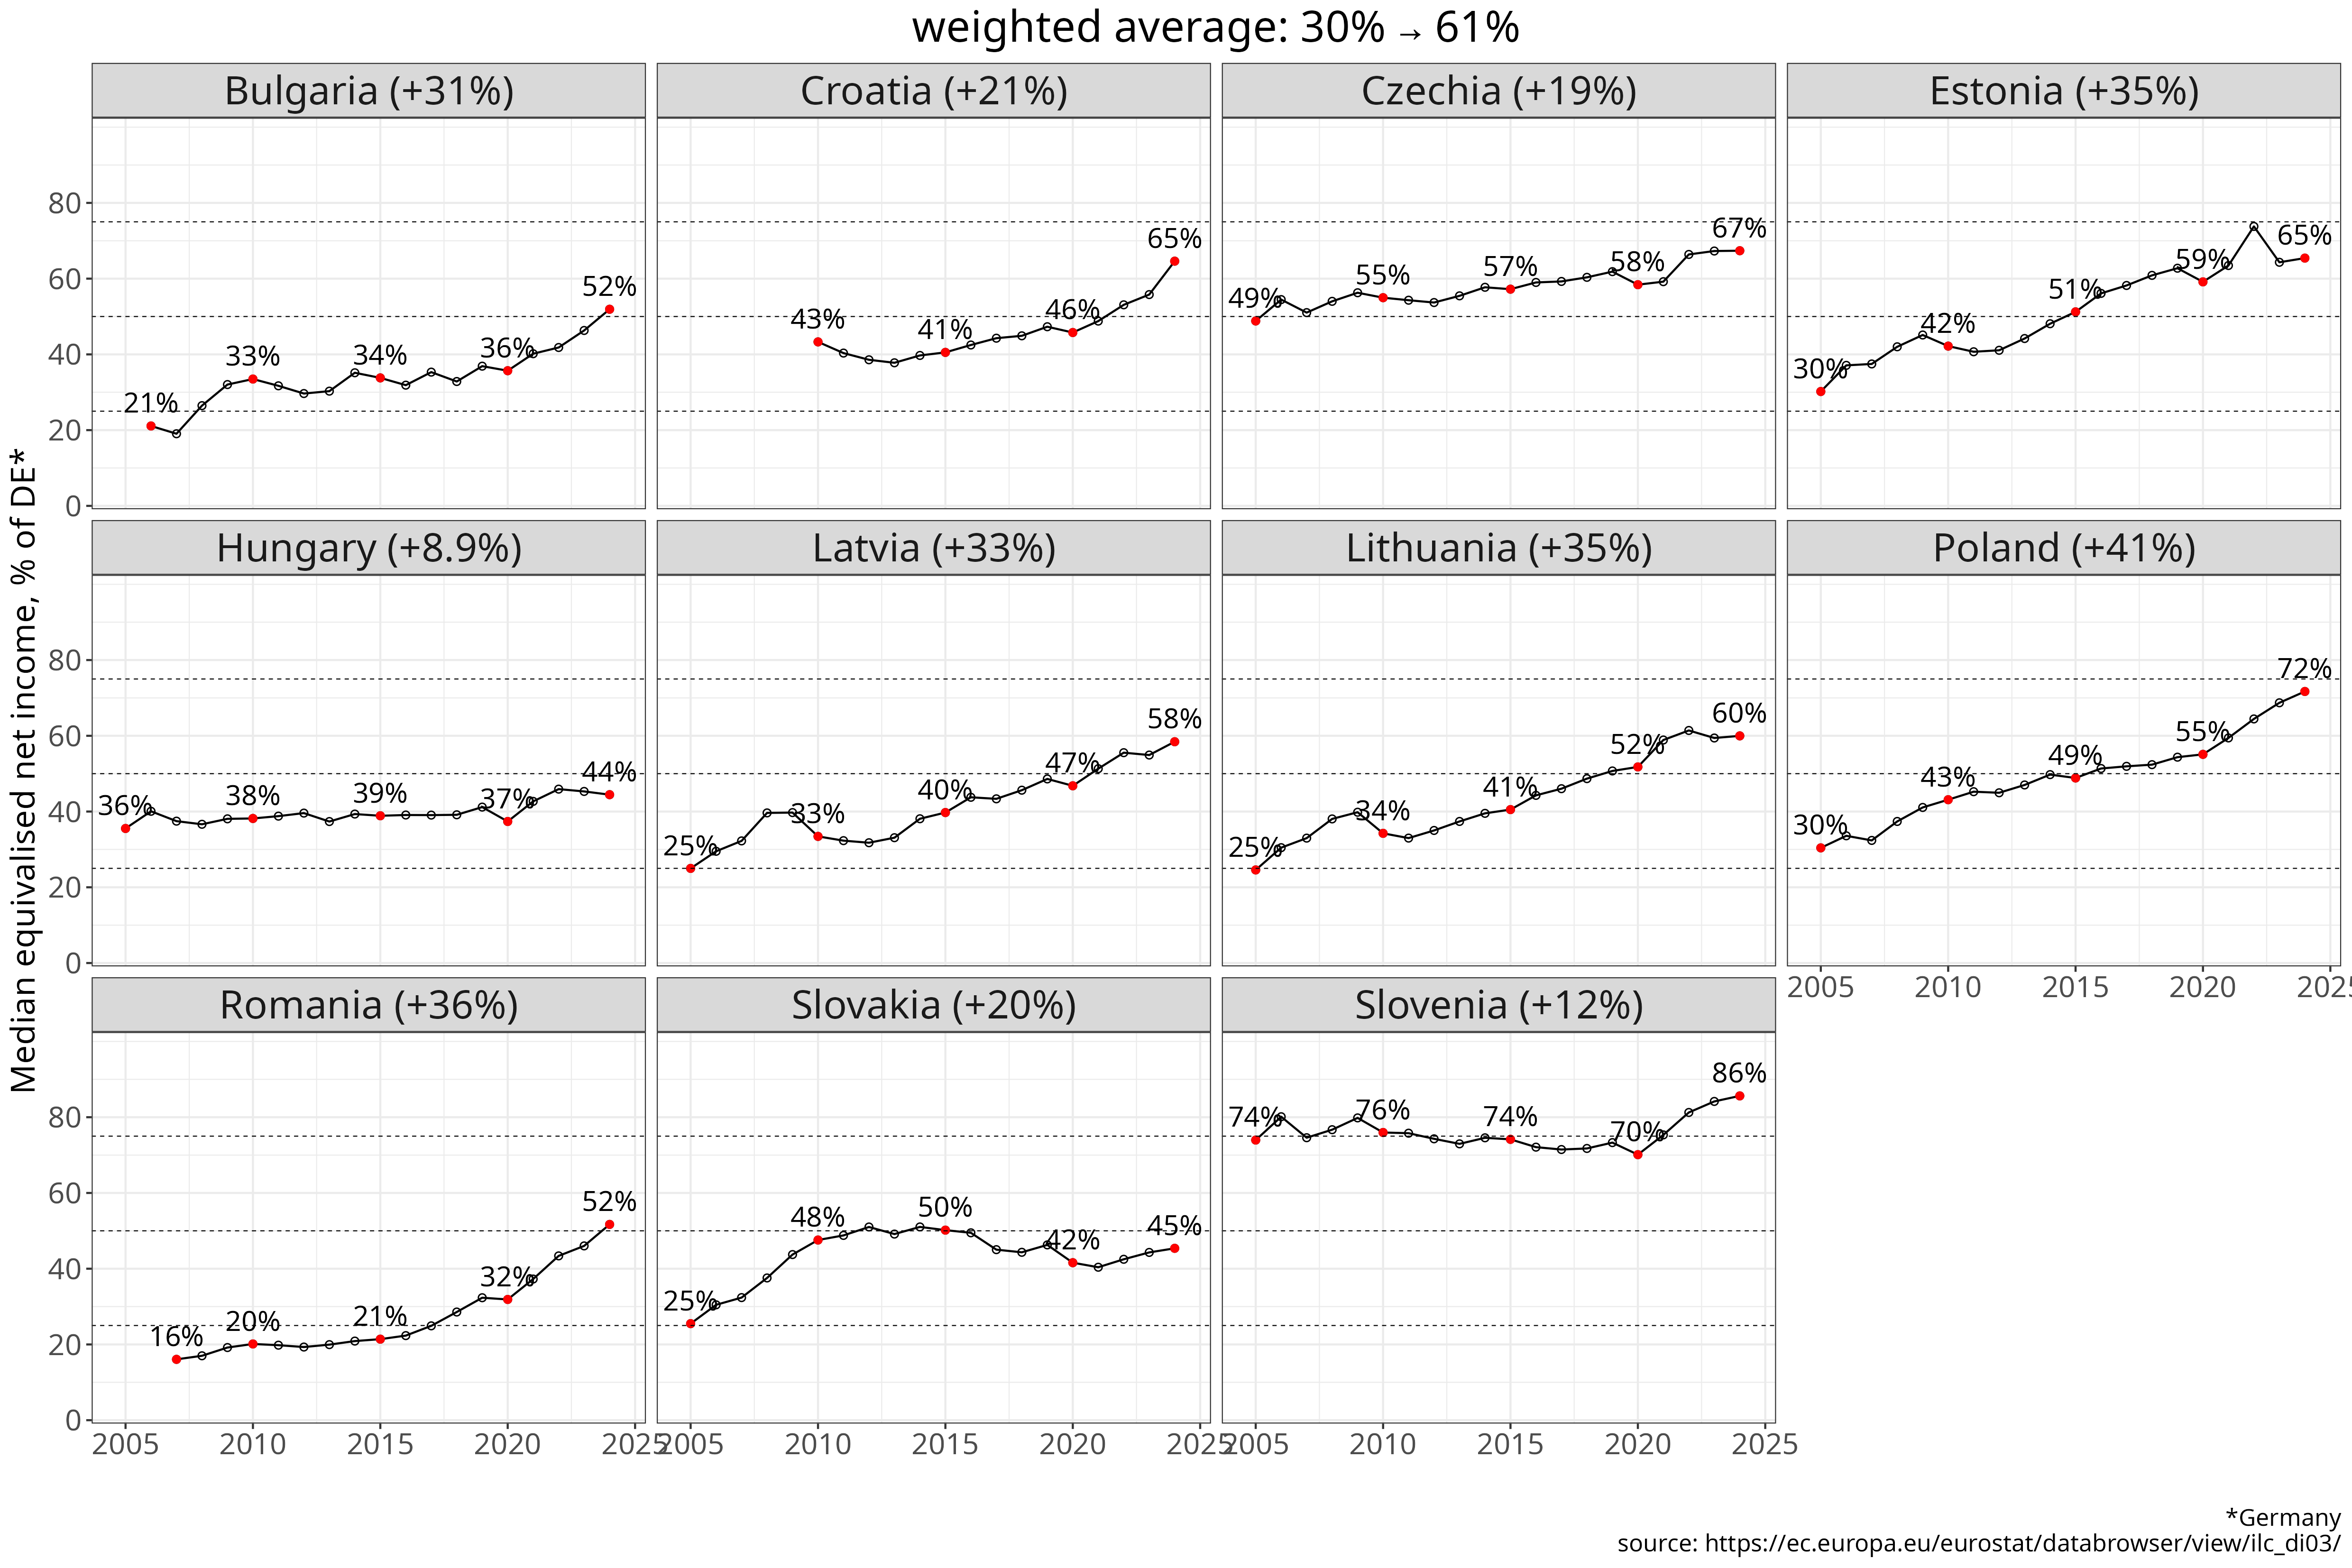
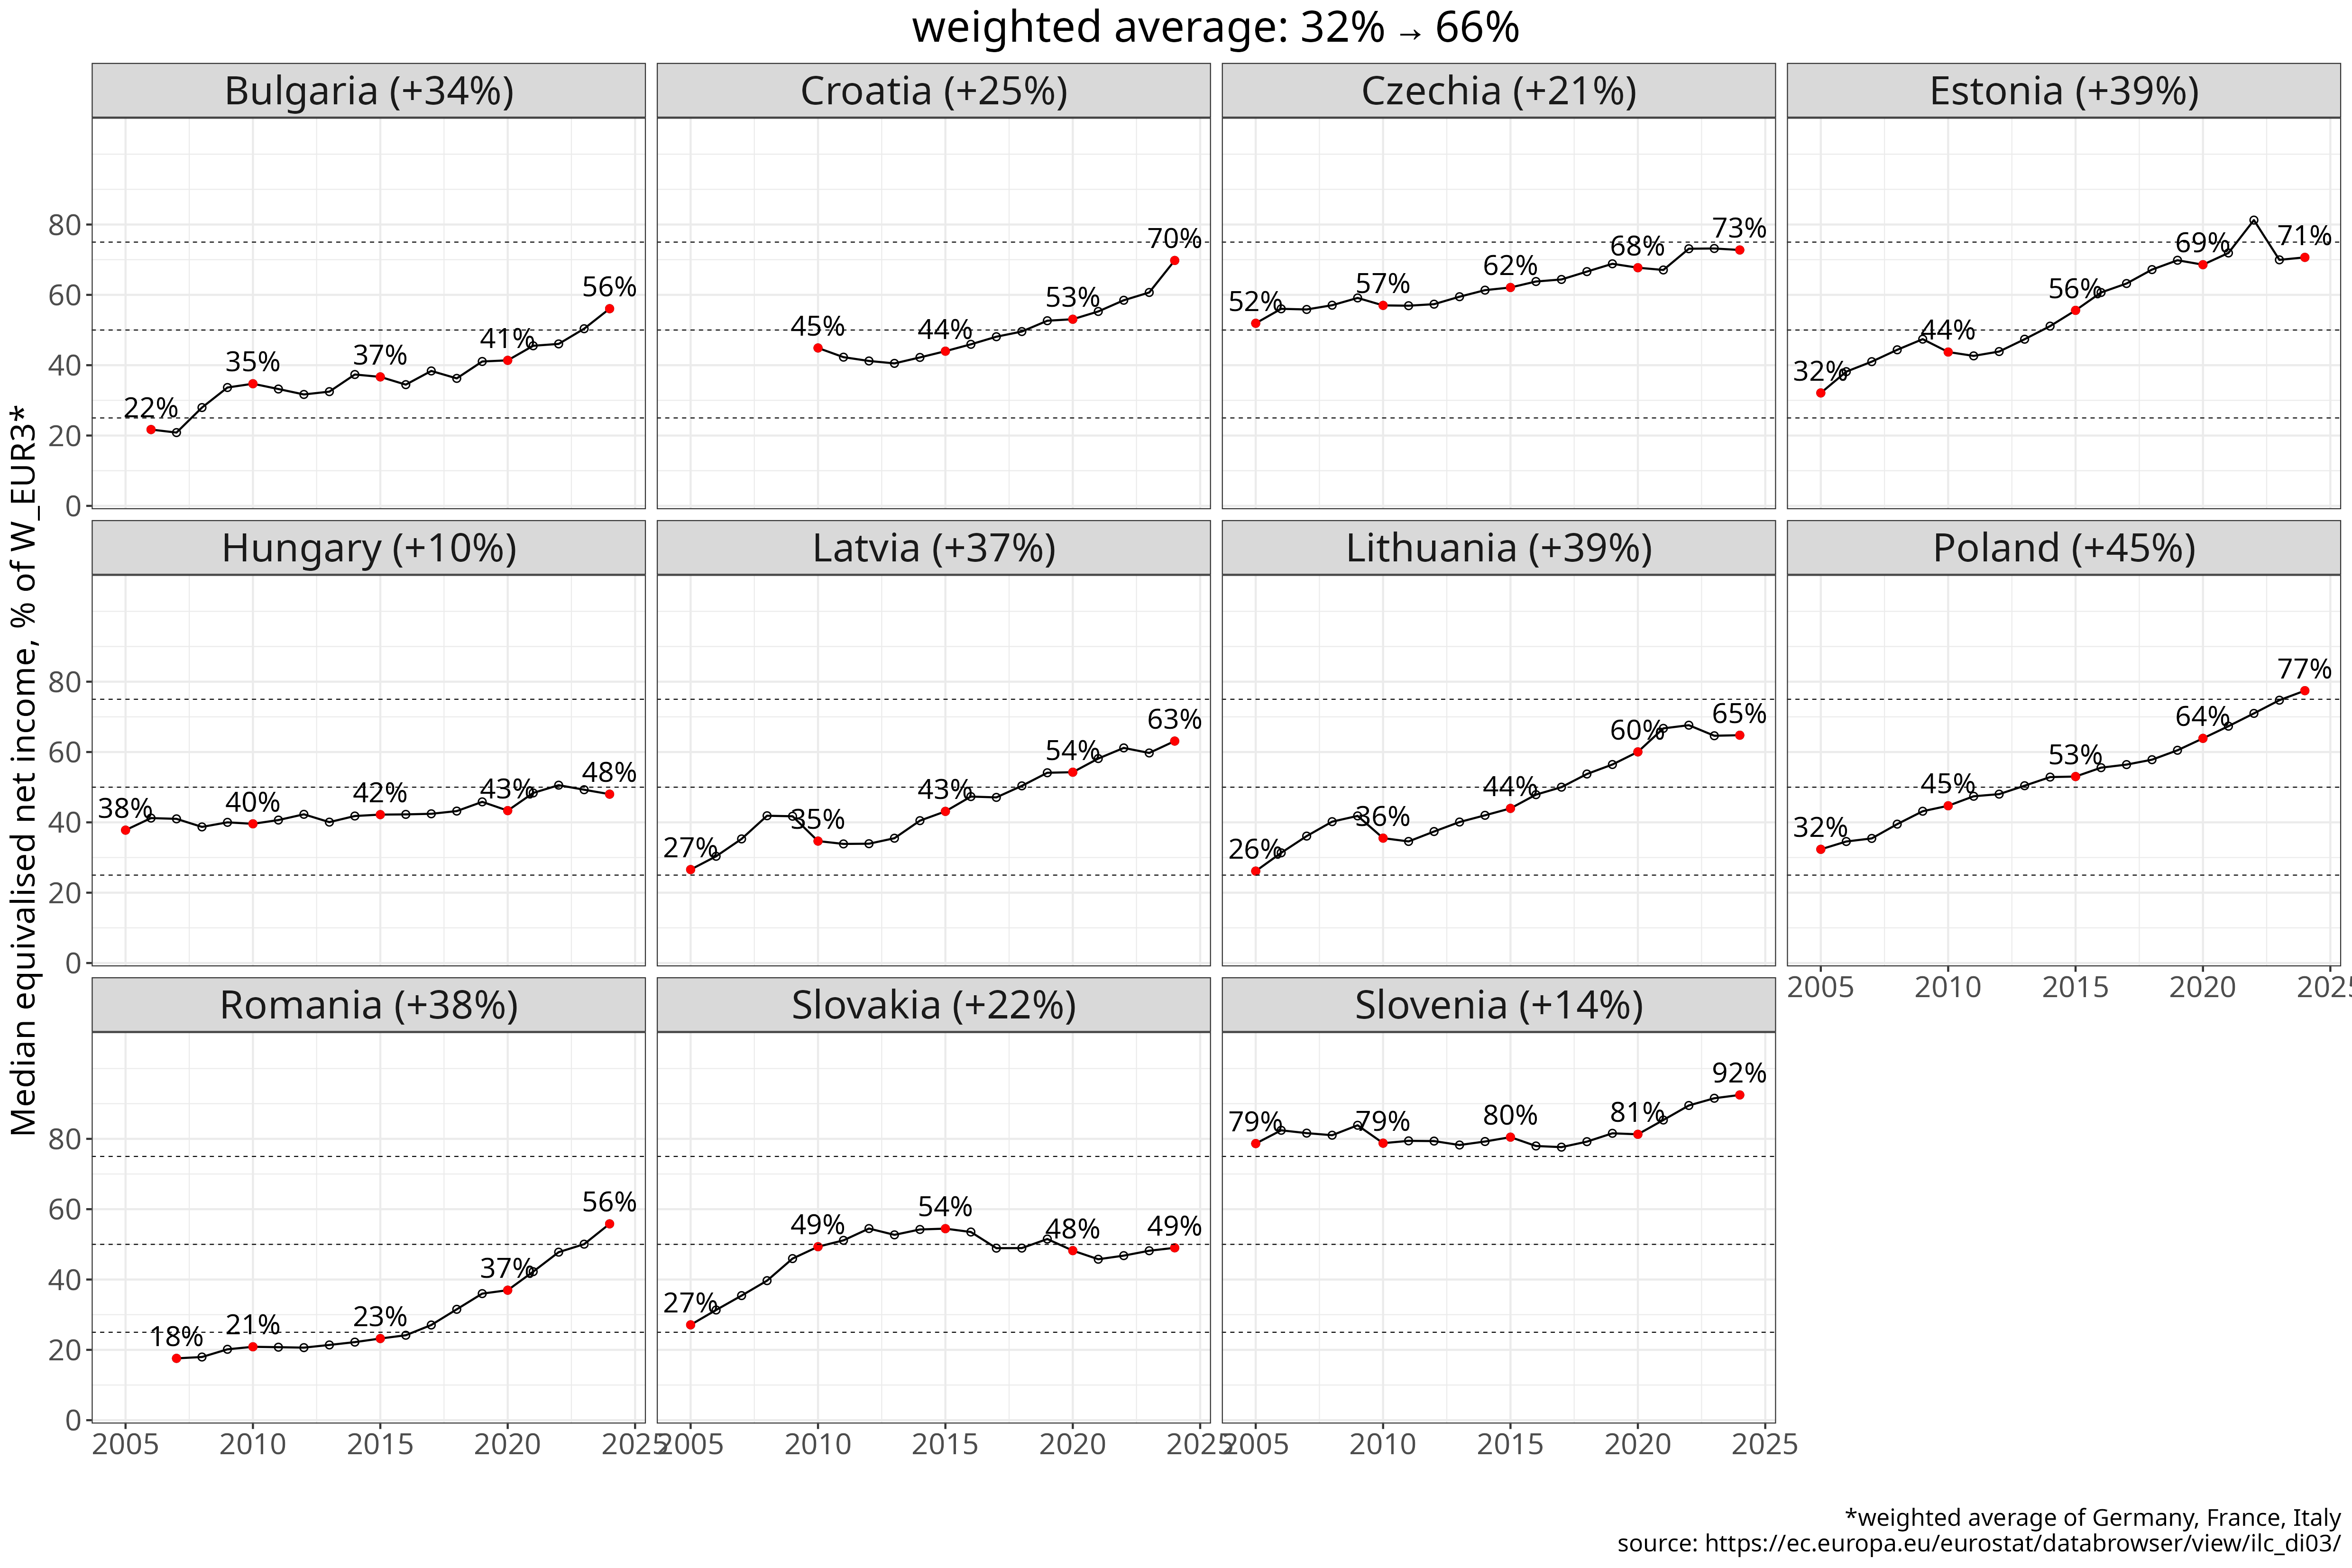
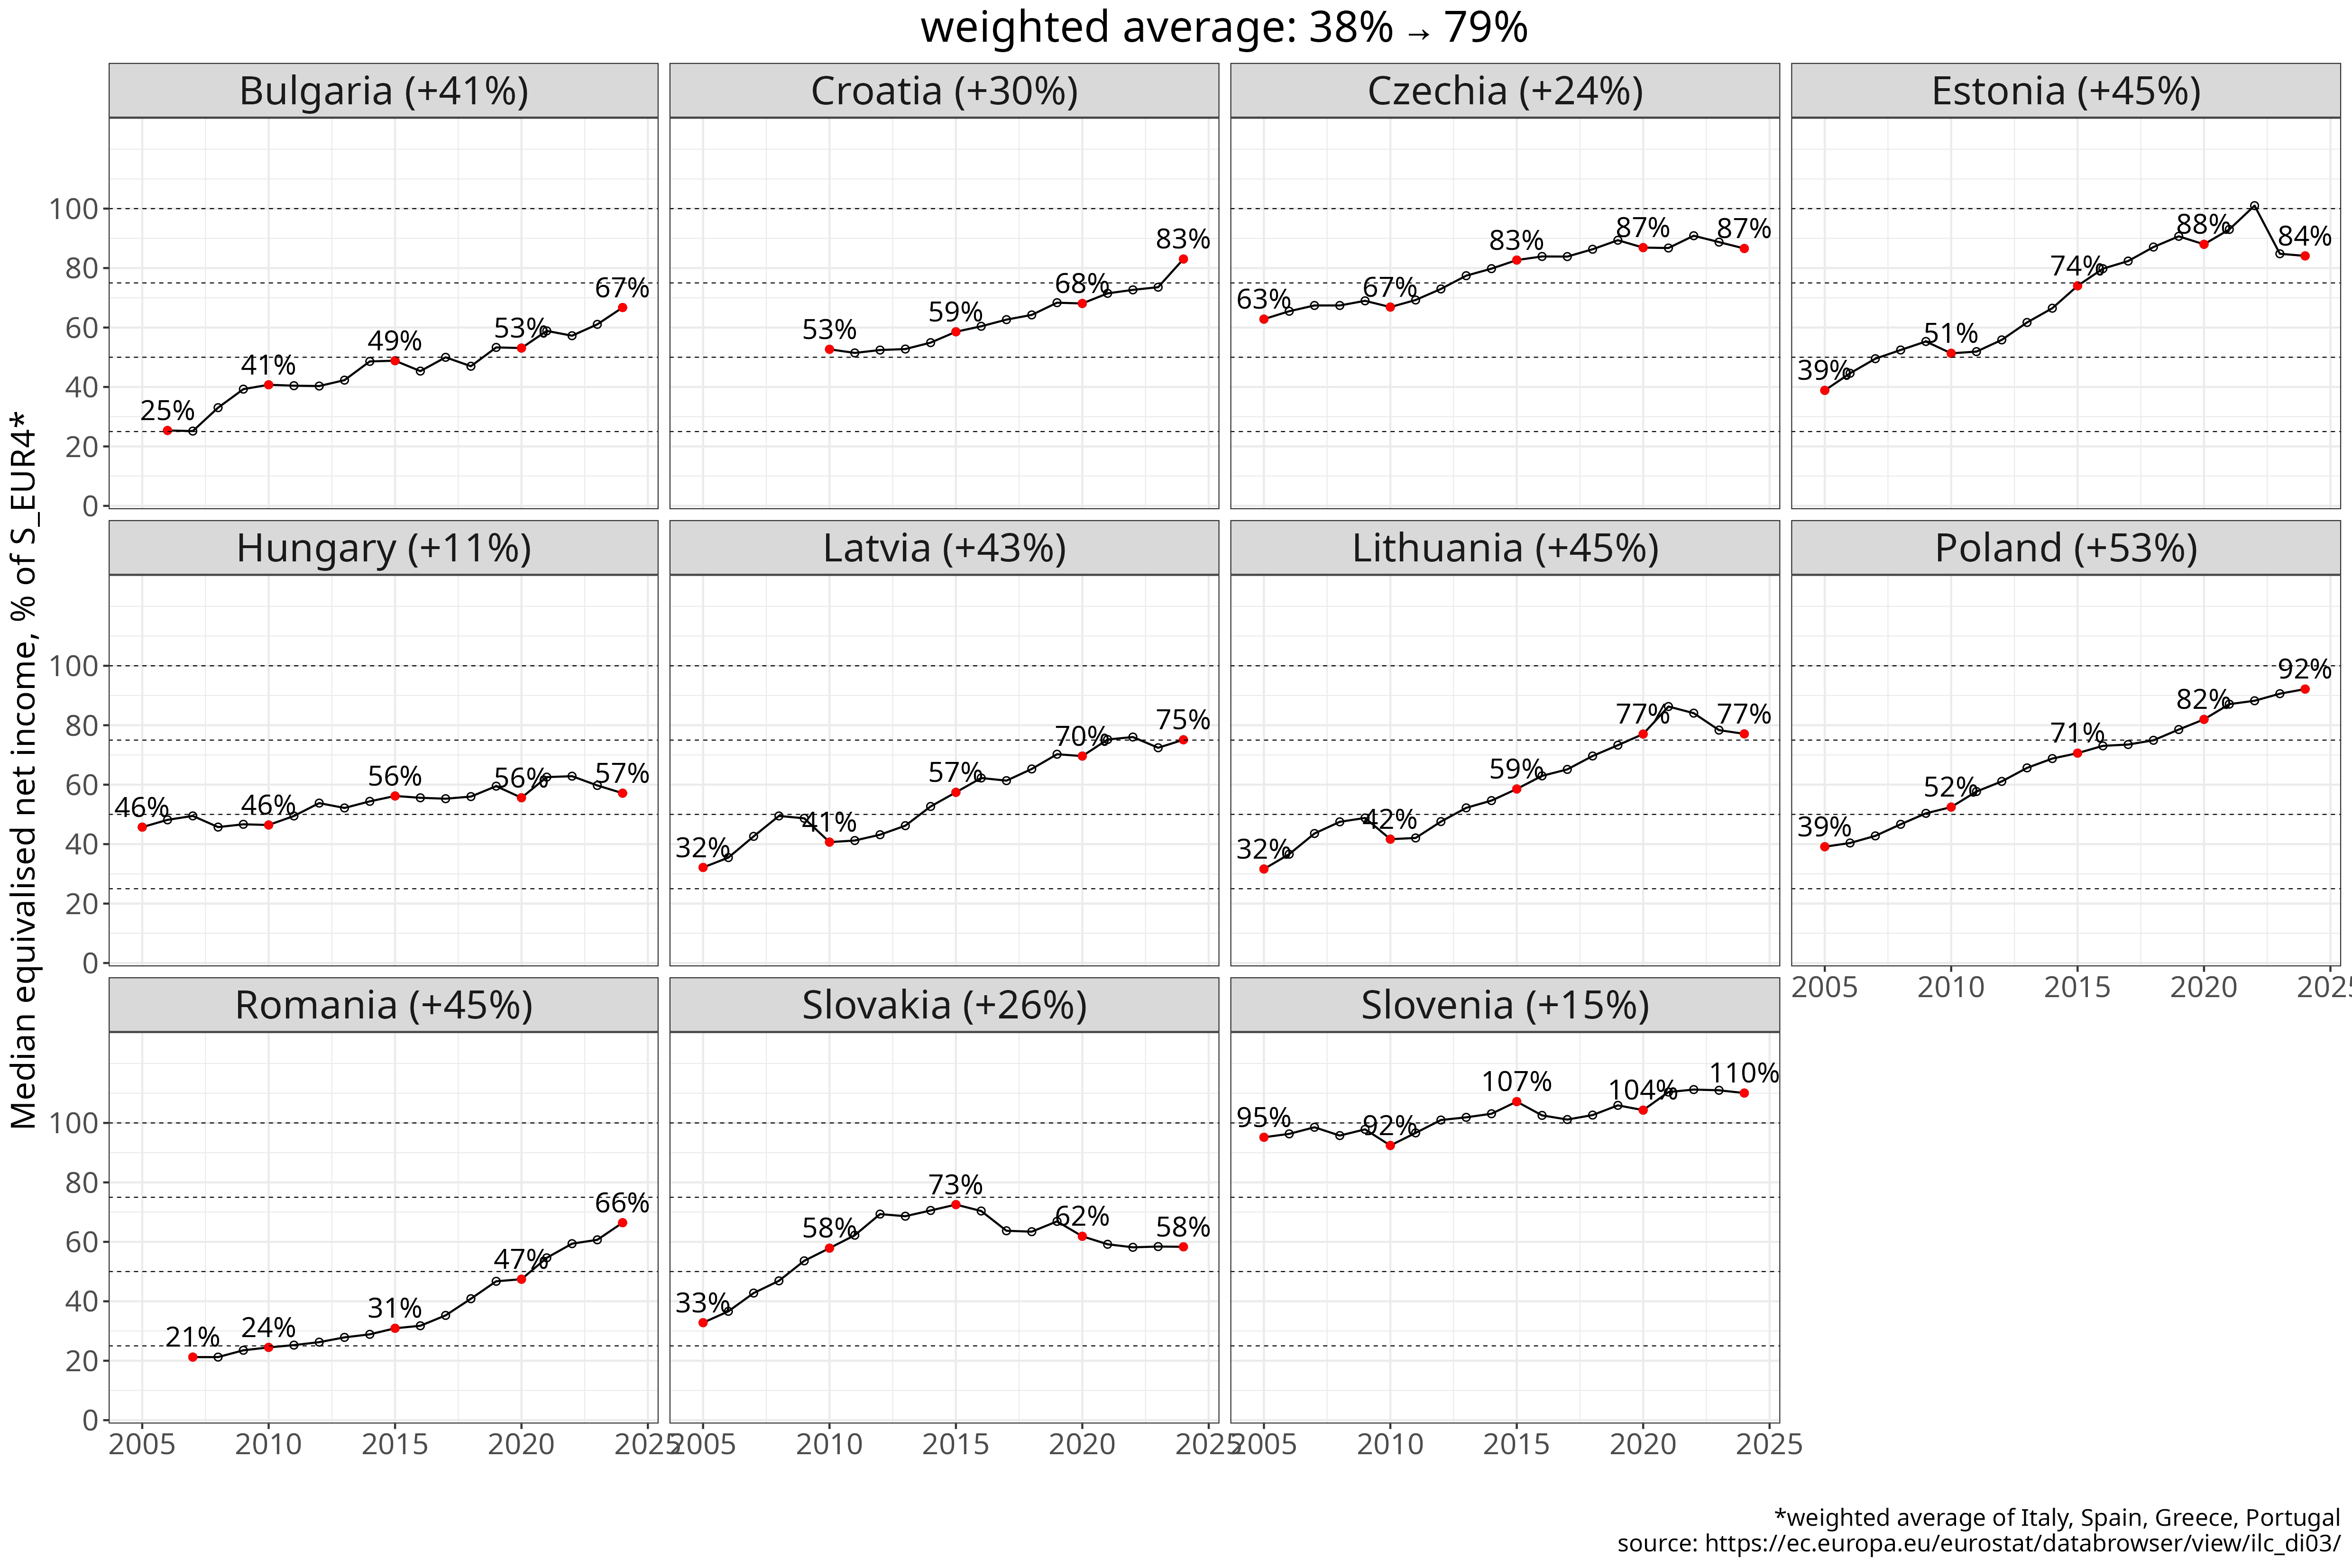
Figure 12 Median equivalised net income between 2005 and 2024.
Units: Values shown in thousand PPS, or as a percentage relative to Germany, W_EUR3 (DE, FR, IT), or Southern Europe, with all comparisons calculated in PPS.Median equivalised income is household disposable income per person, adjusted for household size and composition.
[download plot data]
[source]
The average nedian equivalised net income in CEE (measured in PPS) approximately tripled from 2005 to 2024, a larger increase than for median hourly earnings (2.2x), suggesting that broad household income grew by a larger factor than private sector hourly earnings. Relative to Germany the weighted average of CEE moved from 30 to 61%, a figure marginally higher than for median hourly earnings or annual average wages, reaching an almost identical relative level as GNI per capita (63%), but lower than for GDP per capita (68%). Expressed as a percentage of W_EUR3 the value in 2024 is 66%, or 79% of the Southern European level. There are significant differences between CEE countries. Again Poland saw the largest increase, moving ~40% up relative to the German benchmark, followed by Romania, Lithuania and Estonia (~35% increase each). Hungary had the worst convergence performance - similarly to several other variables (median earning, annual average wage, labour productivity, GNI per capita), where its convergence performance relative to the German benchmark level was (among) the weakest.
Life expectancy
We saw that labour income measures are closely aligned with output measures. In particular, earnings/income convergence figures are almost identical to GNI per capita, showing slightly more convergence than per hour productivity, and somewhat less then GDP per capita. But perhaps the most important vital statistic, life expectancy shows a different picture? Perhaps while socialism meant falling behind the Western and Southern Europe in macro-economic terms - while since 1990 there has been significant convergence - it has been a different trajectory in life expectancy? The short answer is no. In Figure 13 we have life expectancy trends in years and as percentages of the four global benchmarks (DE, G7, Southern Europe, Latin America), over four periods: 1950-1965 (early socialism), 1965-1989 (late socialism), 1989-1995 (transition), 1995-2023 (capitalism).
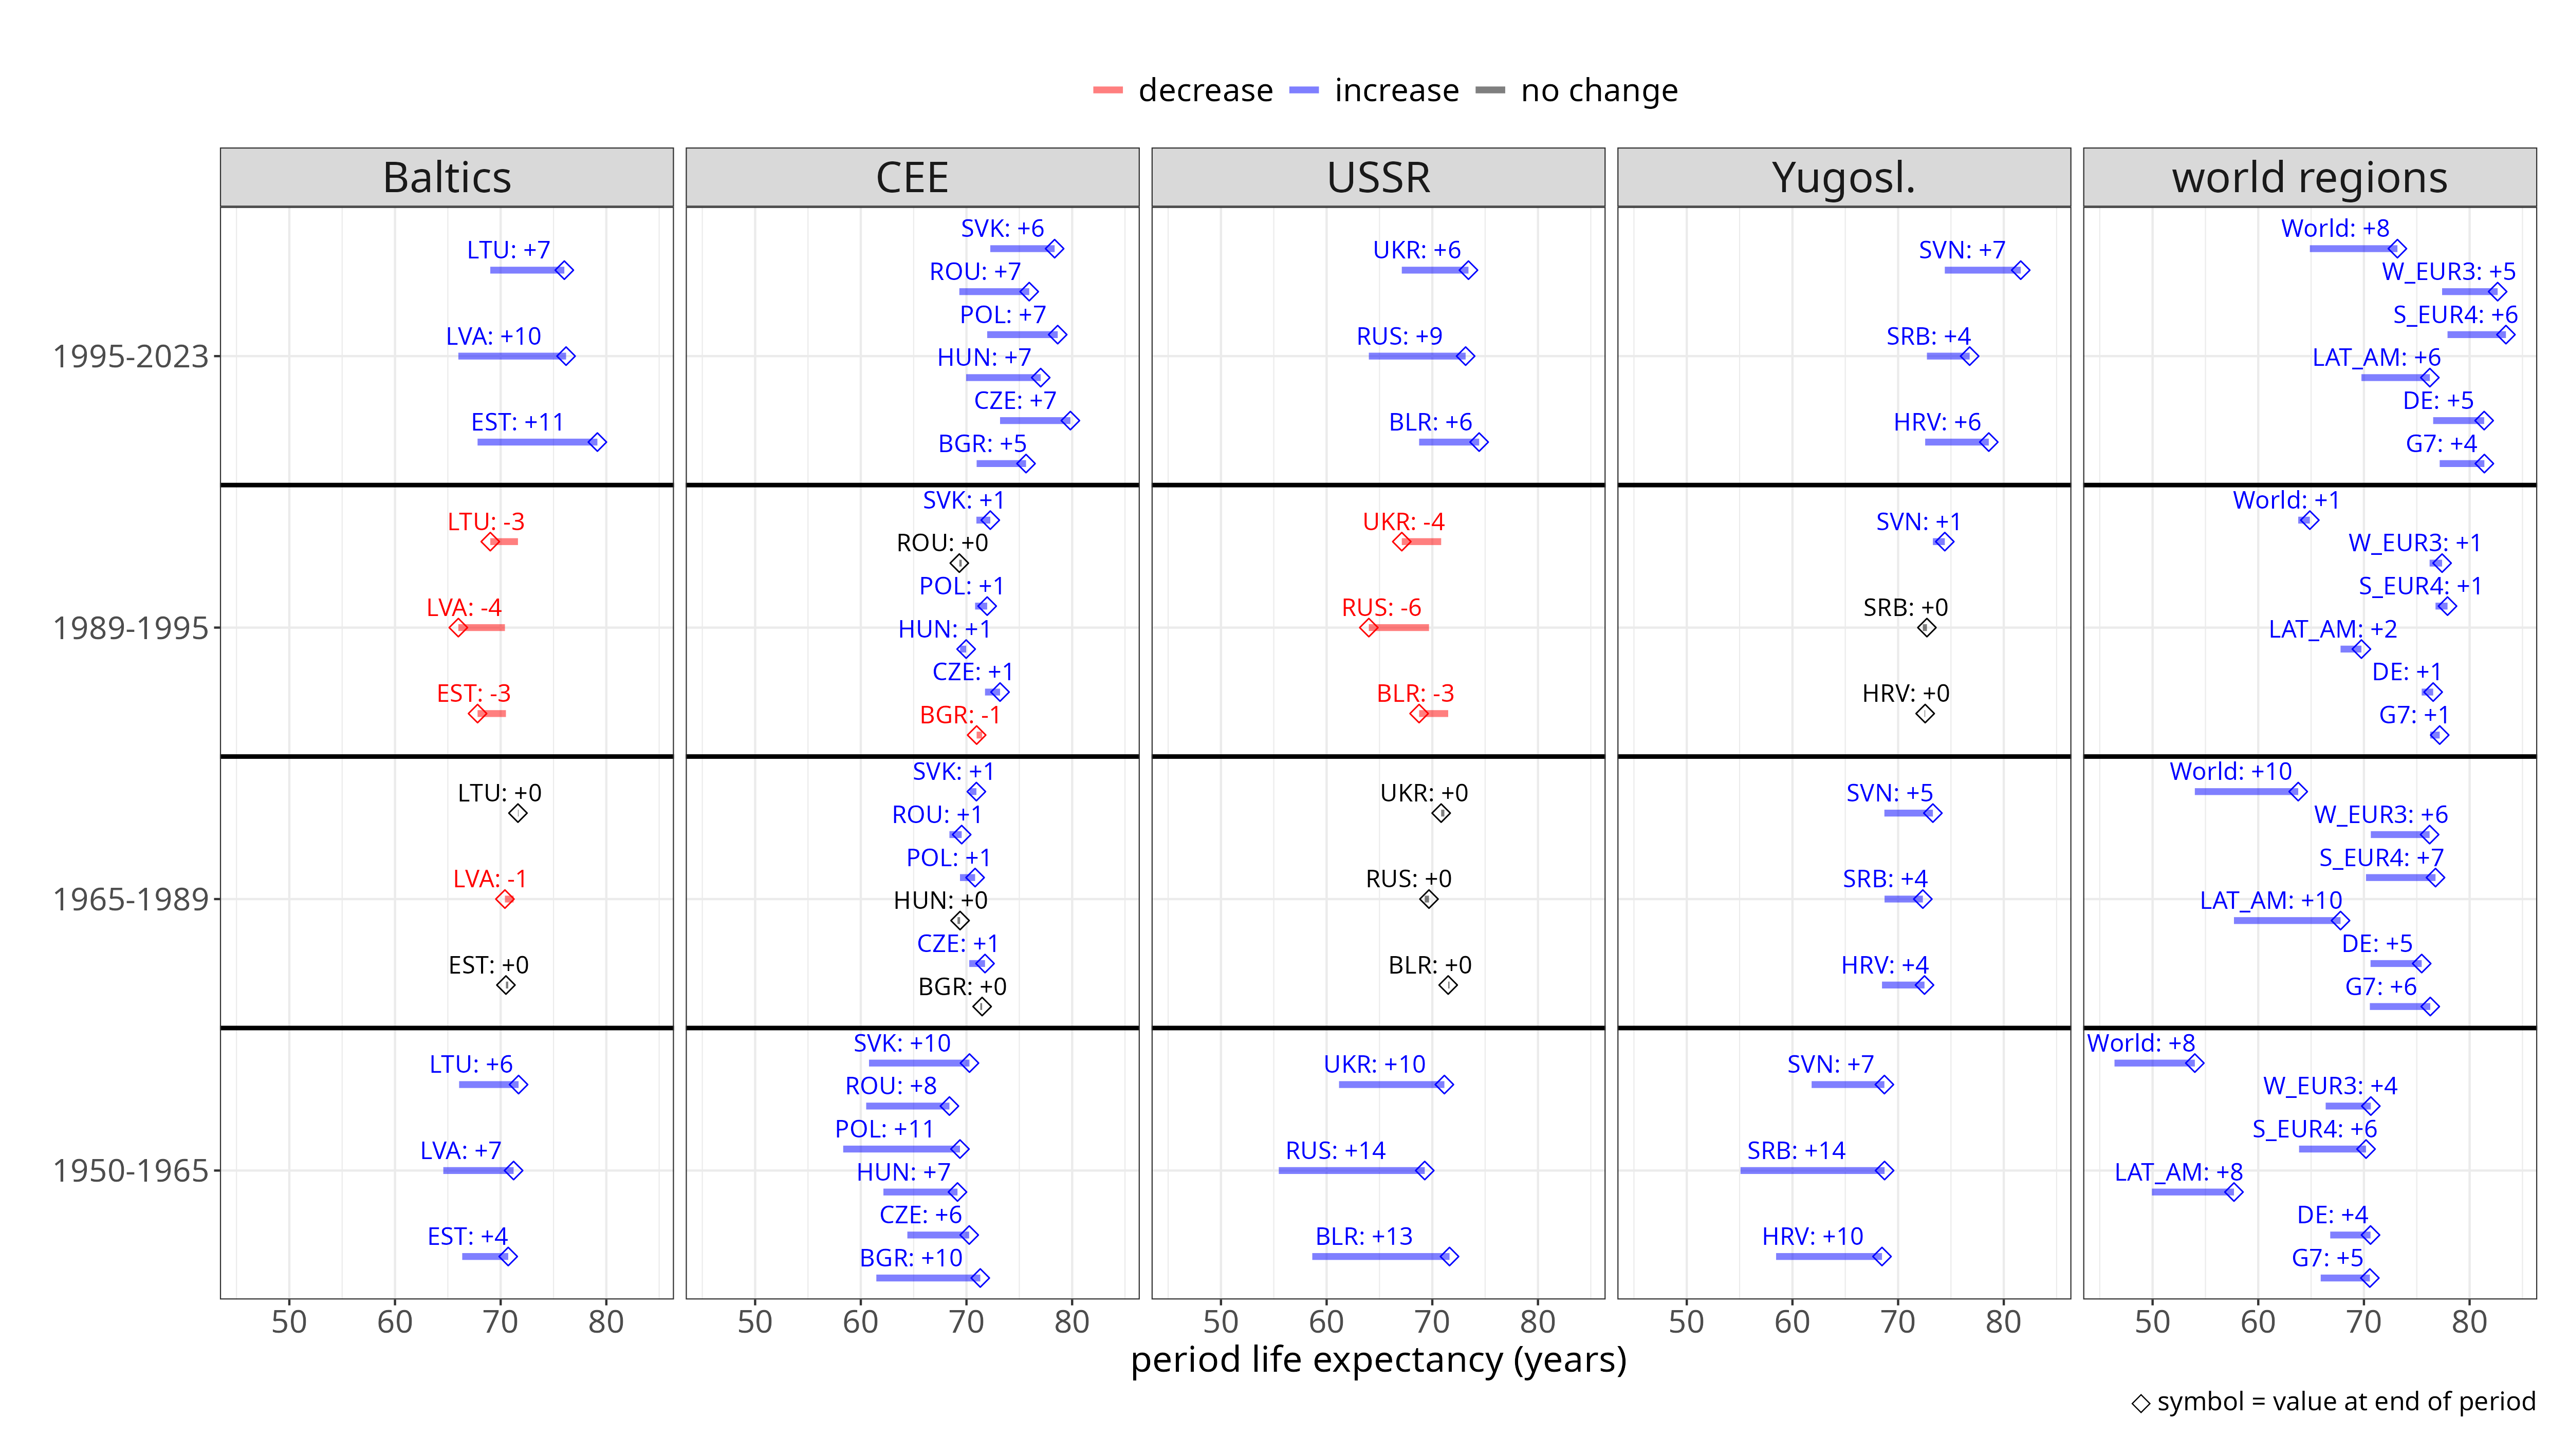
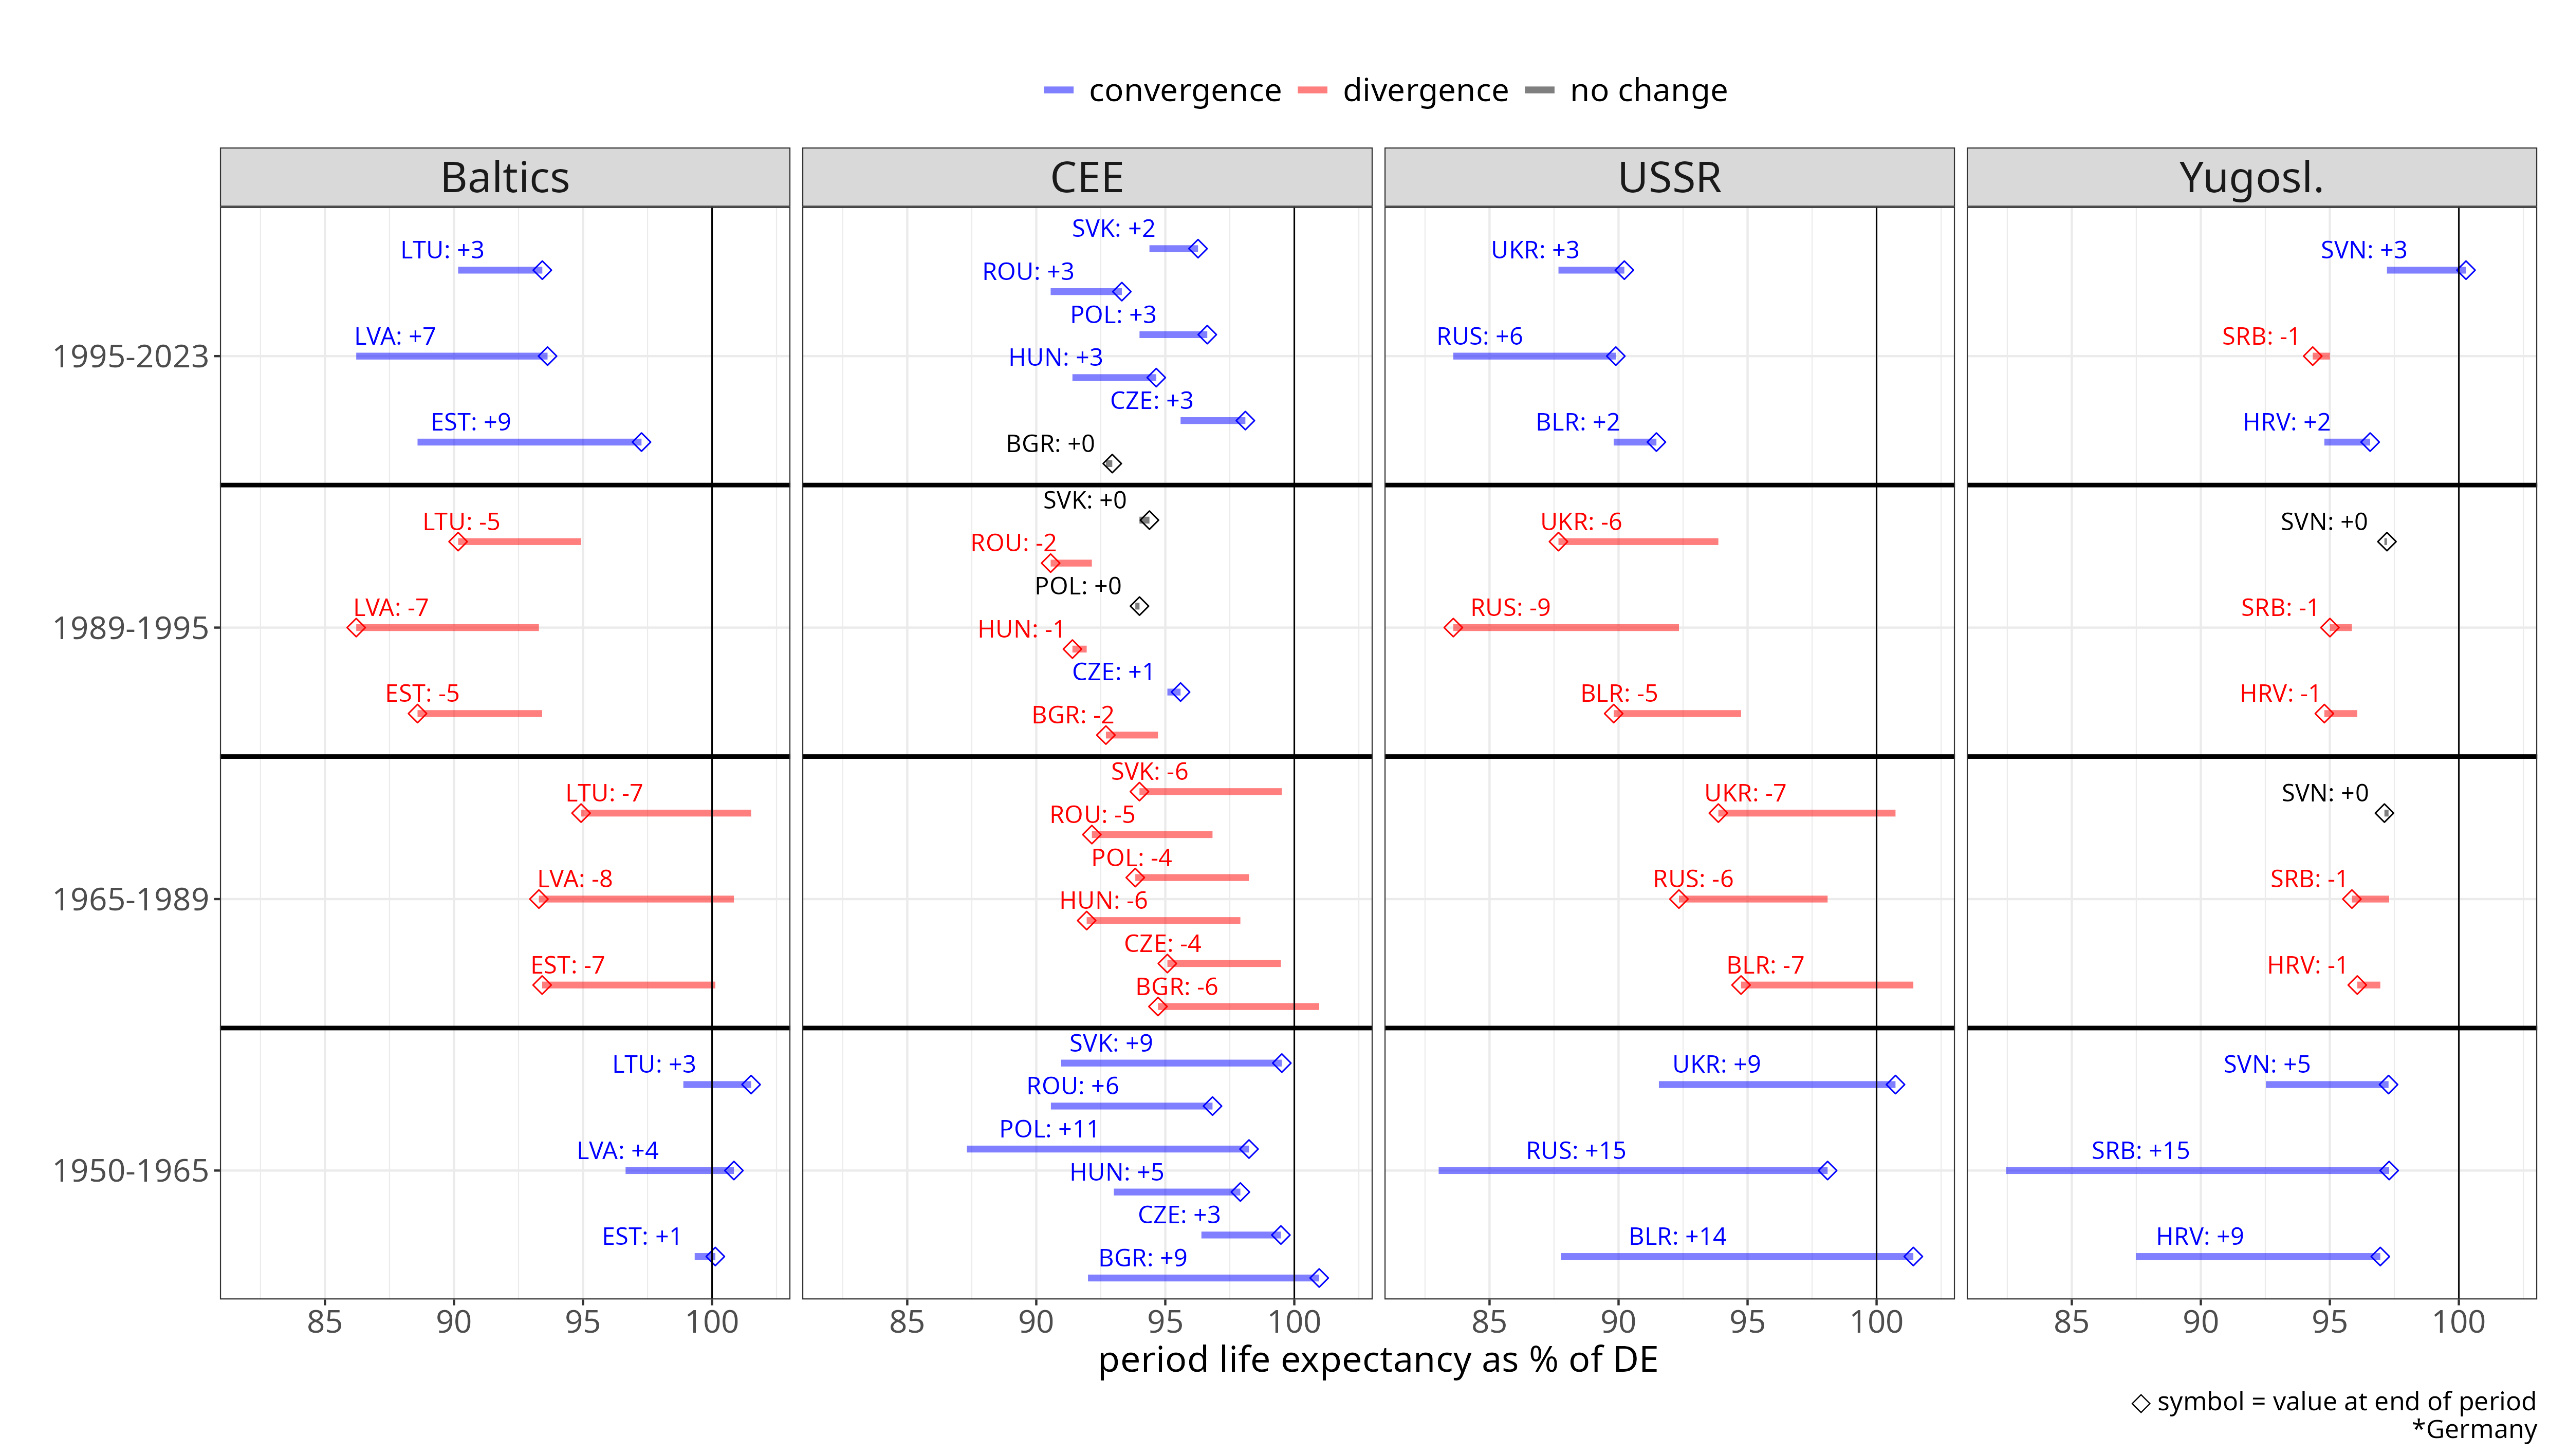
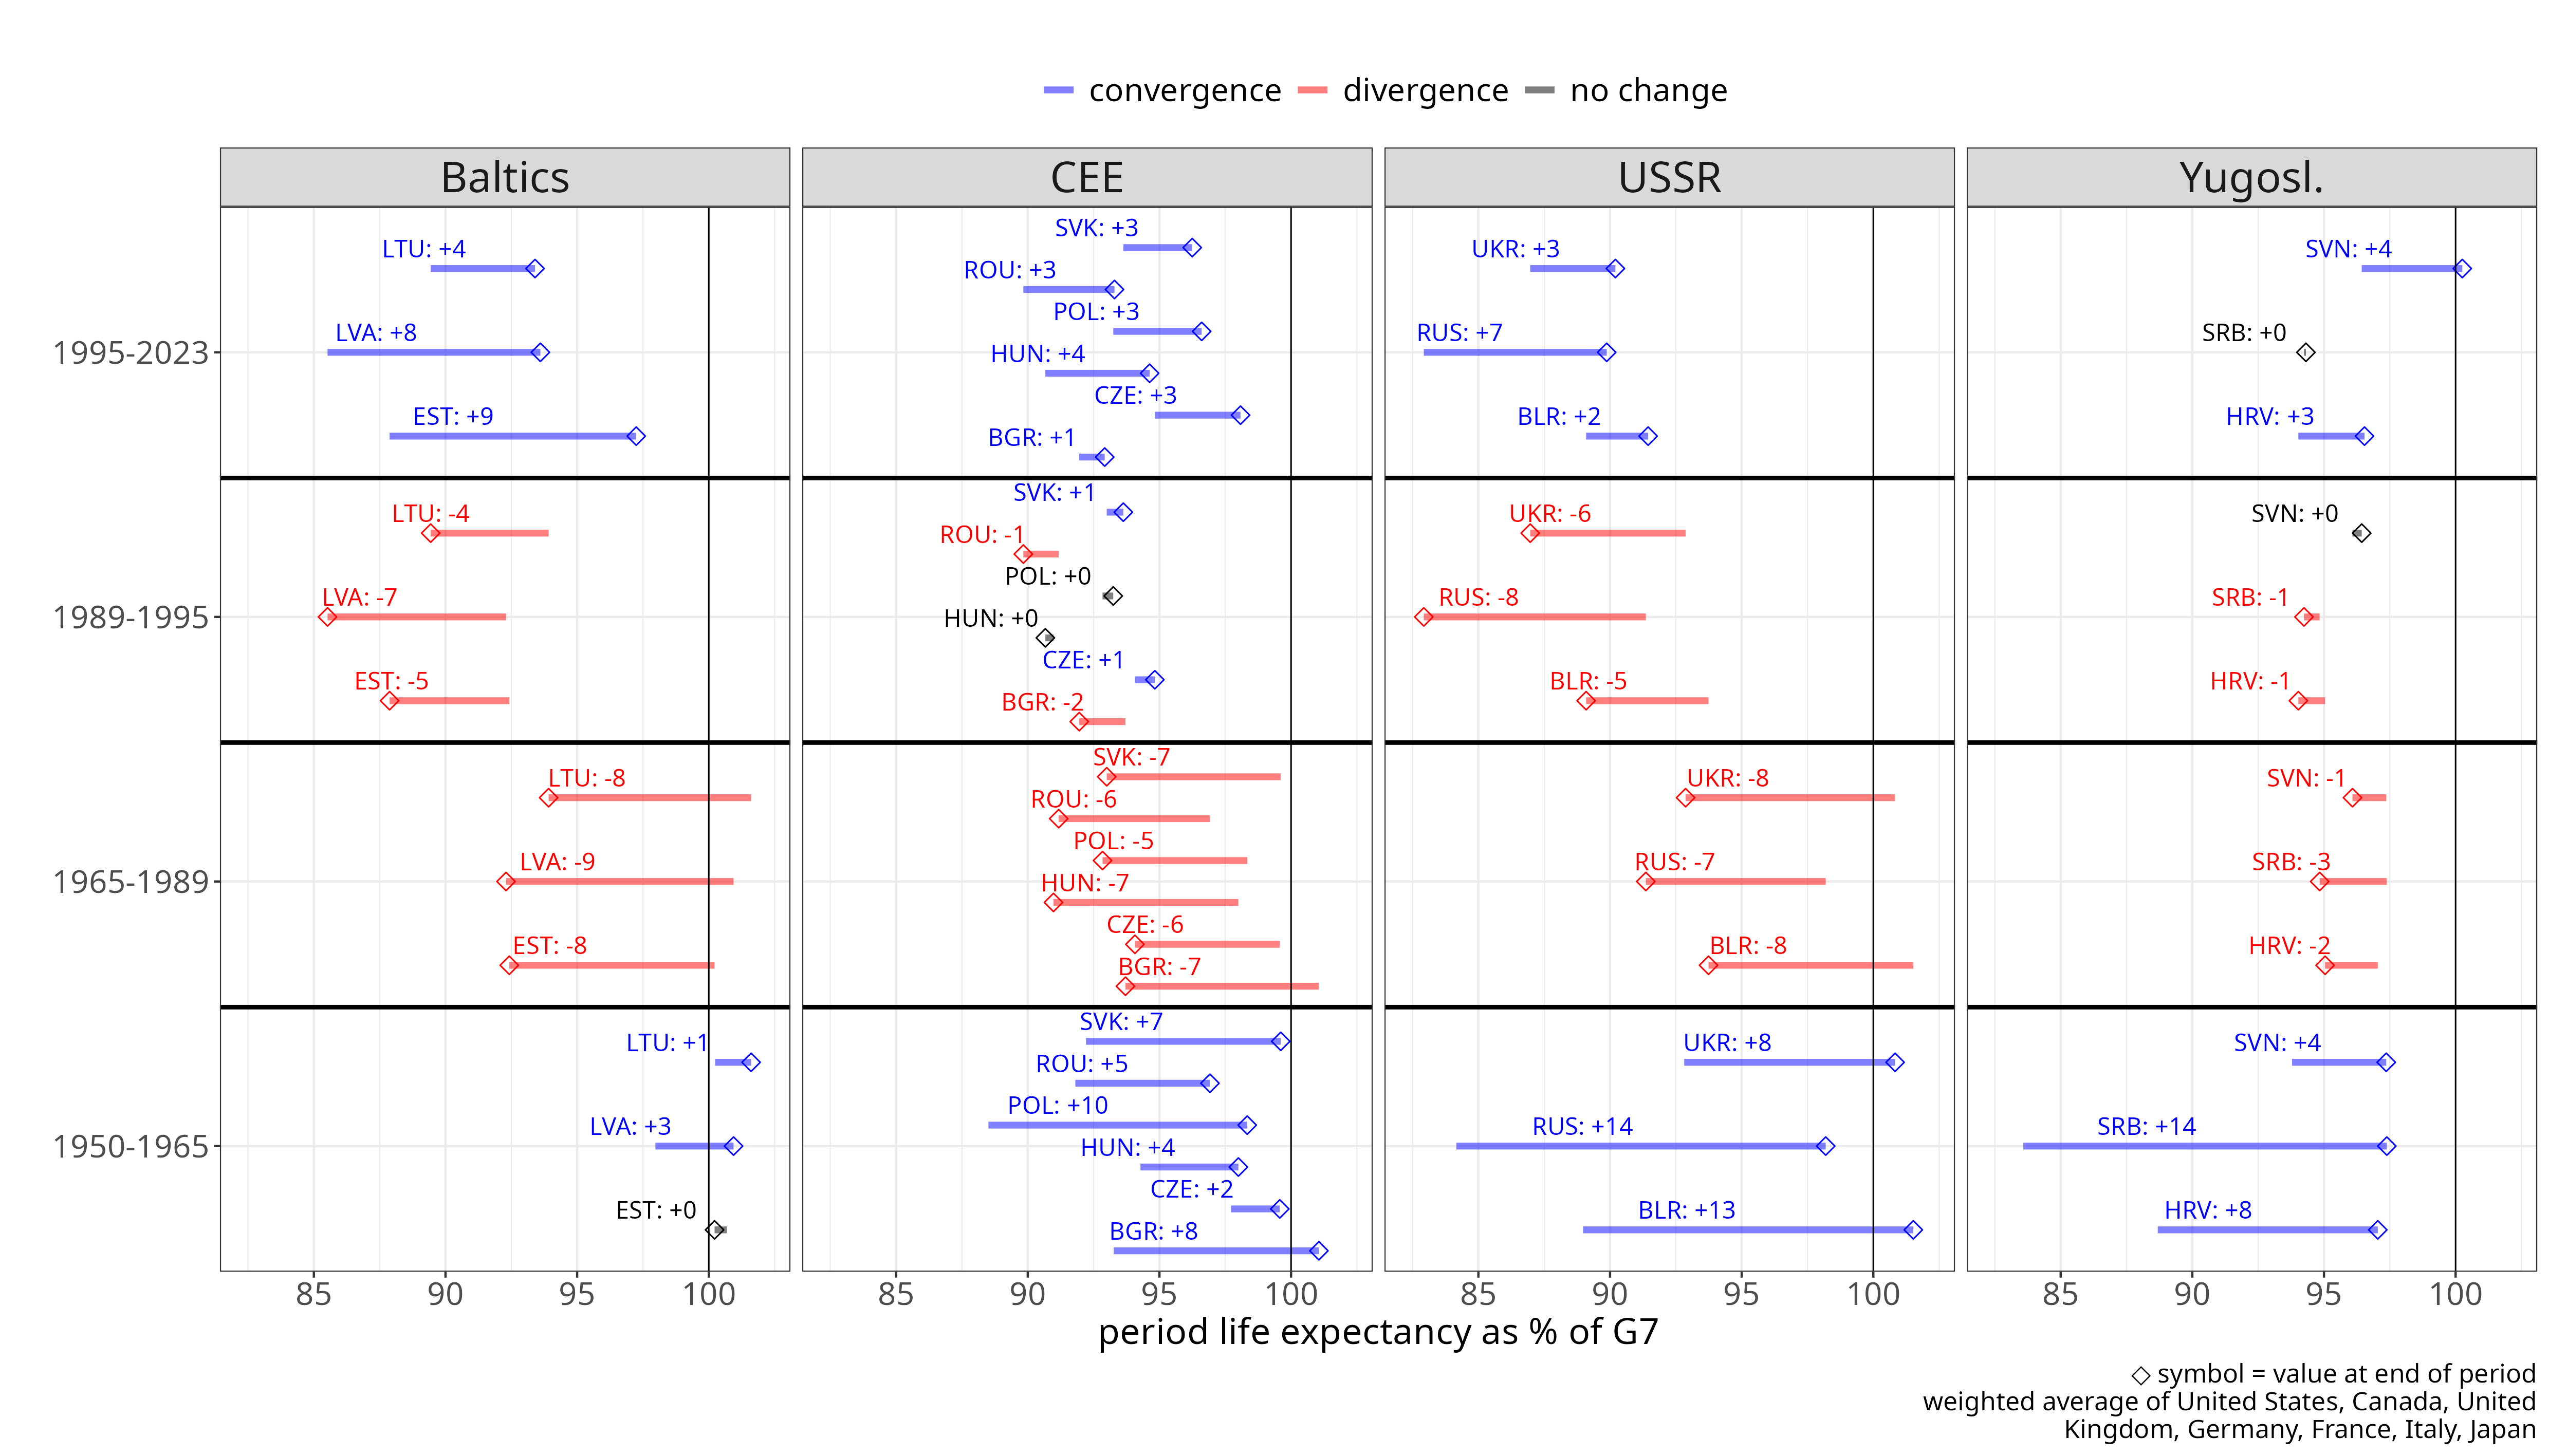
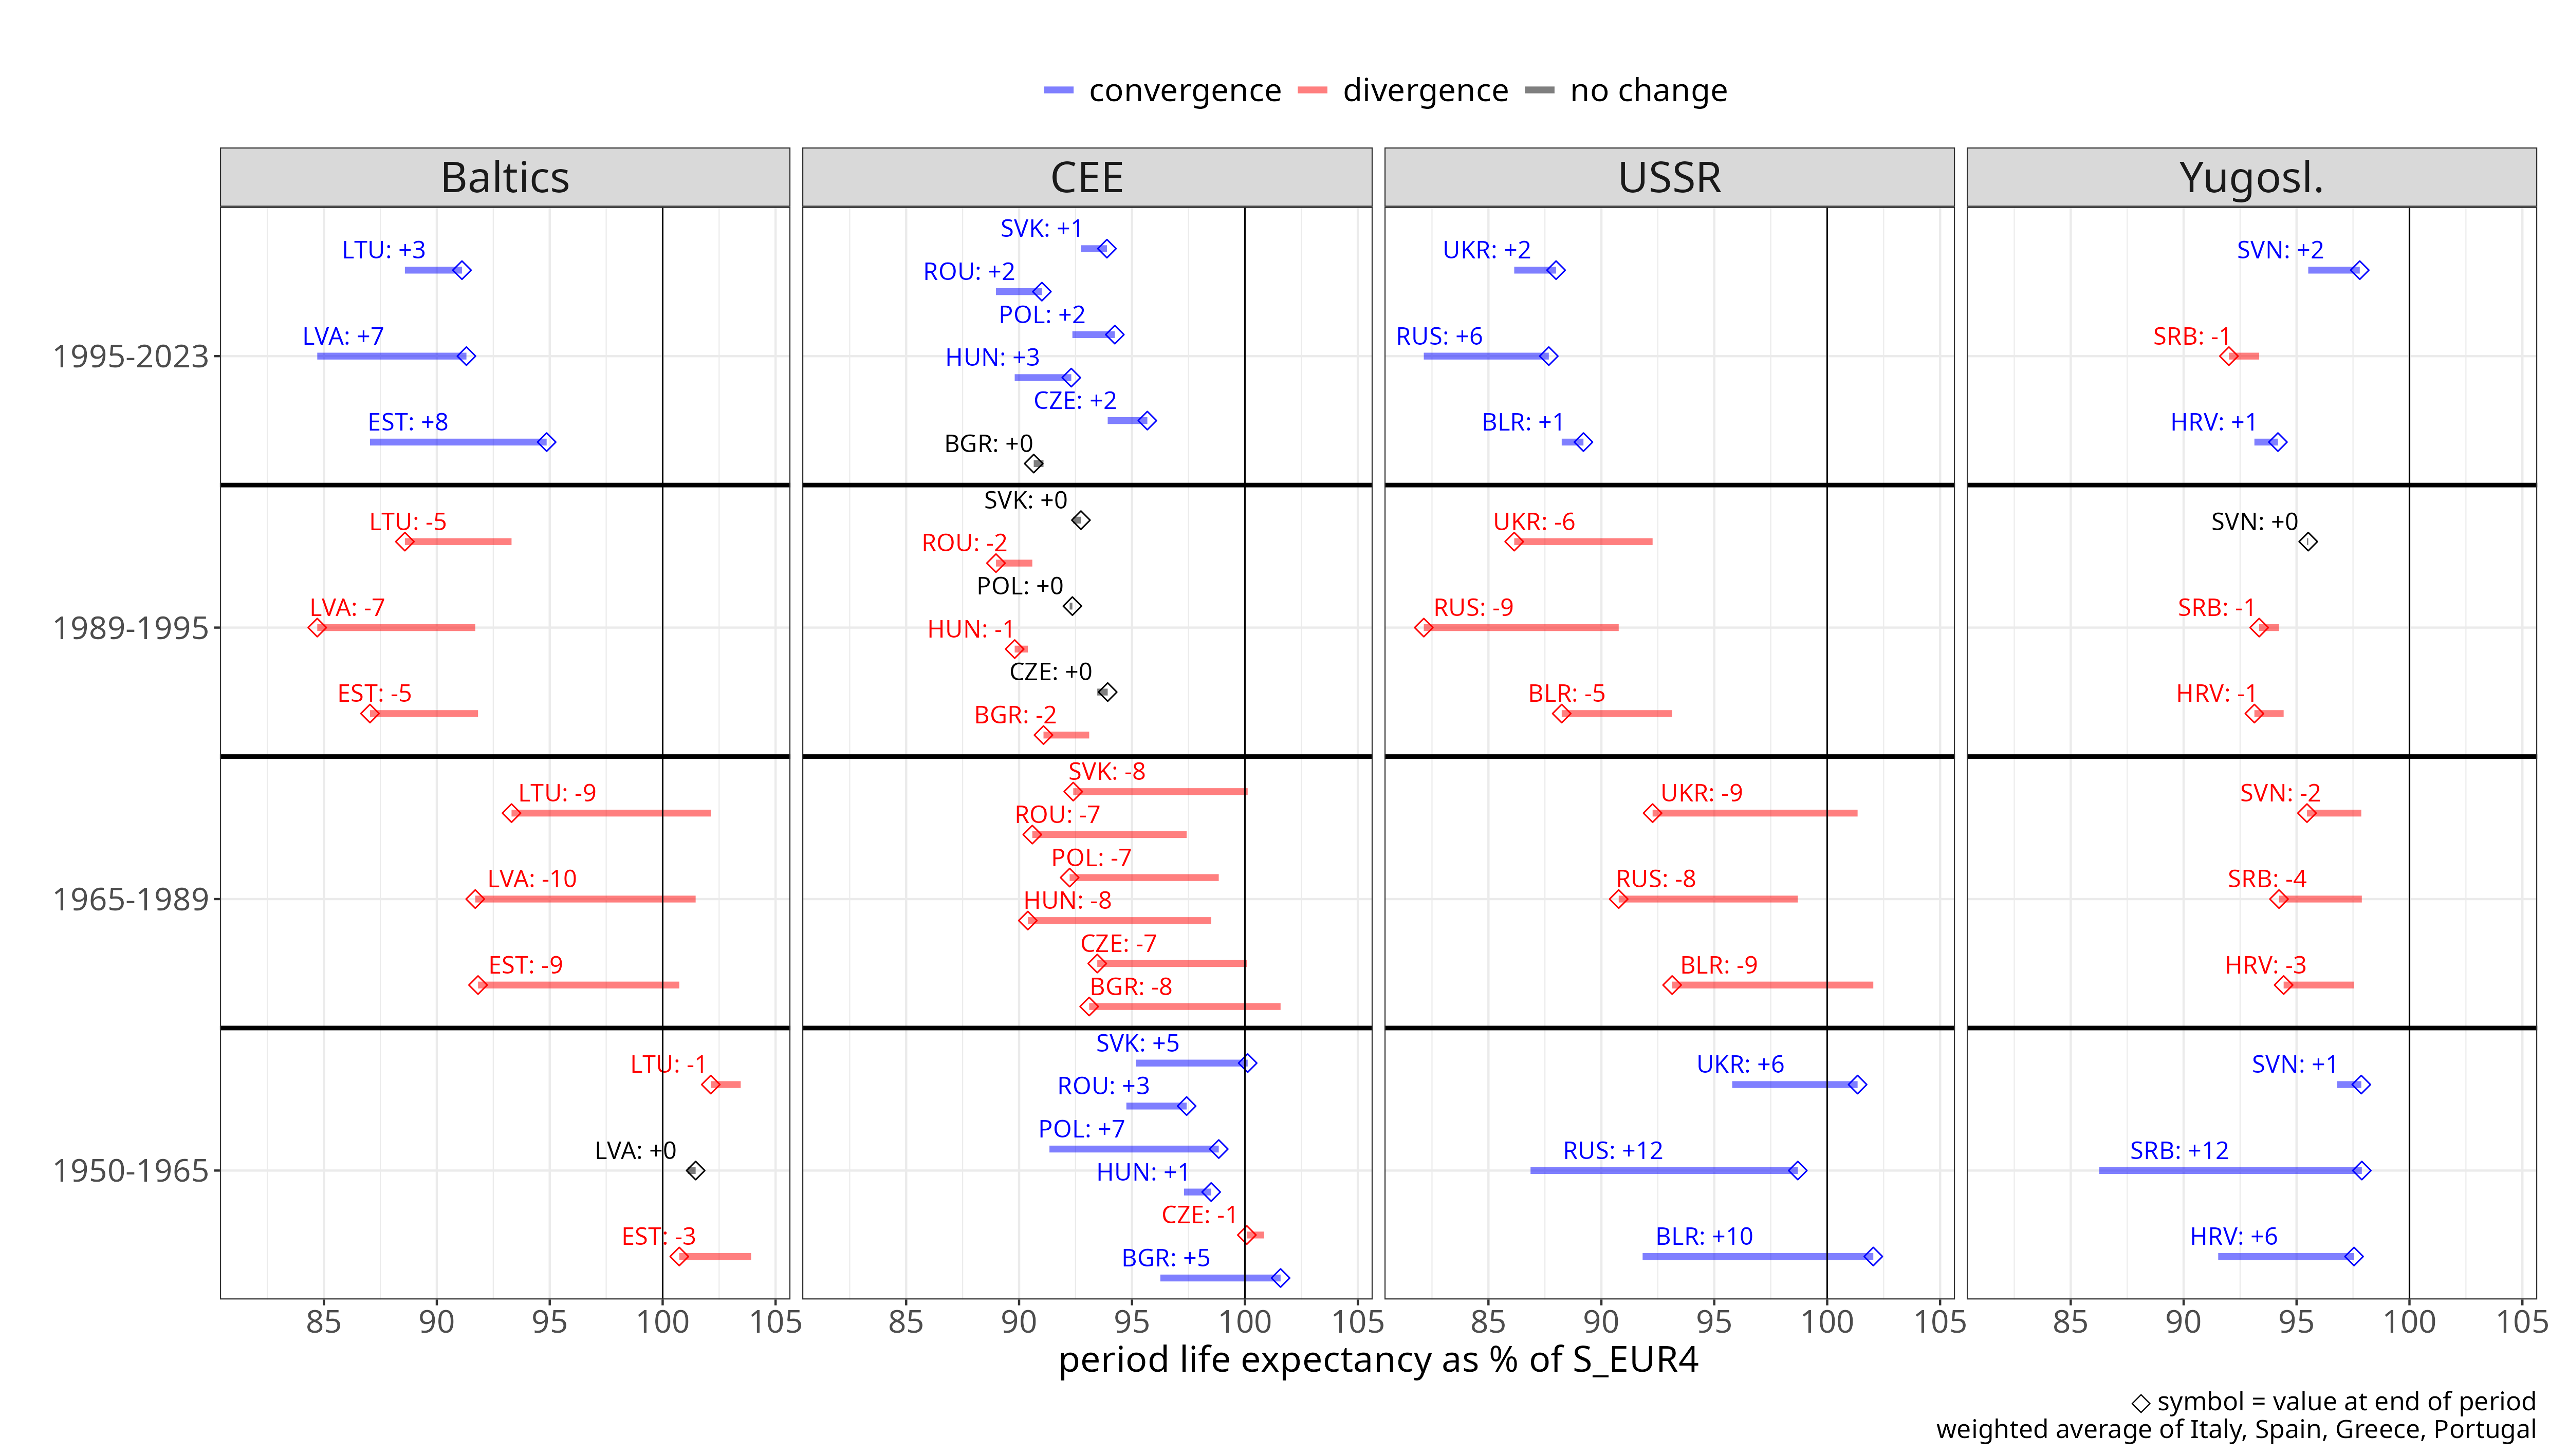
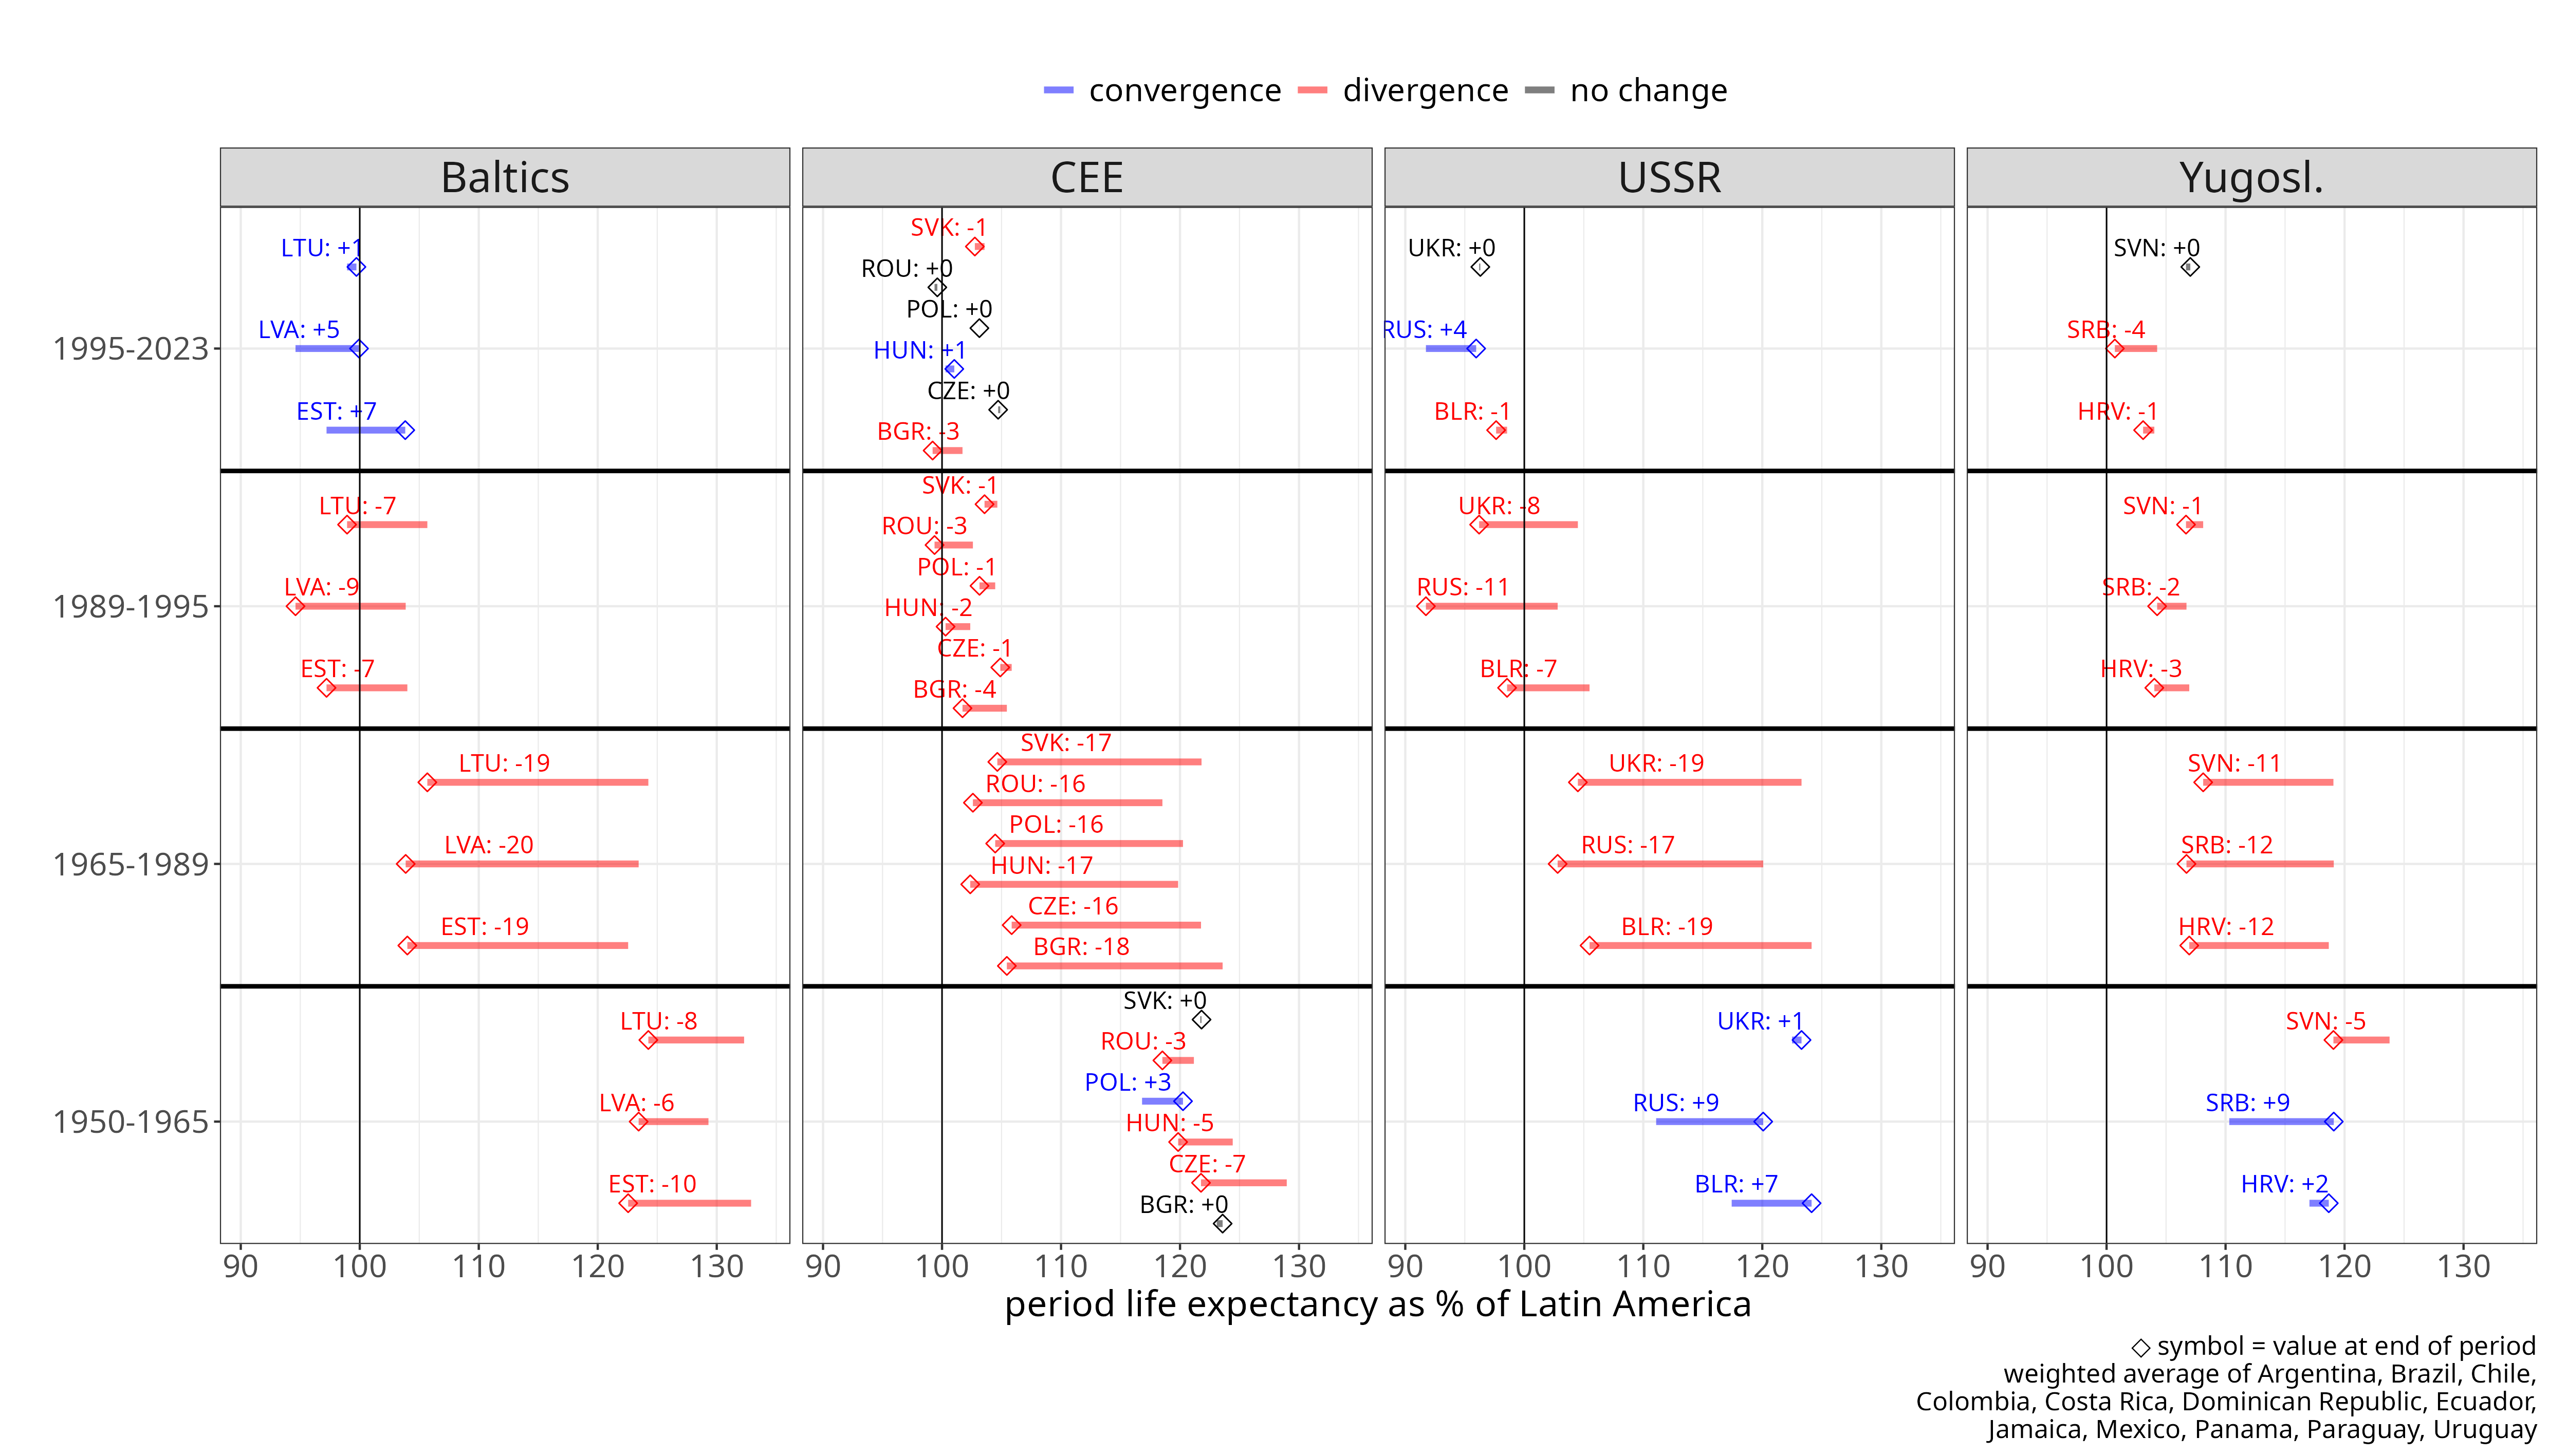
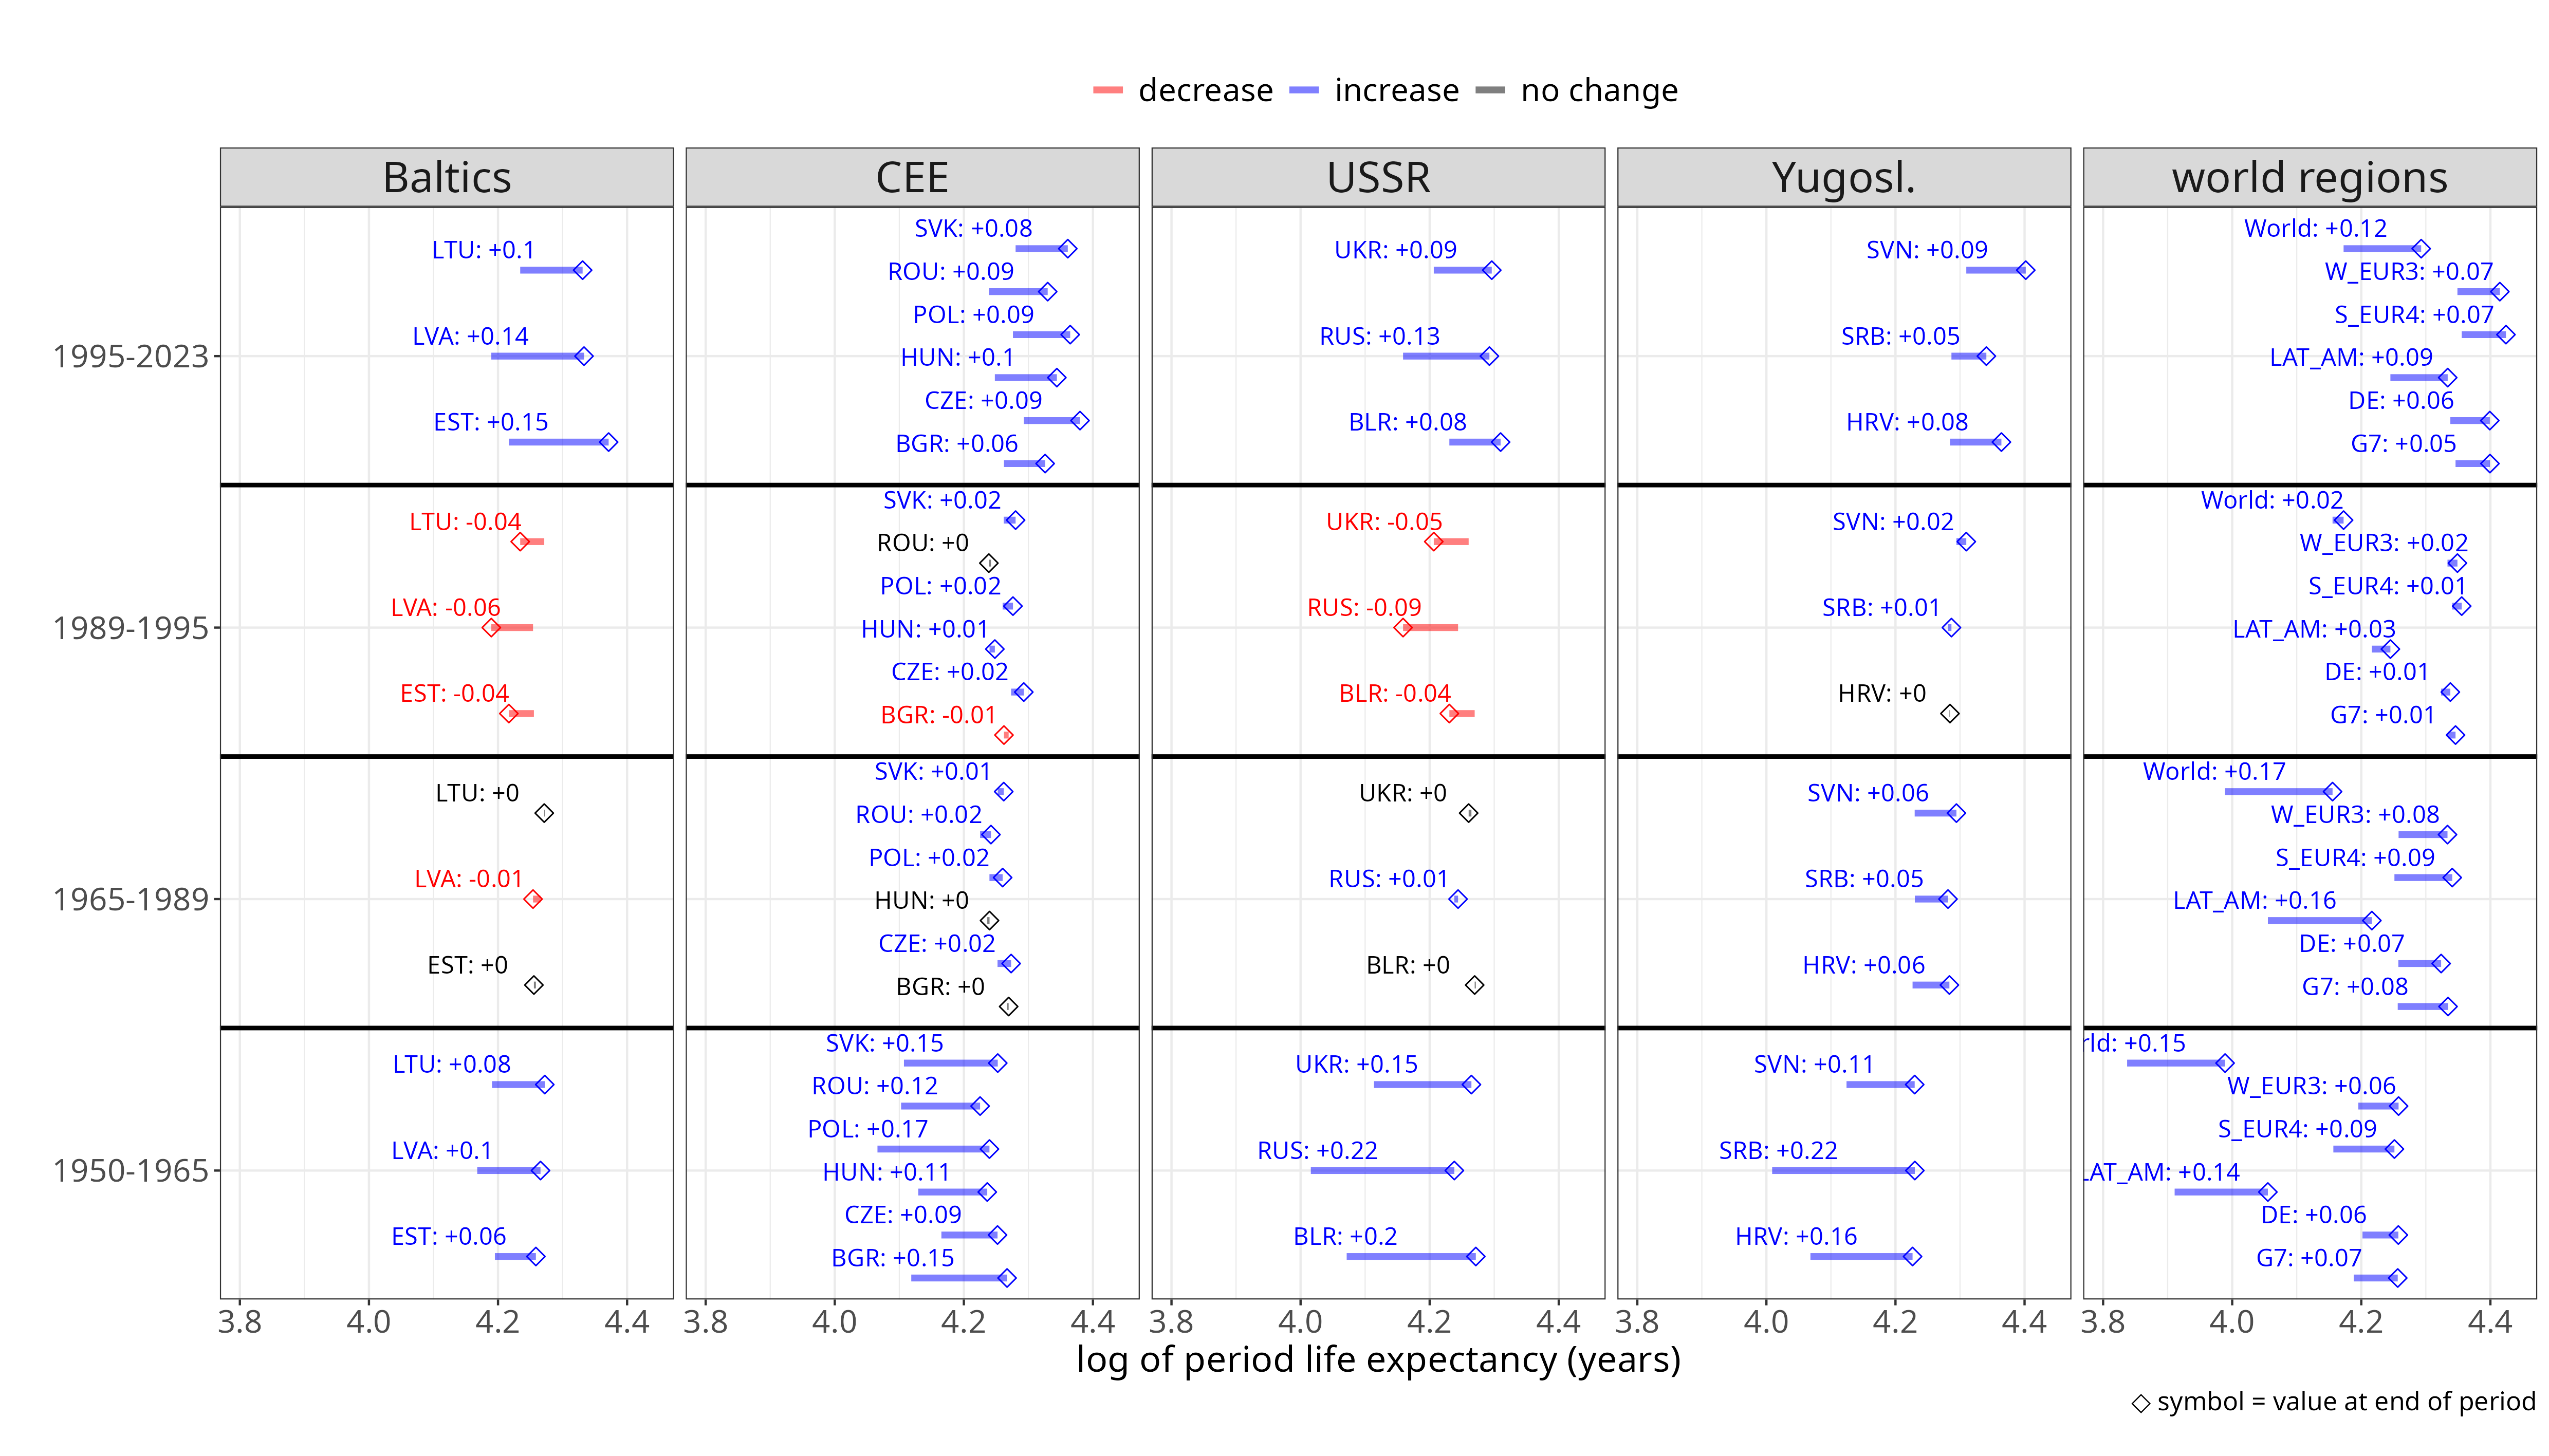
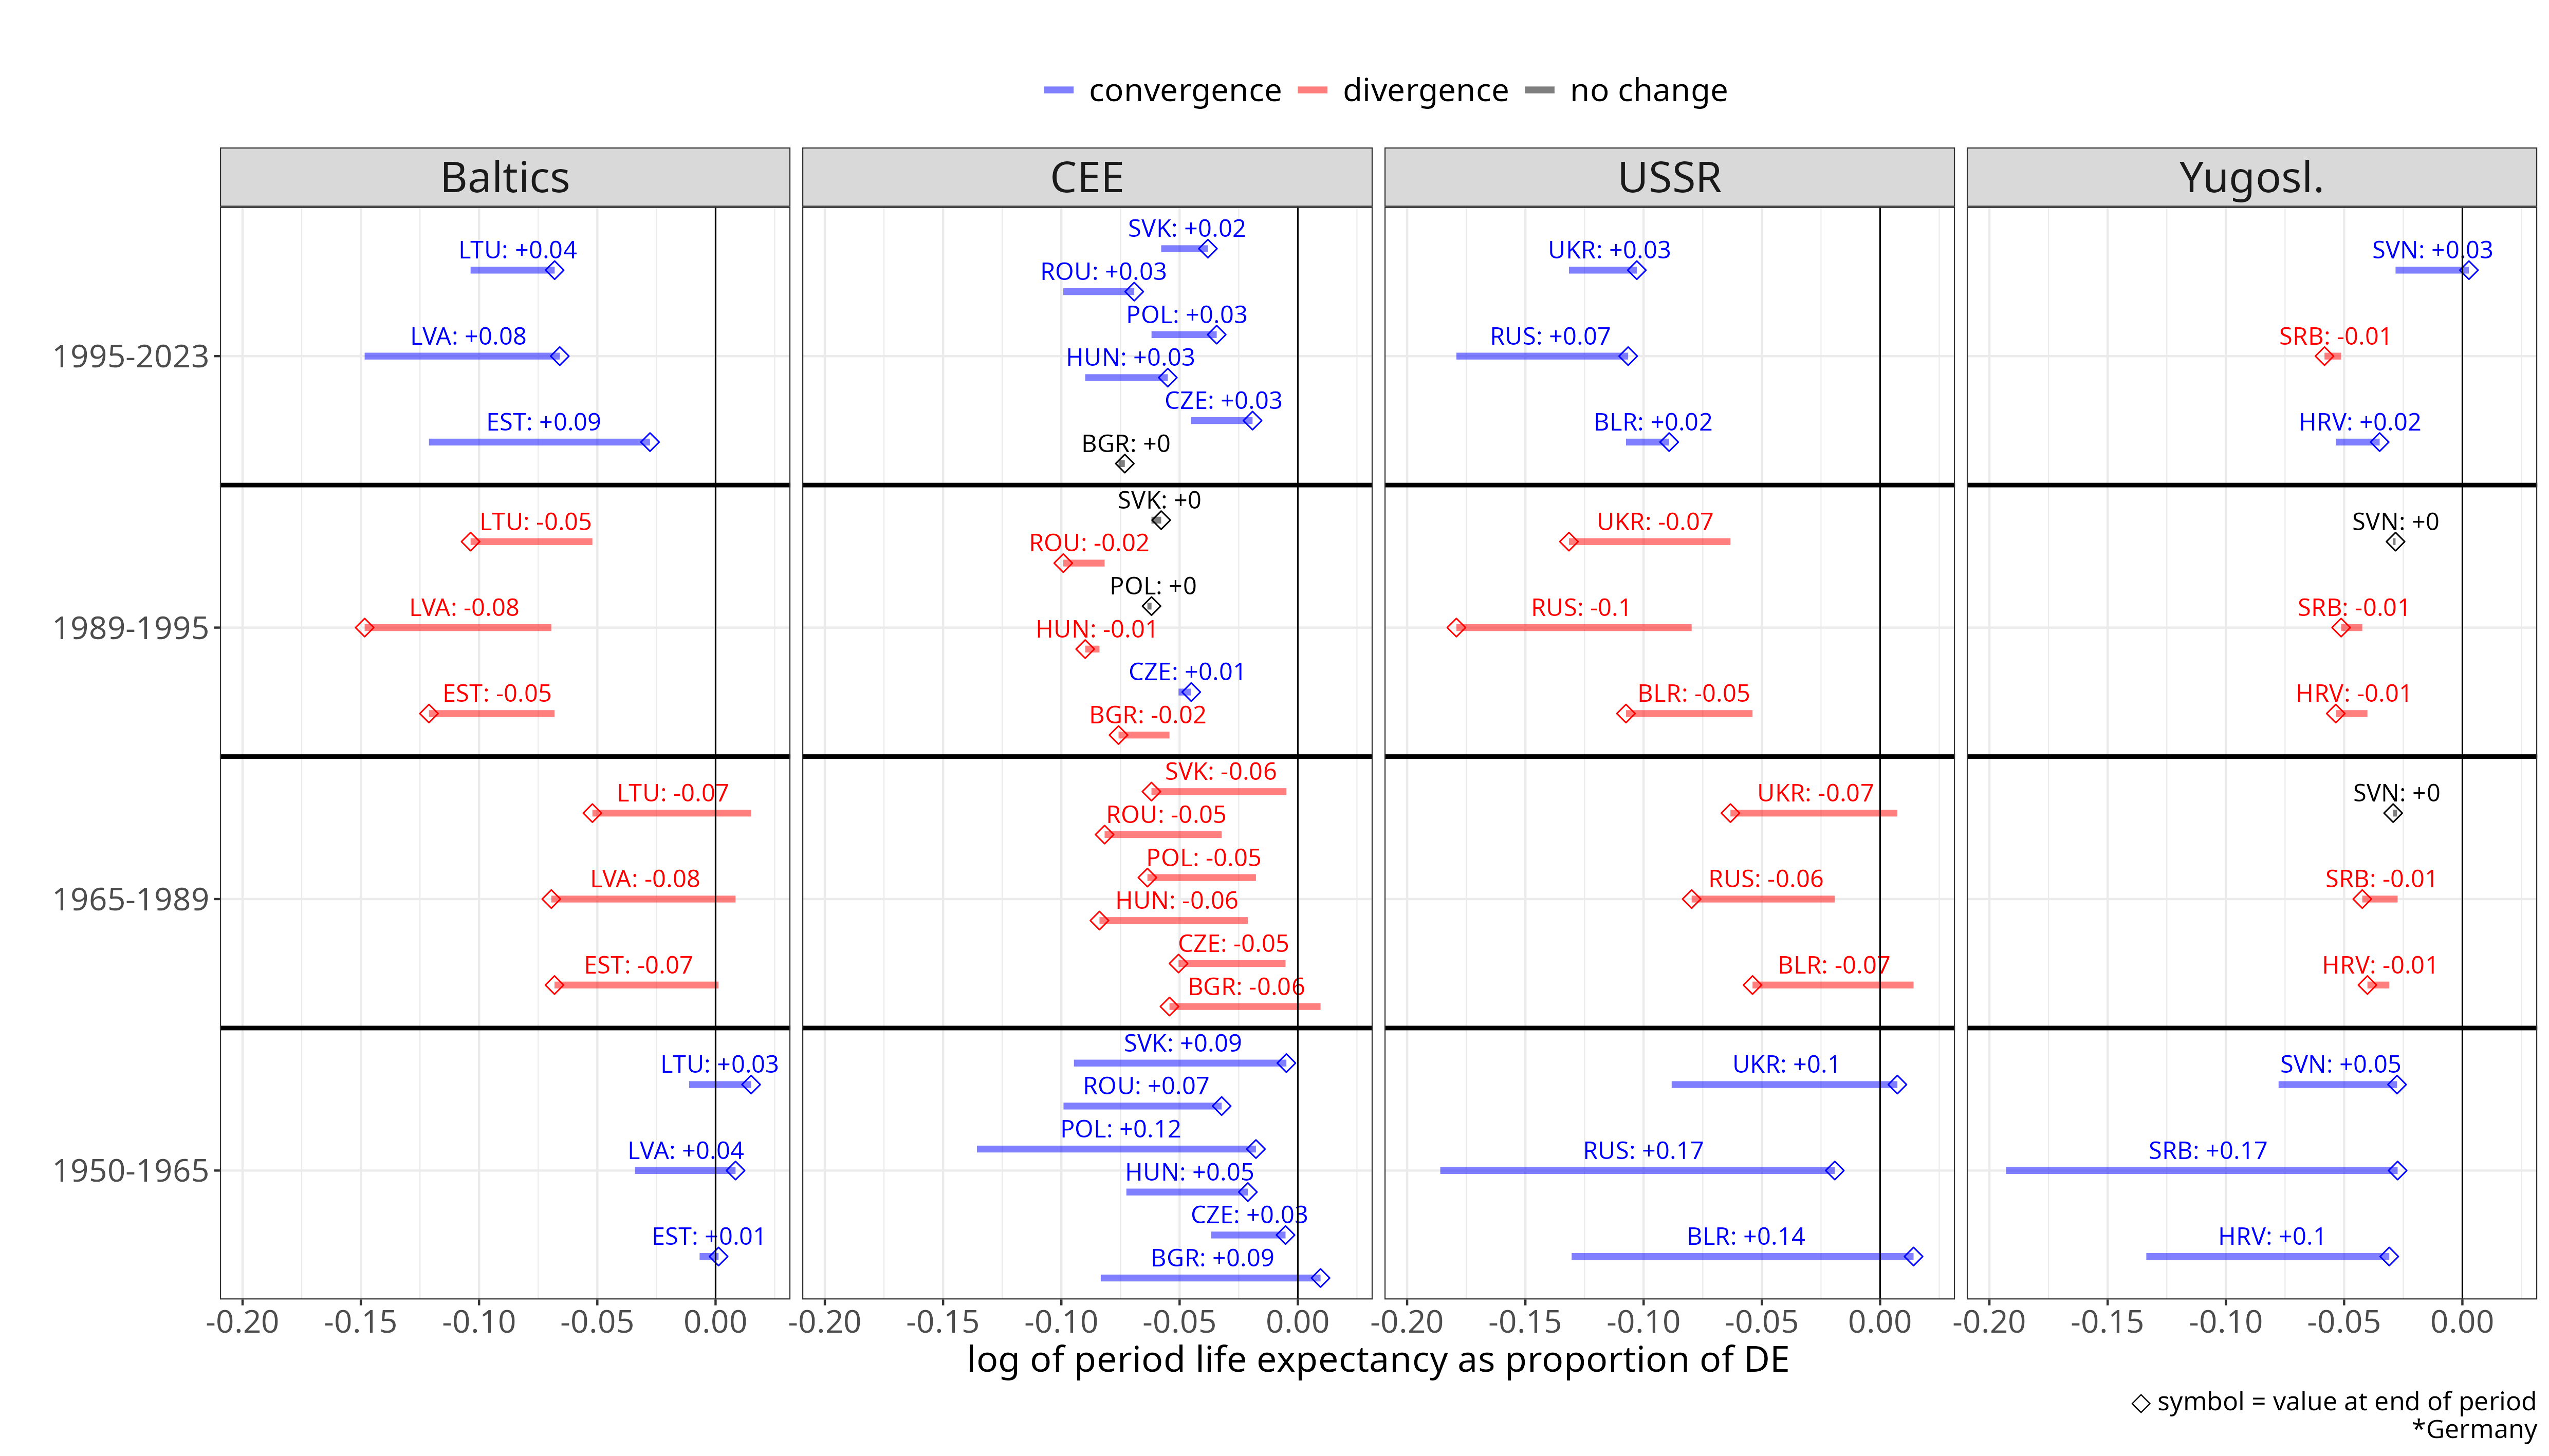
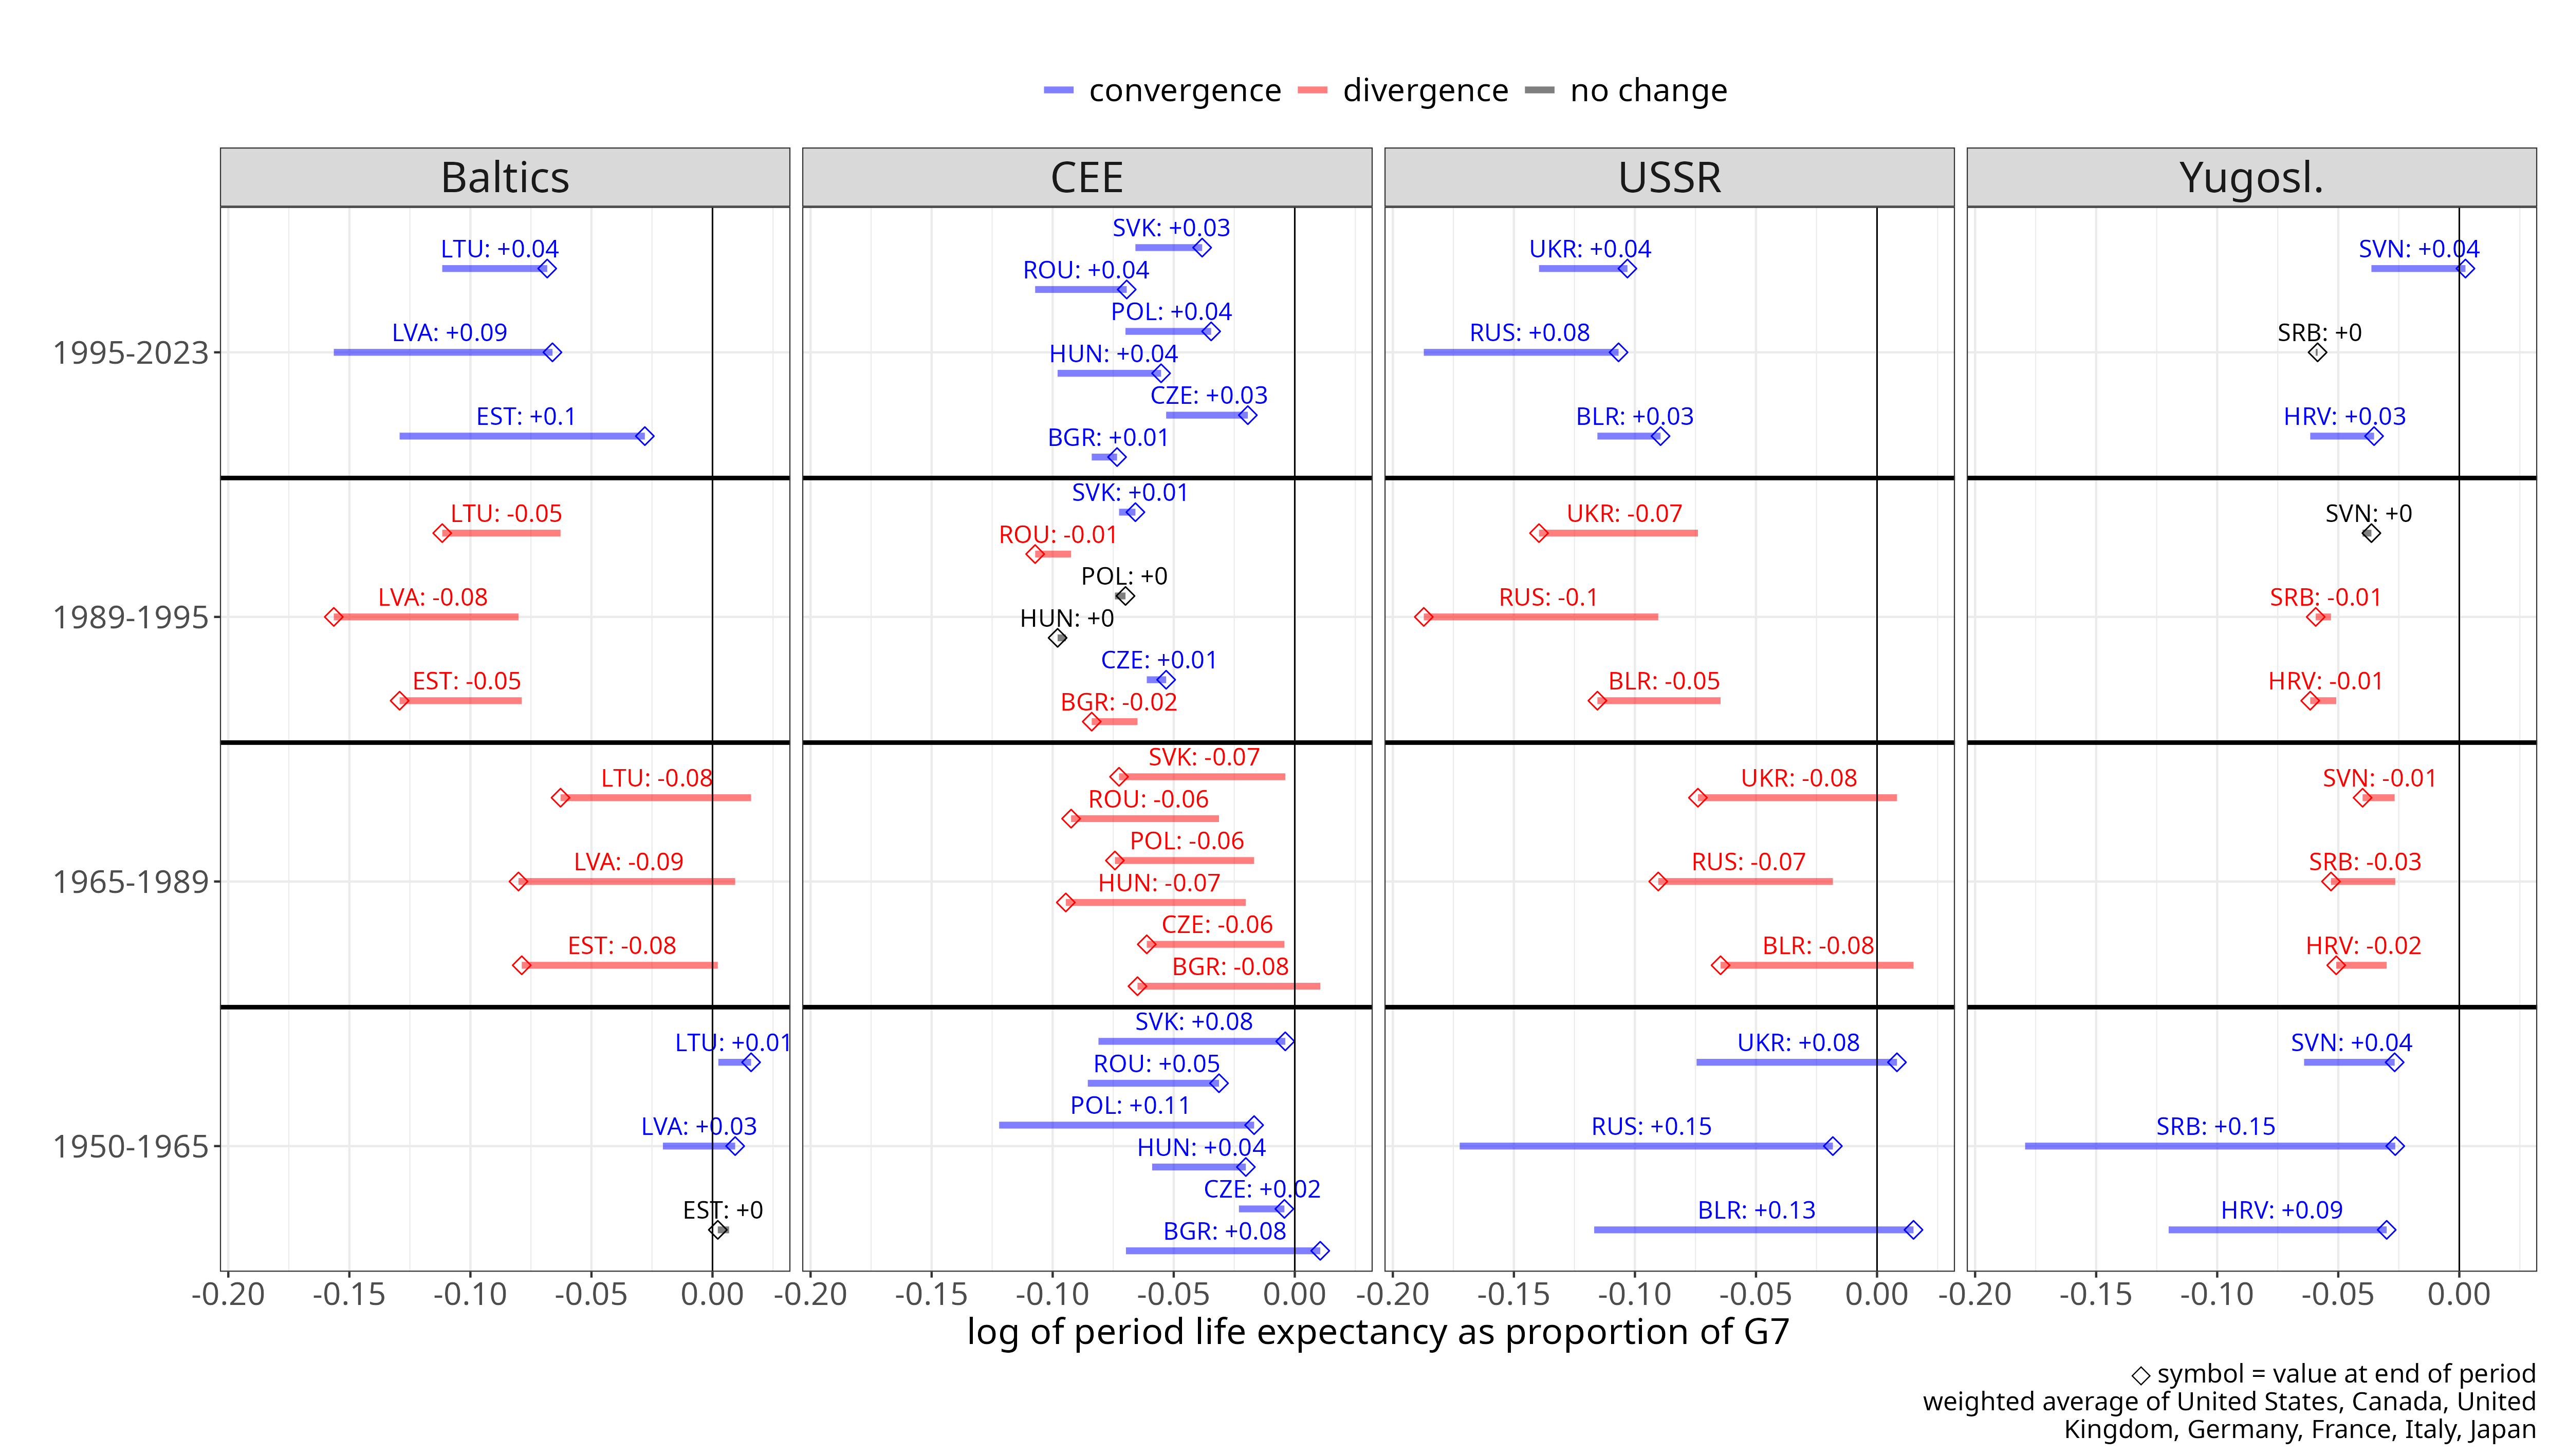
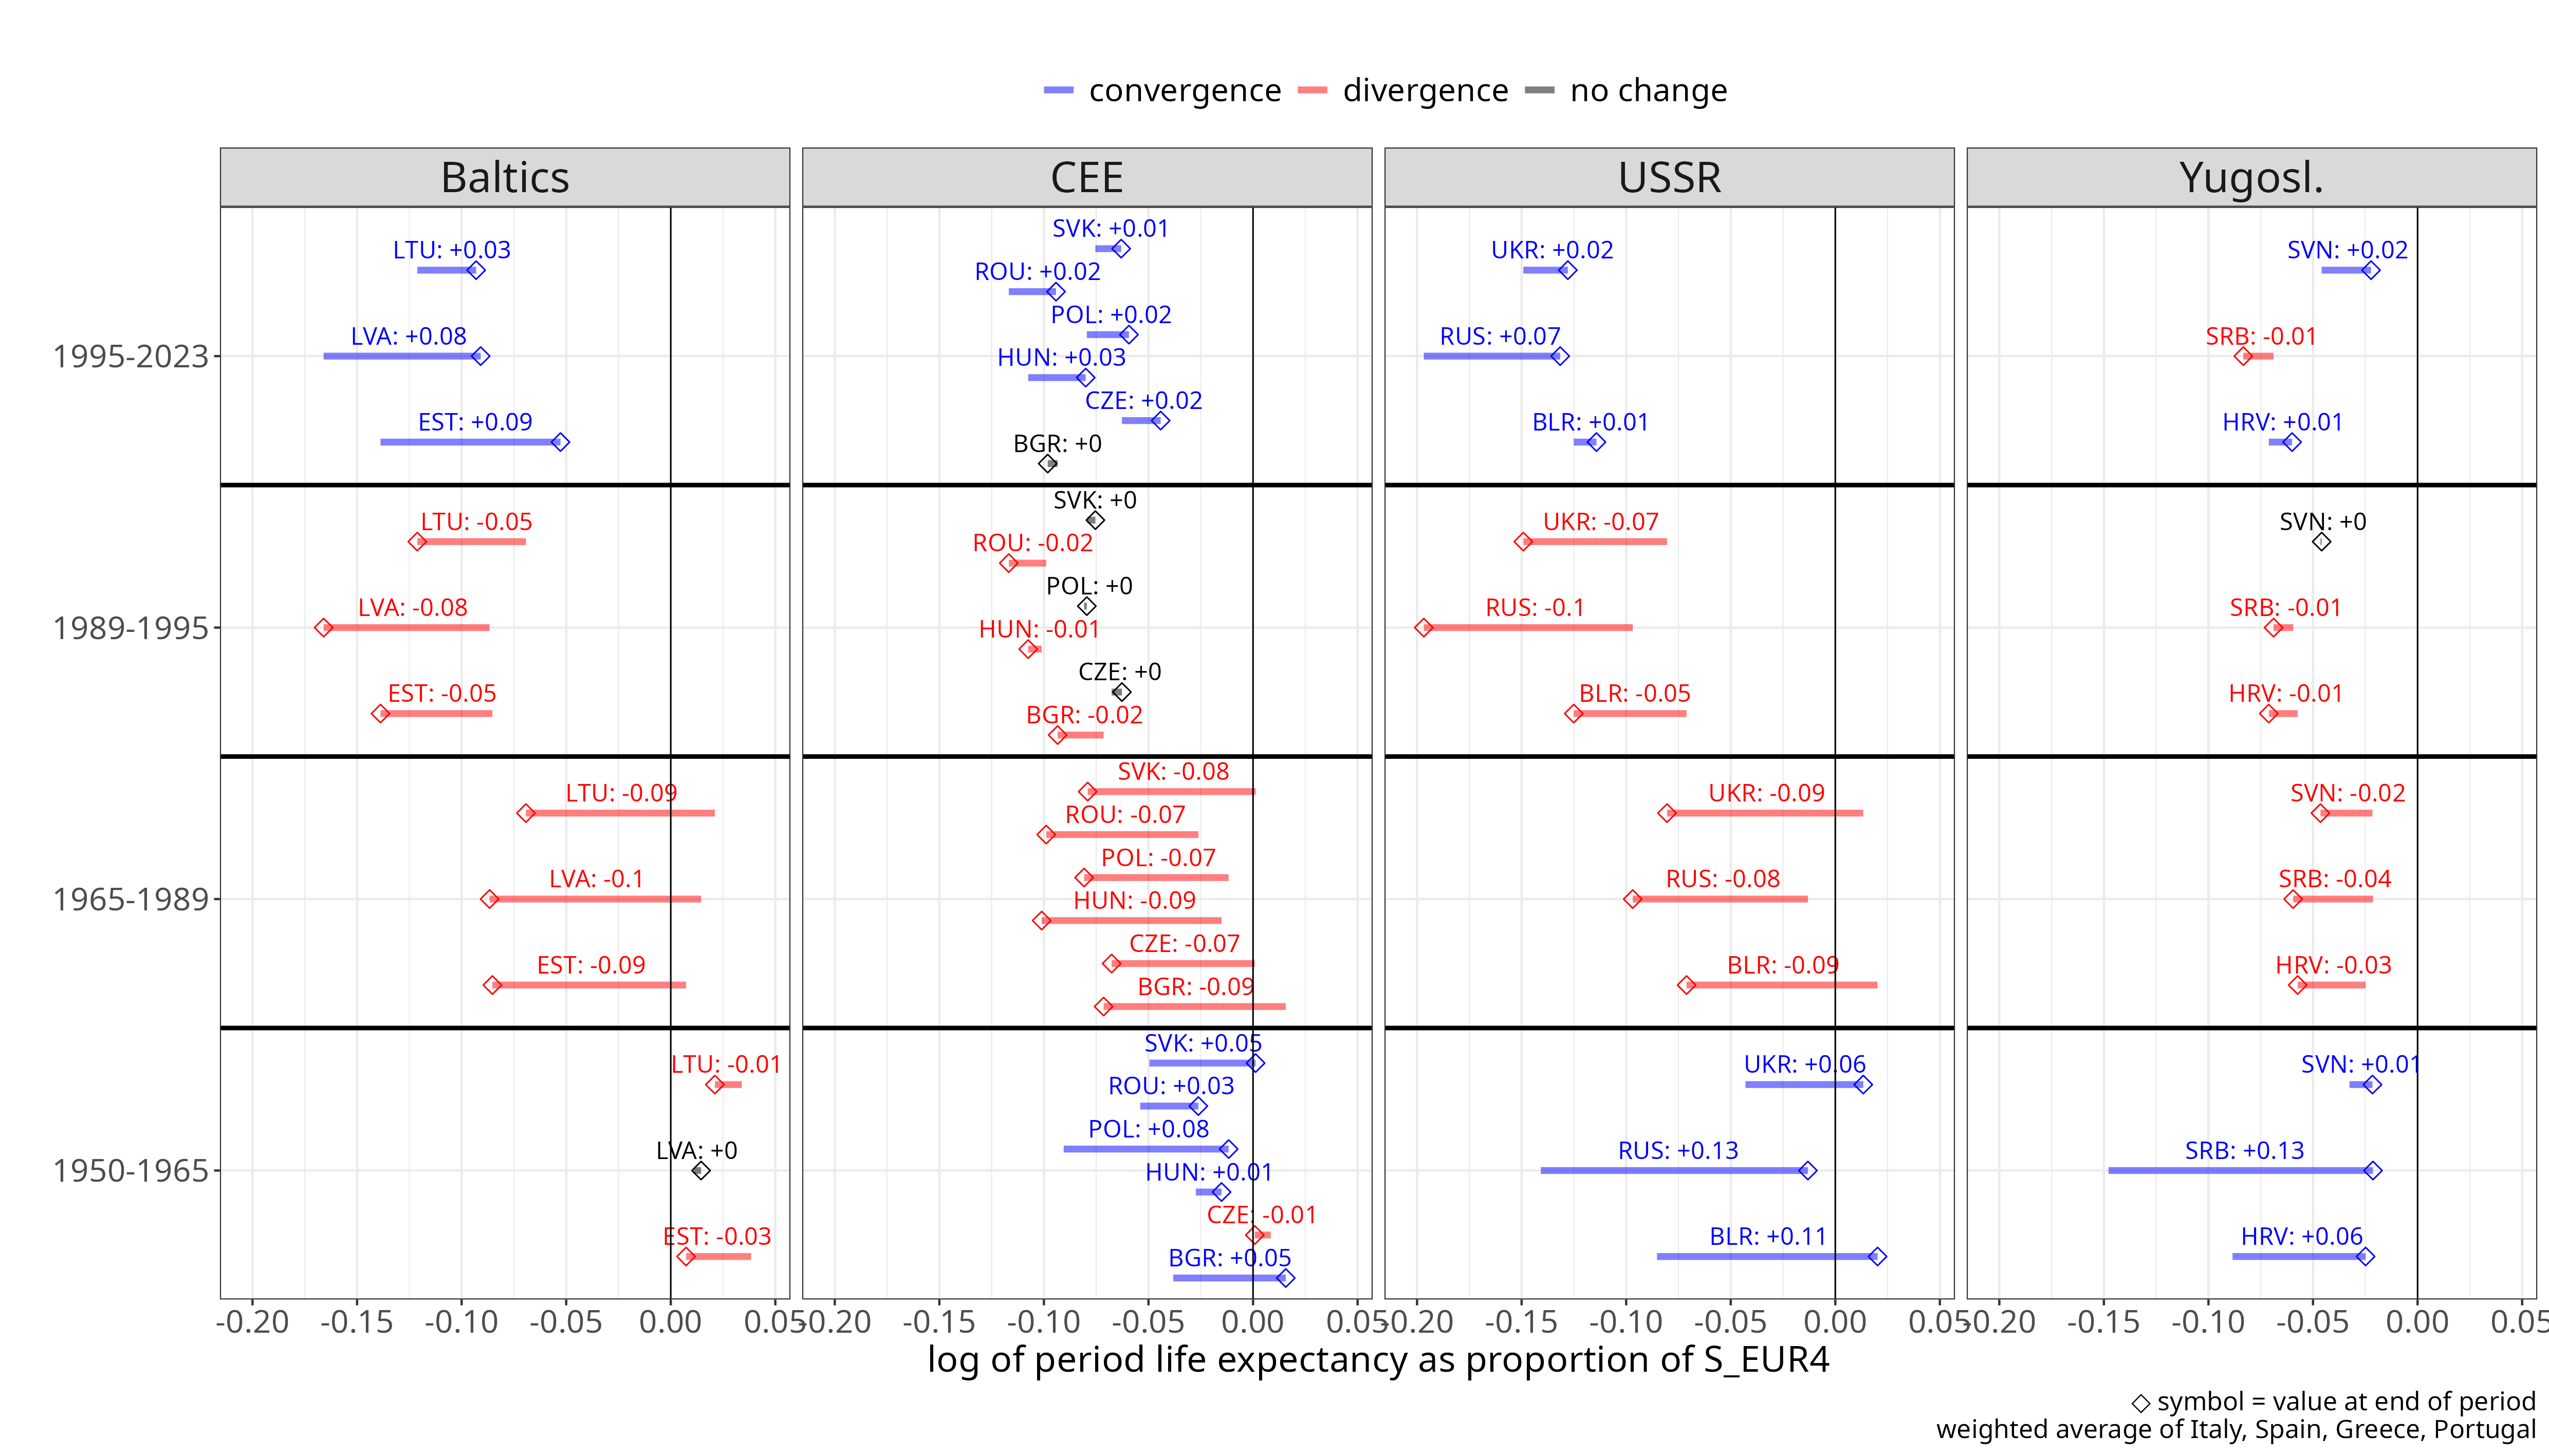
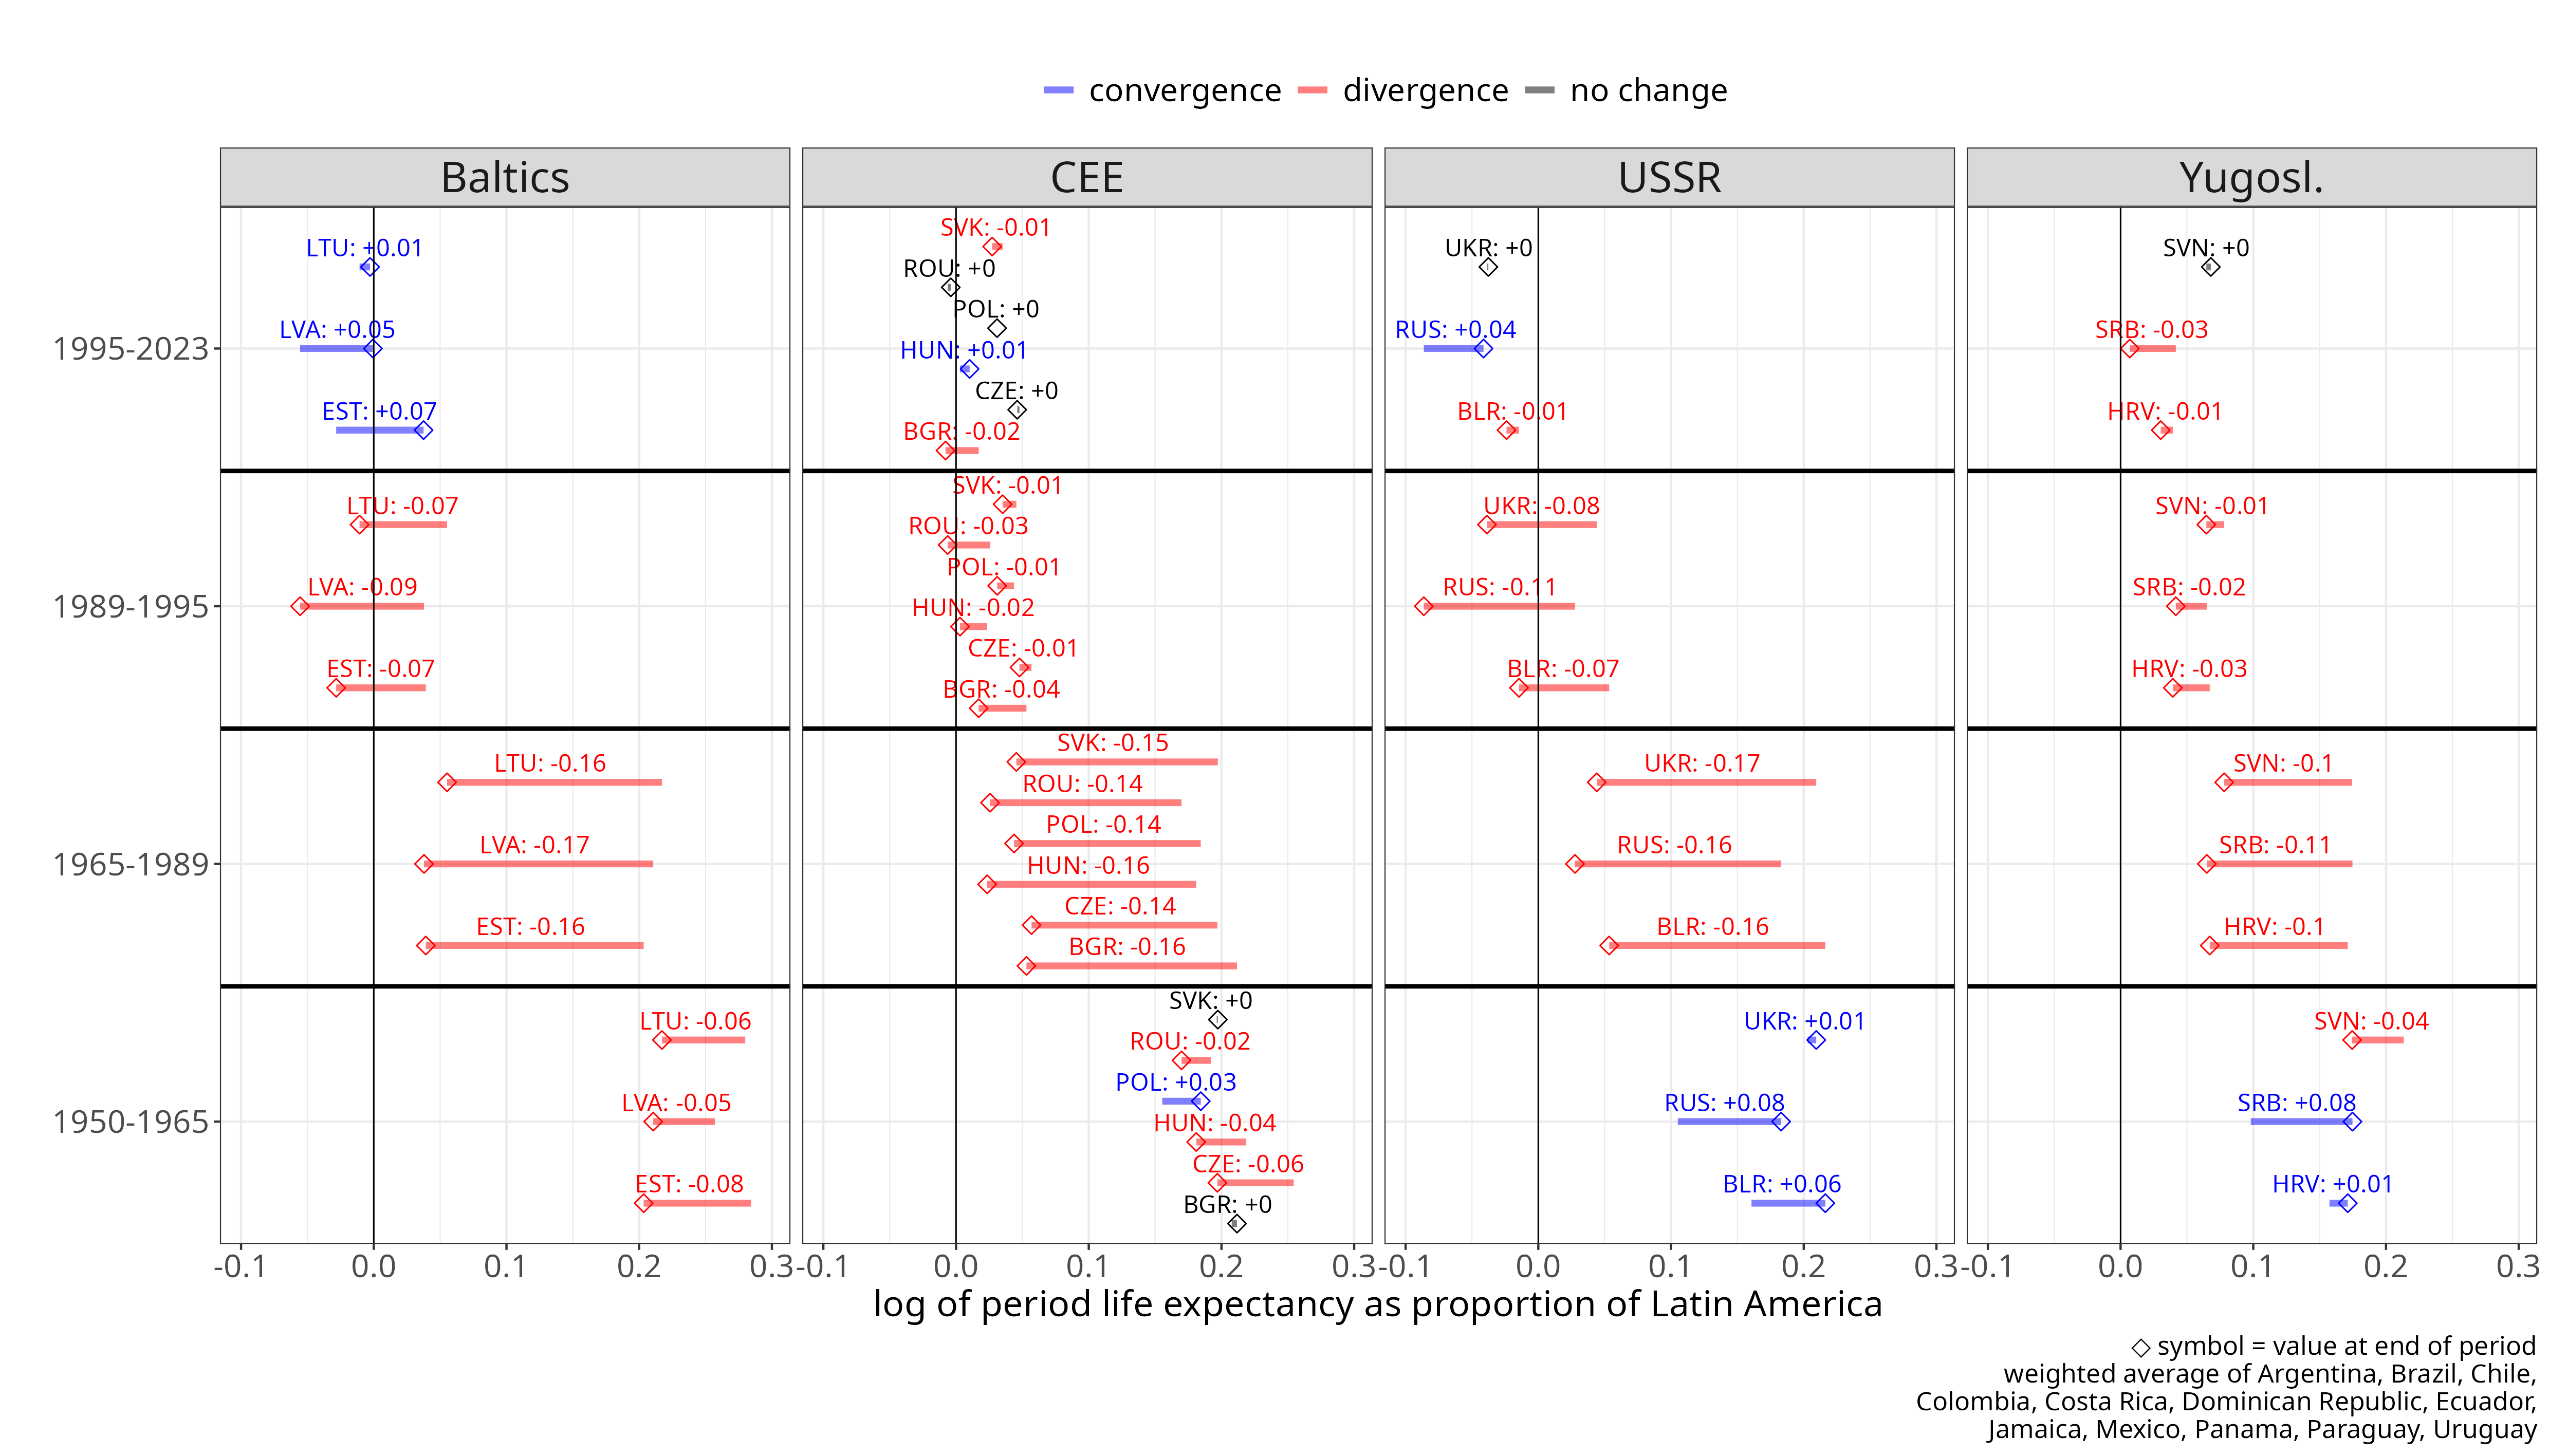
Figure 13 Life expectancy of ex-socialist countries in years, relative to the Western core, Southern Europe and Latin America.
[download plot data]
[source]
In the early socialist era (1950-1965) the socialist bloc saw significant increases in life expectancy, in the range of 6-12 years. In the same period global and Latin American life expectancy also increased by 8 years, whereas in Western Europe only by 4 years (higher initial value in 1950). This meant that the socialist bloc showed convergence to the German level in this period.
However this trend stopped completely in the mid-1960s. What appears to be a unique phenomenon, both relative to peer regions and to the high-income core, is that between 1965 and 1989 life expectancy in the Baltics, Central and Eastern Europe (CEE), and the former USSR did not increase at all. The only exception to this were the countries of former Yugoslavia, which still experienced gains of around 4-5 years over this quarter century period, which was still only about half of Latin America or Souther Europe’s gains. This stagnation occurred in a global context where life expectancy rose by roughly 10 years worldwide and in Latin America, by about 7 years in Southern Europe, and by 5-6 years in Germany and the G7. As a result, CEE countries (along with the Baltics and Russia, Ukraine, and Belarus) experienced a relative decline in life expectancy compared with Germany, the G7, Southern Europe, and even Latin America from 1965 to 1989.
During the transition recession, life expectancy in CEE remained largely stagnant (-1 to +1 year), while the Baltics (-4 to -3 years) and Russia, Ukraine, and Belarus (-6 to -3 years) experienced declines. These losses were likely related to the severity of the transition recession in the ex-Soviet bloc.
From around 1995 onward — and even earlier in some CEE countries, like Poland — life expectancy began to rise again across CEE.
From 1995 to 2023 life expectancy increased by roughly 5-7 years in CEE, by around 10 years in the Baltic states, and by about 6-7 years in Croatia and Slovenia.
As a result, CEE countries resumed convergence toward the life-expectancy frontier defined by Germany and the G7, with Slovenia reaching the German level and most other CEE countries attaining more than 95% of it.
The reasons behind these trends would need an analysis on their own, we can only provide a very brief outline here.
Socialist health systems were good at controlling infectious diseases and basic care, so early on they managed to substantially reduce child mortality and avoidable deaths from infectious disease. It needs to be said that something similar also happened in Latin America and Southern Europe after WWII, so these gains were not unique, yet they were subtantial and often somewhat larger than in LAT_AM and S_EUR.
However, once these basic public health measures were put in place, the socialist system proved inefficient at primary care and prevention and particularly in chronic disease prevention and management, blocking the way to further improvements.
Due to limited access to modern drugs and diagnostics the socialist bloc did not see the large improvements in treatment of cardiovascular diseases that occurred in the West from the late 1960s. In addition, shifts to a healthier diet and a decline in smoking that were ongoing in the West also did not occur in the CEE/USSR until later. Finally, consumption of alcohol and in particular strong spirits remained very high in the socialist bloc, especially in the USSR, pushing up alcohol-related mortality rates.
Pollution due to environmentally careless industrialisation and weak safety standards in workplaces and on roads might have played a role too.
Overall, the upshot was that the socialist system was not only incapable of keeping up with life expectancy improvements in Western and Southern Europe following the mid-1960s, but life expectancy flatlined completely from the mid-1960s to 1989, something that seems unique globally among comparable regions.
Therefore it is not only in economic terms that the socialist bloc was falling behind Western and Southern Europe from the 1970s, but also in life expectancy from the mid-1960s, where absolute stagnation set in already from the mid-1960s across CEE and the USSR, in a global context of increasing life expectancy.
Conversely, resumed life expectancy gains from the early to mid-1990s in CEE and Baltics reflect a complex set of factors, but are at least in part closely related to the transition to a market-based system.
Access to modern drugs and diagnostics, liberalised food markets leading to shifts in diet, and - after a few years of transition - income growth and improving living standards all plausibly contributed, alongside institutional and regulatory convergence with Western Europe associated with European integration.
Each of these would require detailed analysis. What we can say with some confidence is that these changes were enabled by the transition to a market economy, while previously the socialist state had been incapable of adopting them for a quarter century.
Discussion
We reviewed a range of output, earnings, and income metrics, as well as life expectancy measures, to assess whether CEE countries have shown convergence with the Western core since 1990. We also compared this convergence performance to that of peer countries in Southern Europe, Latin America, Africa, and Asia, and examined how it relates to trends during the preceding socialist era (1950-1990).
During the socialist era, most of CEE experienced a relative decline in GDP per capita compared with Western and Southern Europe. For most countries, this decline stretches back to the 1950s or 1960s. The partial exception to this pattern was Yugoslavia, which did show convergence to Western and Southern Europe up to the late 1970s, but this also stopped and went into reverse from around 1978. From the late 1970s onward all countries - including Yugoslavia - were in relative decline.
For life expectancy we see a similar trend. In the early period of 1950 to 1965 the socialist bloc showed some convergence to the West. However, this trend of improvement stopped across CEE and the USSR from the mid-1960s and was followed by a quarter century of absolute stagnation of life expectancy, something unparalelled both in the Western core and the peer regions of Southern Europe and Latin America.
After 1990 and following a transition recession, trends for practically all variables changed direction.
Life expectancy - after flatlining for 25-30 years - resumed its increase across CEE from the early to mid-1990s, and grew by 7-11 years in the Baltics, and 6-7 years in the other CEE countries; in Western Europe the increase was 4-5 years in the same period, so this also meant some convergence of CEE to Western Europe.
In the economic indicators, from 1990 to 2024 CEE showed significant convergence to the Western core (DE/G7) and Southern Europe, while pulling away significantly from comparable countries in Latin America or Africa. The only other region that showed a similar amount of convergence after 1990 is East Asia.
Looking at convergence toward Western Europe (Germany/G7) in absolute terms - measured either in constant USD or as a percentage of the Western level - the CEE region showed increases on par with, or sometimes even above, those of East Asia in all variables analysed.
In relative terms - measured as relative increase from 1990 baseline - East Asia experienced the largest increases, while CEE saw the second-strongest improvements globally.
By contrast, the weighted average of peer countries in Latin America and Africa shows little to no convergence toward the Western core over the 30-35 years after 1990. In several variables, Southern Europe even moved backward.
This suggests that the strong convergence observed in CEE and East Asia is quite specific to these two regions, rather than a general pattern among countries with similar income levels in 1990.
Using Germany as a reference level, the CEE region and its Asian peer group (weighted averages) showed the following increases in the variables analysed:
| Indicator | CEE | Asia |
|---|---|---|
| GDP per capita (from 1990) | 41%→69% (+28%) | 7%→39% (+32%) |
| GNI per capita (from 1990) | 40%→63% (+23%) | 7%→36% (+28%) |
| GDP per person employed (from 1991) | 41%→74% (+33%) | 8%→39% (+31%) |
| GDP per hour worked (from 1995) | 36%→56% (+20%) | 7%→23% (+16%) |
| Annual average wages (from 1995) | 34%→61% (+27%) | NA (South Korea & Israel: 60%→75% (+15%)) |
| Minimum wages (from 1995, % of France) | 21%→66% (+45%) | NA (South Korea: 32%→84% (+52%)) |
| Median hourly earnings (from 2006) | 31%→59% (+28%) | NA |
| Median equivalised net income (from 2005) | 30%→61% (+31%) | NA |
Table 3: cumulative change in main indicators for CEE and comparable (see Table 2) Asian economies, relative to Germany’s level
Over the 30-35 years since the early 1990s, Central and Eastern European countries have, on average, closed the gap to Germany by just under one percentage point of the German benchmark per year in key economic indicators - rising from roughly 30-40% of Germany’s level to around 55-75%.
In several per capita indicators, Poland’s convergence has been roughly on par with - or even exceeded - that of China over the same period, while Romania, Lithuania, and Estonia have also shown comparably large gains.
Czechia and Slovenia started from a higher baseline in 1990, typically 50-60% of Germany’s level for most indicators, and their subsequent convergence has been less steep, but in most indicators they reached 70-85% of the reference level by 2024.
In the most recent years Poland and Lithuania have nearly reached the CEE ‘frontier’ defined by Slovenia in several indicators.
The convergence of per person output measures (GDP or GNI) on the one hand and earnings and household income on the other have been quite closely aligned.
GDP per capita however overstates the extent of convergence by a few percentage points, so GNI per capita seems a better measure, combined with productivity and earnings/income metrics.
The key variable of output per hour of work lagged somewhat behind the other metrics.
In this indicator, even the most developed CEE countries (CZ and SI) were only at around 61-62% of the German level in 2023. The somewhat higher relative figures for output and income per person are largely explained by 20-30% longer work hours in CEE compared to Germany.
It has to be said though that Germany has one of the highest labour productivity per hour globally, so for labour productivity it is a very high bar. Using the G7 as a benchmark CZ and SI are at the 70% mark, and around 77-80% of Spain and Italy.
In any case, further convergence of the CEE region to the Western European level would probably have to happen via increased labour productivity as the employment share has now largely converged to a West European level, and working hours are higher.
Afterword
From reviewing the data on economic convergence before and after 1990, we can draw the following conclusions.
The socialist system was not capable to close CEE’s gap with the Western core.
Not only that, it was not capable to even hold its relative position: in most of CEE it already meant relative decline compared to the West ever since 1950, but from the mid-1970s that happened everywhere across the socialist bloc and relative decline further accelarated up to 1989.
The contrast becomes even sharper when CEE is compared with Southern Europe, its closest economic peer after WWII. In this comparison, the backsliding of the socialist countries is substantially steeper.
A partial exception to this pattern is Yugoslavia from 1950 to around 1978 which did show convergence, but this stopped and reversed from the late 1970s onwards.
For life expectancy, after some initial gains up to 1965, it completely flatlined in the CEE region and USSR countries, something not observed anywhere else in comparable world regions.
In contrast, since the early 1990s there has been significant convergence for most CEE countries compared to the Western European core.
CEE moved from roughly one-third to two-thirds of the German level by all major indicators - not just per capita GDP, but productivity, earnings and household income as well.
This also meant moving closer to the Western core than at any point since industrialisation began in Central Europe. In that sense, CEE is now roughly halfway to its long-standing reference point - Western Europe.
This is a substantive achievement, and while it may contradict some ideologically motivated priors, overlooking or denying it amounts to disregarding the available empirical evidence, which is sufficiently clear.
Looking backwards, we can also raise the hypothetical question if the transition process could have been managed better.
From a global perspective, CEE’s convergence since 1990 has been among the strongest in the world - first or second by all measures analysed above - which can hardly be described as catastrophic. At the same time, European integration was a unique advantage, unavailable to other regions for geographic reasons. Given this, could the process have been managed even better? Answering that question would require micro-level statistical analysis, analysing how specific economic policies and structures relate to macroeconomic outcomes. The aim here was more modest: to assess whether CEE has experienced convergence at the macro level over the past decades. It clearly has - and this stands in contrast to the pre-1990 system.
While workable alternatives to a market economy remain very unclear, this does not make it impossible to advocate some version of socialism. The failed record of really existing socialism does make this harder though, especially given how those failures can be directly related to inherent problems of centralised control and allocation. These problems eventually led to economic stagnation, even if they were sometimes preceded by growth periods of brute-force industrialisation which did not last long. They also meant however political dictatorship and a police state, at terrible human cost. It is theoretically possible - though morally rather dubious - to argue that dictatorship was a price to pay for the superior socio-economic results of socialist planning. In reality though the socio-economic outcomes of socialism proved to be inferior both to those of Western and Southern Europe in the same period and to those of the post-1990 capitalism in the CEE region itself. The conclusion seems inescapable: those sacrifices were not only very costly, but proved to be ultimately senseless, which only makes them more tragic. And while CEE has seen much political turbulence since 1990, one political agenda that never gained traction in the region post-1990 is a return to state socialism, which is telling. While it is possible to concoct baroque theories that this is somehow a result of capitalist conspiracy, there is a more plausible and simpler explanation: there is no substantial popular demand for socialism (at least of the old kind) in CEE, due to its obvious historical failure.
A more pressing question is the validity of the entire framework that the above analysis - like most economic analysis - is predicated on. Namely, it rests on the assumption that economic growth can continue indefinitely, or at least up to a Western European output level. There are powerful arguments suggesting this is simply not possible because of physical limits, or at least not for billions of people. This would require a separate analysis of whether a Western European lifestyle is physically sustainable on a global scale.
If convergence with Western Europe is accepted as a meaningful objective and benchmark of development, the evidence shows that the CEE region has made substantial progress since 1990. Roughly half the historical gap has been closed, with output and income levels reaching approximately two-thirds of those in Western Europe. This is the highest level CEE societies have ever achieved relative to the Western core, since entering industrial modernity. This trajectory is in contrast with the state socialist era, when CEE fell behind not only Western but also Southern Europe. Whether this long road of convergence can continue remains an open question. The next decade may show already if CEE can reach the now less distant ‘promised land’ of Western European development, or whether this horizon - just when it seems to be within reach - turns out to be a mirage, either just for the CEE region, or more fundamentally, perhaps because the whole model of technological civilisation proves to be unsustainable.
-
similar analyses that survey convergence, but with shorter time frame and fewer indicators included: [BNP Paribas, 2024], [ECB, 2025], [Bruegel, 2024] ↩
-
economic systems based on state-planning and not on market competition and private property; scholastic debates about whether ‘this was really socialism’ is not our focus here. ↩
political-economy globalization growth gdp hungary CEE convergence