Hungary's convergence since 2010 within the CEE region
Hungary's economic convergence since 2004 and 2010 has been disappointing in a regional context. Although the country was one of the CEE region's forerunners at the time of its EU accession in 2004, its relative position has steadily declined, a trend that has largely continued under the current government's 16-year rule. Using ten high-level socio-economic indicators - covering output, productivity, wages, income, consumption and life expectancy - I compare Hungary's performance with the other ten Central and Eastern European countries. The analysis shows that Hungary's convergence has been among the weakest, whether measured from the 2004 or 2010 baseline.
Table of contents
- Introduction
- Methods
2.1 CEE and Western Europe
2.2 Indicators and metrics - Results
3.1 GDP and GNI per capita
3.2 Labour productivity
3.3 Wages, earnings and income
3.4 Actual individual consumption
3.5 Employment ratio
3.6 Life expectancy - Discussion
- Conclusion
Introduction
Hungary joined the European Union in 2004, together with several other former socialist countries from Central and Eastern Europe (CEE). Since the early 1990s, this group has achieved substantial economic convergence toward Western Europe. As shown in a previous analysis, on average CEE countries moved from roughly 30-40% of the Western European core’s level to about 60-75% across key indicators of output and income - such as GDP (or GNI) per capita, labour productivity, median wages, and household income. Outside of some East Asia economies, no other region has shown this pace of catch-up over the same period.
There are however large differences within the CEE region itself. In the 1990s and early 2000s, Hungary was often seen as one of the standout performers of post-socialist transition. Since then, its relative position has increasingly been weakened, with its convergence momentum increasingly falling behind relative to peers.
This longread examines Hungary’s economic performance since EU accession, and especially since 2010, in comparison with the rest of the CEE region. Hungary has had the same political leadership since 2010, marking 16 years of uninterrupted rule under Viktor Orbán. This period is long enough to be treated as a distinct economic era and allows us to assess whether Hungary’s idiosyncratic policy path has produced faster or slower convergence than its regional peers.
Methods
CEE and Western Europe
Hungary’s economic performance since EU accession cannot be viewed in isolation. To place it in context, we compare it to the convergence performance of similar economies in the region. Specifically, we compare Hungary’s performance since 2004 to the other 10 countries that joined the EU from 2004 onward, ranked by population (EU accession year, million population in the most recent available year):
- Poland (2004, 36.5m)
- Romania (2007, 19.0m)
- Czech Republic (2004, 10.9m)
- Hungary (2004, 9.5m)
- Bulgaria (2007, 6.4m)
- Slovakia (2004, 5.4m)
- Croatia (2013, 3.9m)
- Lithuania (2004, 2.9m)
- Slovenia (2004, 2.1m)
- Latvia (2004, 1.9m)
- Estonia (2004, 1.4m)
To assess convergence, we also need a benchmark. The widely held aspiration in the region, and the goal of EU cohesion policy, is for the CEE countries to reach Western European income levels. The composite benchmark we use is therefore the population-weighted average of the eight wealthiest Western European countries, excluding Ireland and Luxembourg:
- Germany (83.4m)
- France (68.4m)
- Denmark (6.0m)
- Netherlands (17.9m)
- Austria (9.2m)
- Sweden (10.6m)
- Belgium (11.8m)
- Finland (5.6m)
Ireland and Luxembourg are excluded because their small size and tax-haven status distort macroeconomic indicators, making them unsuitable as benchmarks.
Indicators and metrics
We look at a broad set of indicators to assess convergence in output per capita, productivity, median wages and household income, as well as consumption. While GDP per capita - the metric most often used to gauge convergence - shows convergence of output, it can be misleading if workers’ wages and household incomes do not rise at a similar rate. This may occur, for example, when there is a large gap between GDP and GNI due to profit outflows from foreign investment - a real issue in some CEE countries - leaving less of the value produced within a country available for domestic incomes. Similarly, if the labour share is low or declining, wages may stay low or grow more slowly even if output is rising. Therefore, besides GDP per capita, we will look at GNI per capita and output per hour worked, but also annual average wages, median hourly earnings and median household incomes.
We also examine minimum wages, which are an important indicator for low-wage workers. The employment-to-population ratio is another key metric, as it highlights potential underemployment, a notable issue in the CEE region following the transition years, and shows how tight labour markets are. Finally, trends in life expectancy show whether economic growth is translating into longer life spans, arguably the most important vital statistic.
There is no single, definitive set of indicators for assessing economic convergence. The indicators used below are widely employed in the literature and together provide a coherent and reasonably comprehensive picture, capturing the main trends in output, income, consumption, labour market conditions, and longevity.
For each variable, I examine growth trends in three ways.
The first metric looks at a variable’s change over time in absolute terms. For output and income variables, this means monetary values (USD or euros). To enable international comparisons, I always use purchasing power parities/standards (PPP/PPS) to adjust for price differences between countries. To remove the effect of inflation, wherever it’s available, I rely on constant USD measures, anchored to a given year.
For median earnings and household income, as well as consumption, I use Eurostat’s PPS (purchasing power standards) metric, which adjusts for price differences across countries, with 1 PPS purchasing the same basket of goods throughout the EU. However, unlike the other output and income measures, PPS units are not constant over time, that is, they are not inflation adjusted. Instead, they are anchored to the EU-wide price level rather than to prices in individual countries.
As a result, for these three metrics (earnings, household income, actual individual consumption), trends in absolute terms still include inflation, but not inflation in the individual country. Rather, they reflect EU-wide inflation, which was typically lower than inflation in the CEE countries. As an illustration, median household incomes in Romania increased by approximately 4.6-fold between 2005 and 2024. This increase is not in real terms, but it is also not purely nominal, as it is anchored to EU-wide rather than Romanian inflation. EU-wide cumulative inflation over this period was roughly 60–70%, implying that the increase of household income in real terms would be, very roughly, about 2.8-fold (4.65/1.65).
For the employment-to-population ratio, the unit is the percentage of the population aged 15+ that is in employment, while for life expectancy the unit is years.
The second metric is relative change from the baseline, obtained by normalising absolute values to the first year of the analysis window. I examine trends starting either from 2004 (the year of EU accession for most of CEE), or from 2010, when the current Hungarian government entered office. Relative change from a given starting year will typically be larger for countries with a lower initial level, as they tend to experience higher growth rates that gradually slow over time.
The third metric expresses indicators as a percentage of the EU8 group’s average. In my view this is the most meaningful measure of convergence, as it shows not only trends within the convergence countries themselves, but also whether they are catching up with the Western European core. In this case, variables are still expressed in the same units as above (purchasing power parities for monetary variables), but are then divided by the EU8 average and reported as a percentage of that benchmark.
For each indicator, I present time trends in the plots using these three metrics, which the reader can switch between, shown either from 2004 (or the earliest available post-2004 year) or from 2010. After each plot, I summarise the cumulative changes in tables, ranking countries by their convergence to the EU8 group, that is, by their cumulative increase as a percentage of the EU8 average.
For the employment ratio, countries are ranked by the increase in the percentage of the 15+ population in employment, since this is already a relative measure with a ceiling and is therefore more informative than re-normalising by EU8 values. Similarly, for life expectancy, countries are ranked by the more meaningful absolute increase, as values expressed as a percentage of the EU8 average are very similar, given that all CEE countries already exceed 90% of the EU8 benchmark.
All code and data used in the post and its plots can be downloaded from the project’s Github repo.
Results
GDP and GNI per capita
GDP per capita
For the entire CEE region, GDP per capita has almost doubled (+93%) since 2004, and has grown 55% since 2010. Poland, Romania, and Lithuania have been the top three performers across all metrics.
As with several other indicators, Czechia (CZ) and Slovenia (SI) were well above the regional average in 2004 - by almost 50% ($33–34k, compared to $23k for the regional average). Given this higher starting point, their subsequent growth rates have understandably been slower.
As a result, cumulative gains in both relative and absolute terms have been smaller for CZ and SI. Even so, by 2024 they still remained - narrowly - at the top of the region, at around 80% of the EU8 level, while the CEE average continued to catch up. By 2024, Lithuania and Poland had effectively reached the same level as Czechia and Slovenia in GDP per capita.
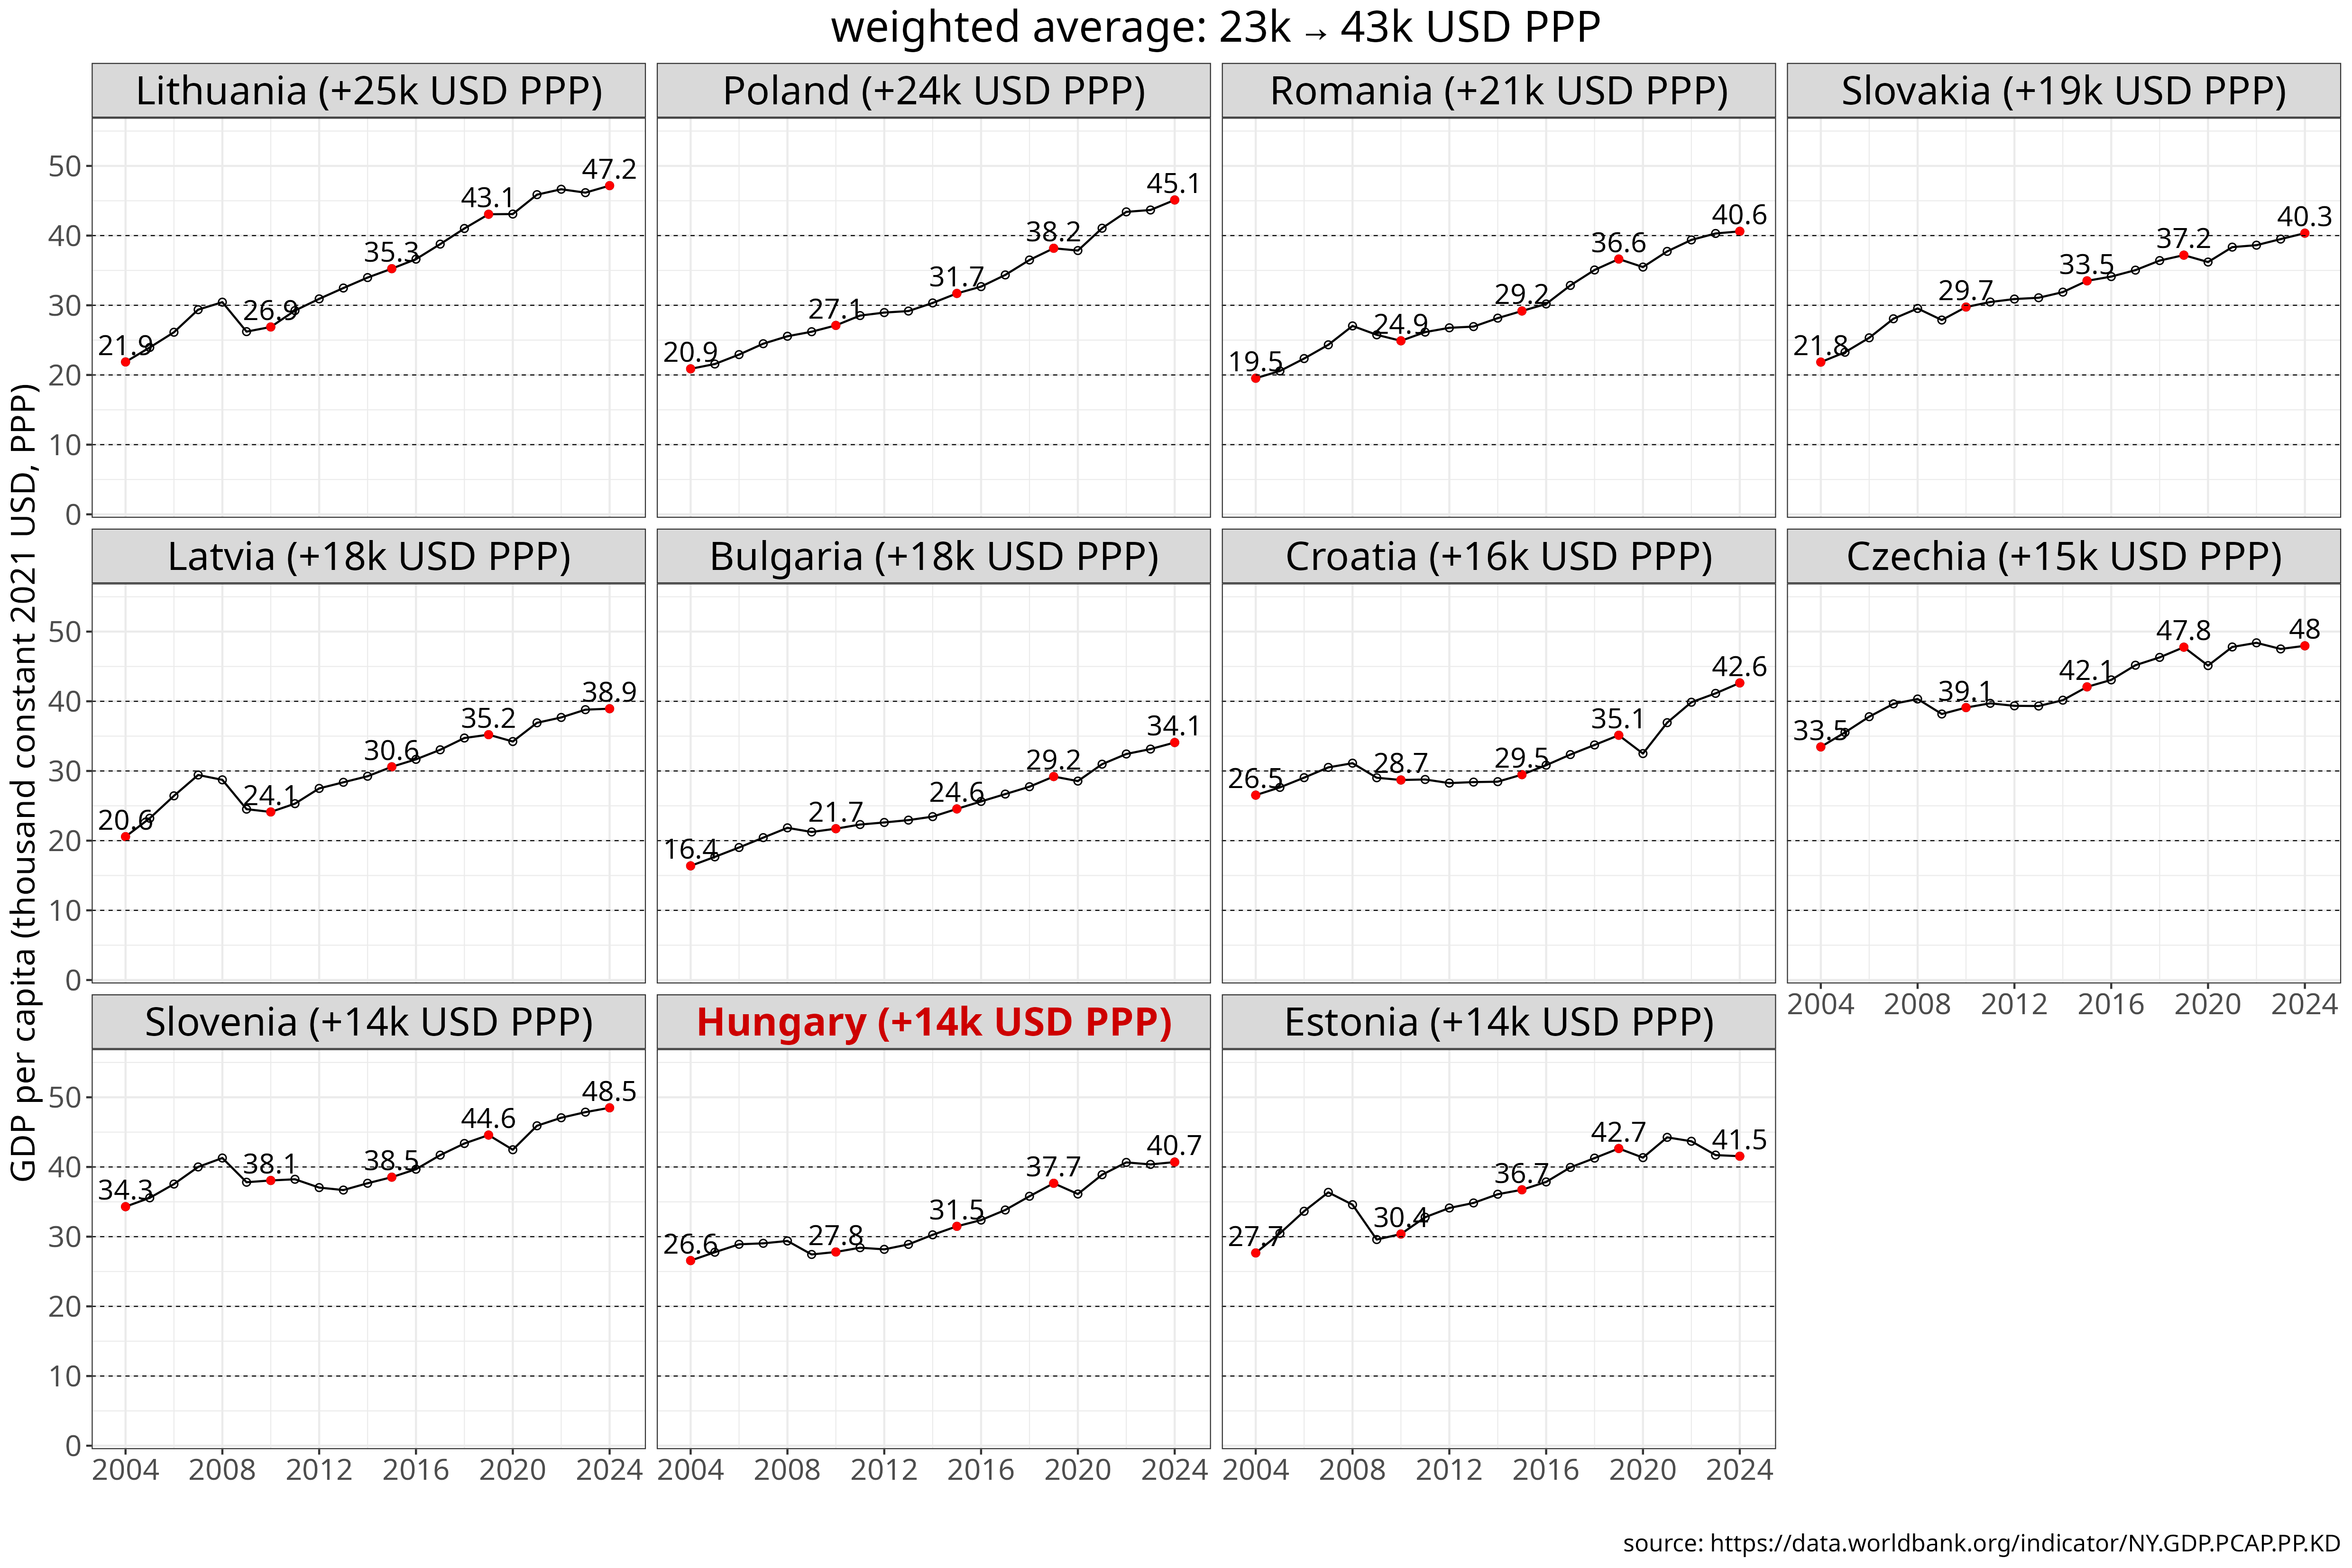
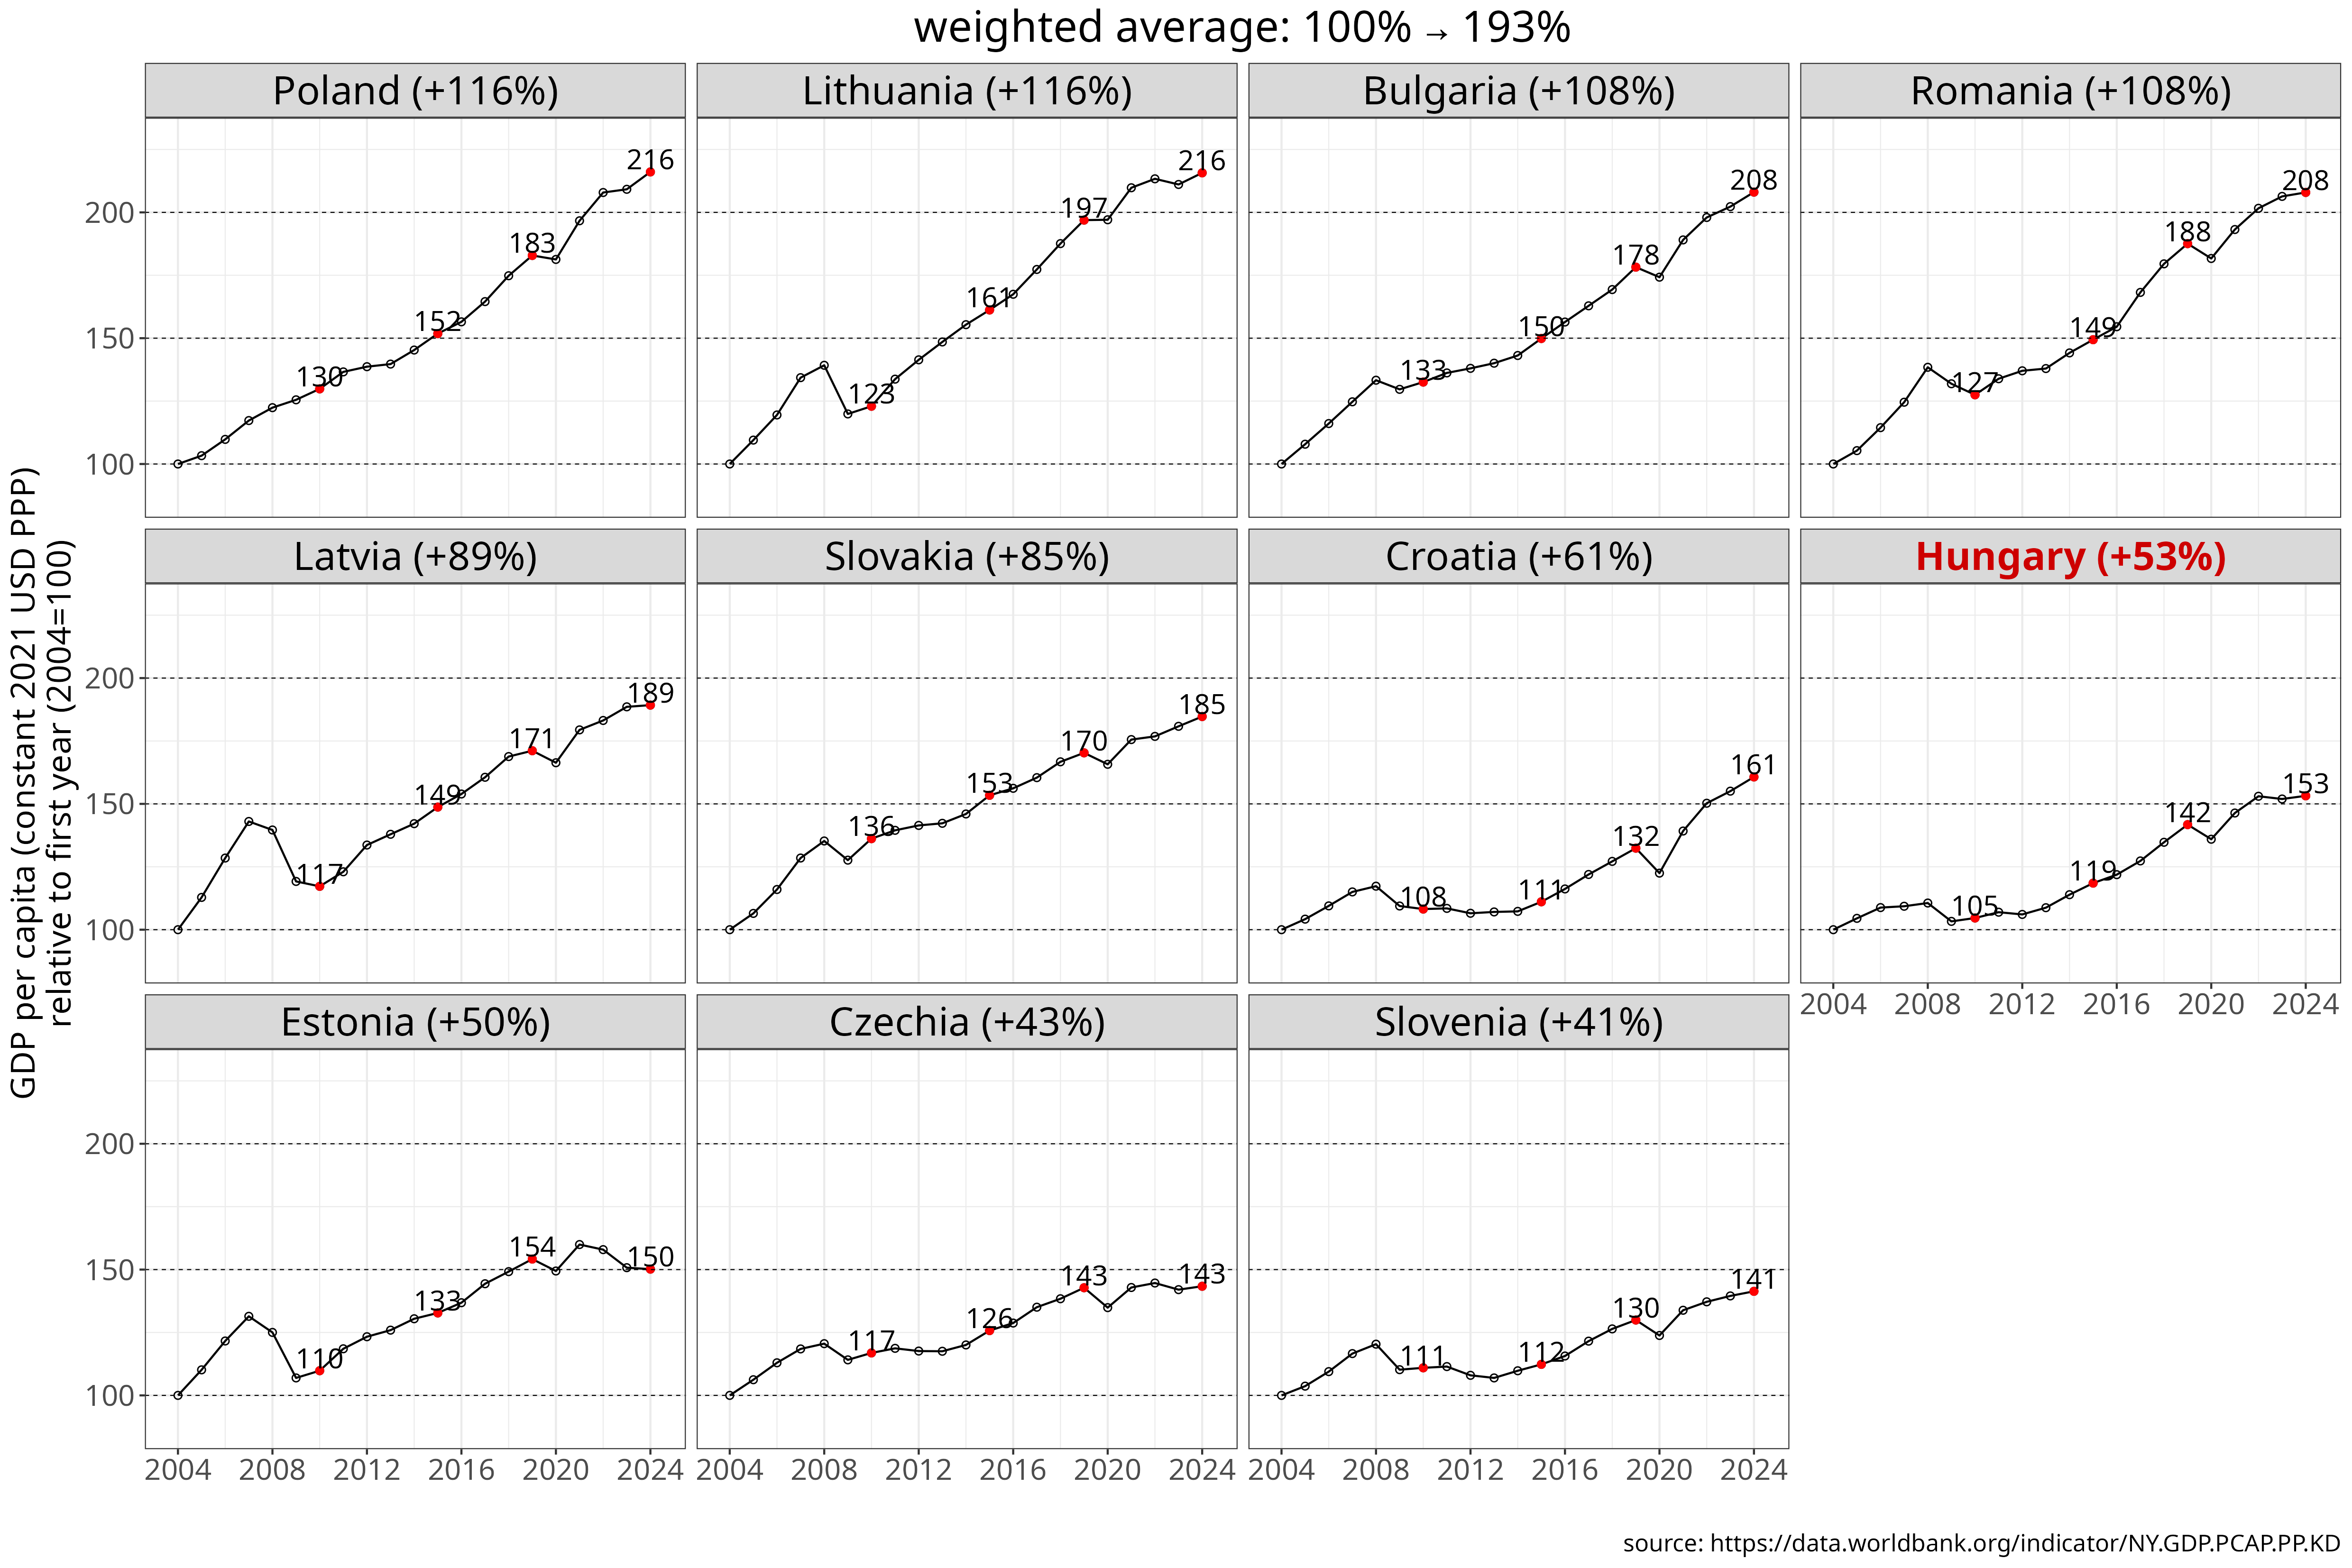
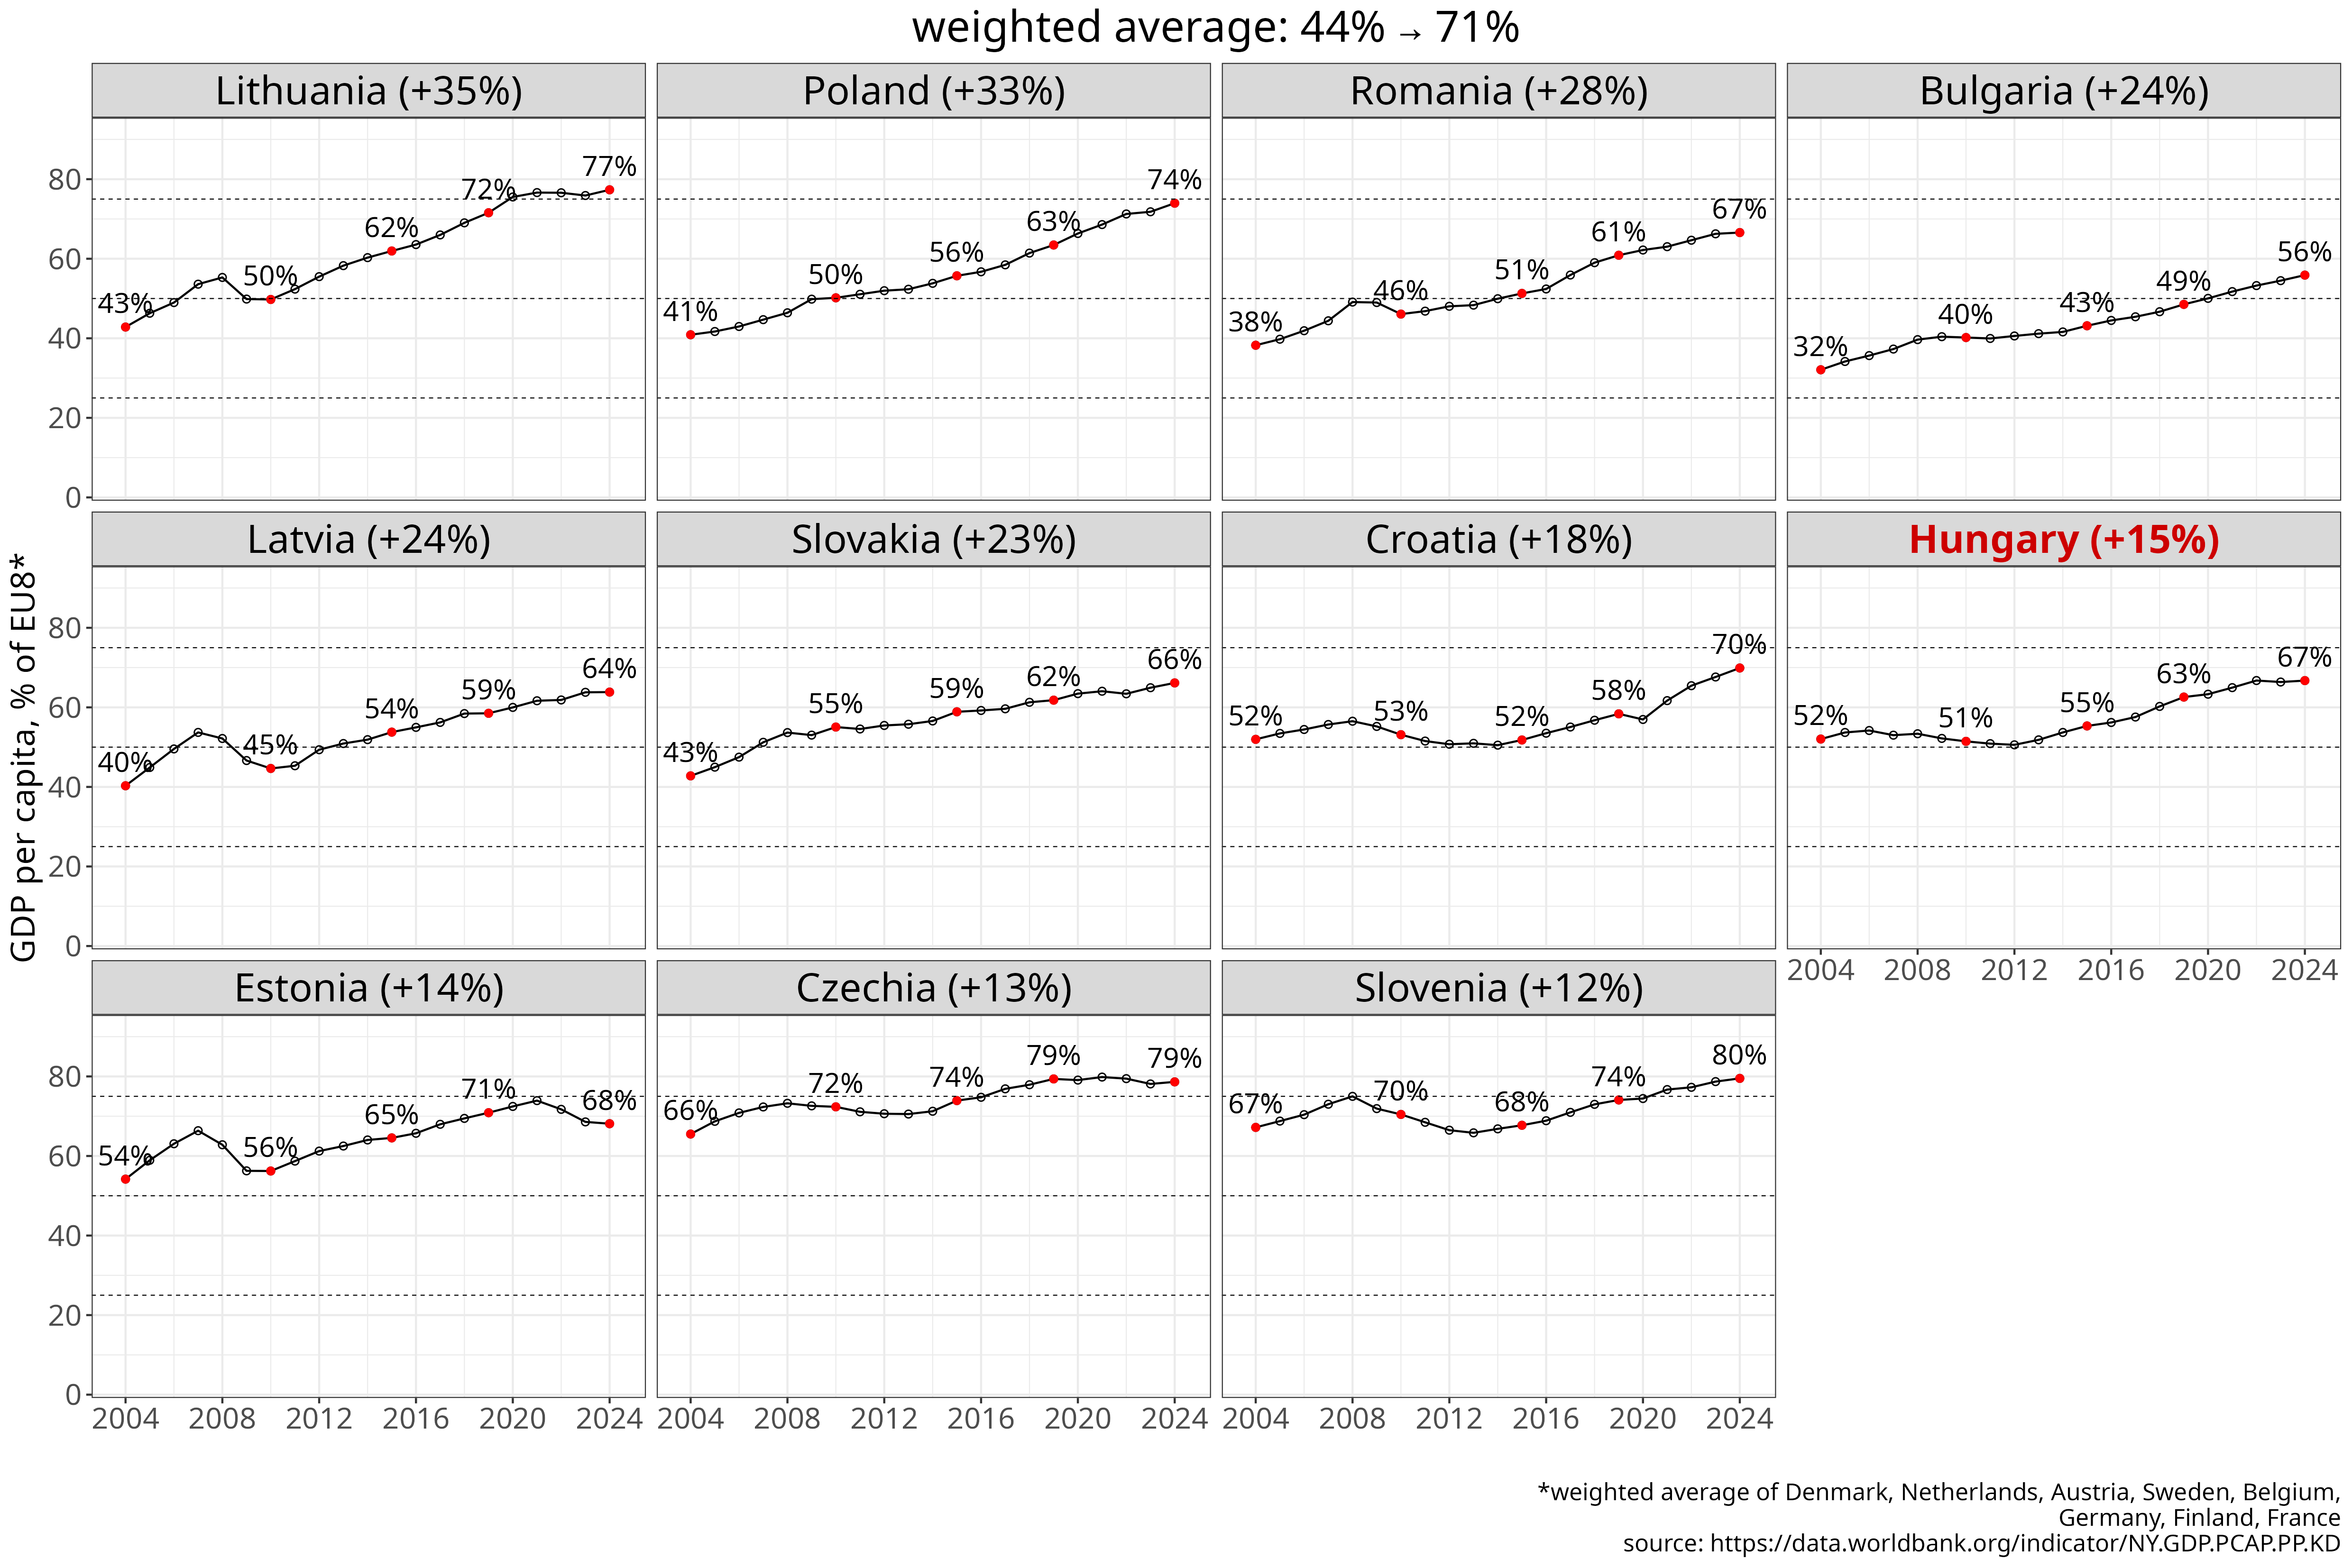
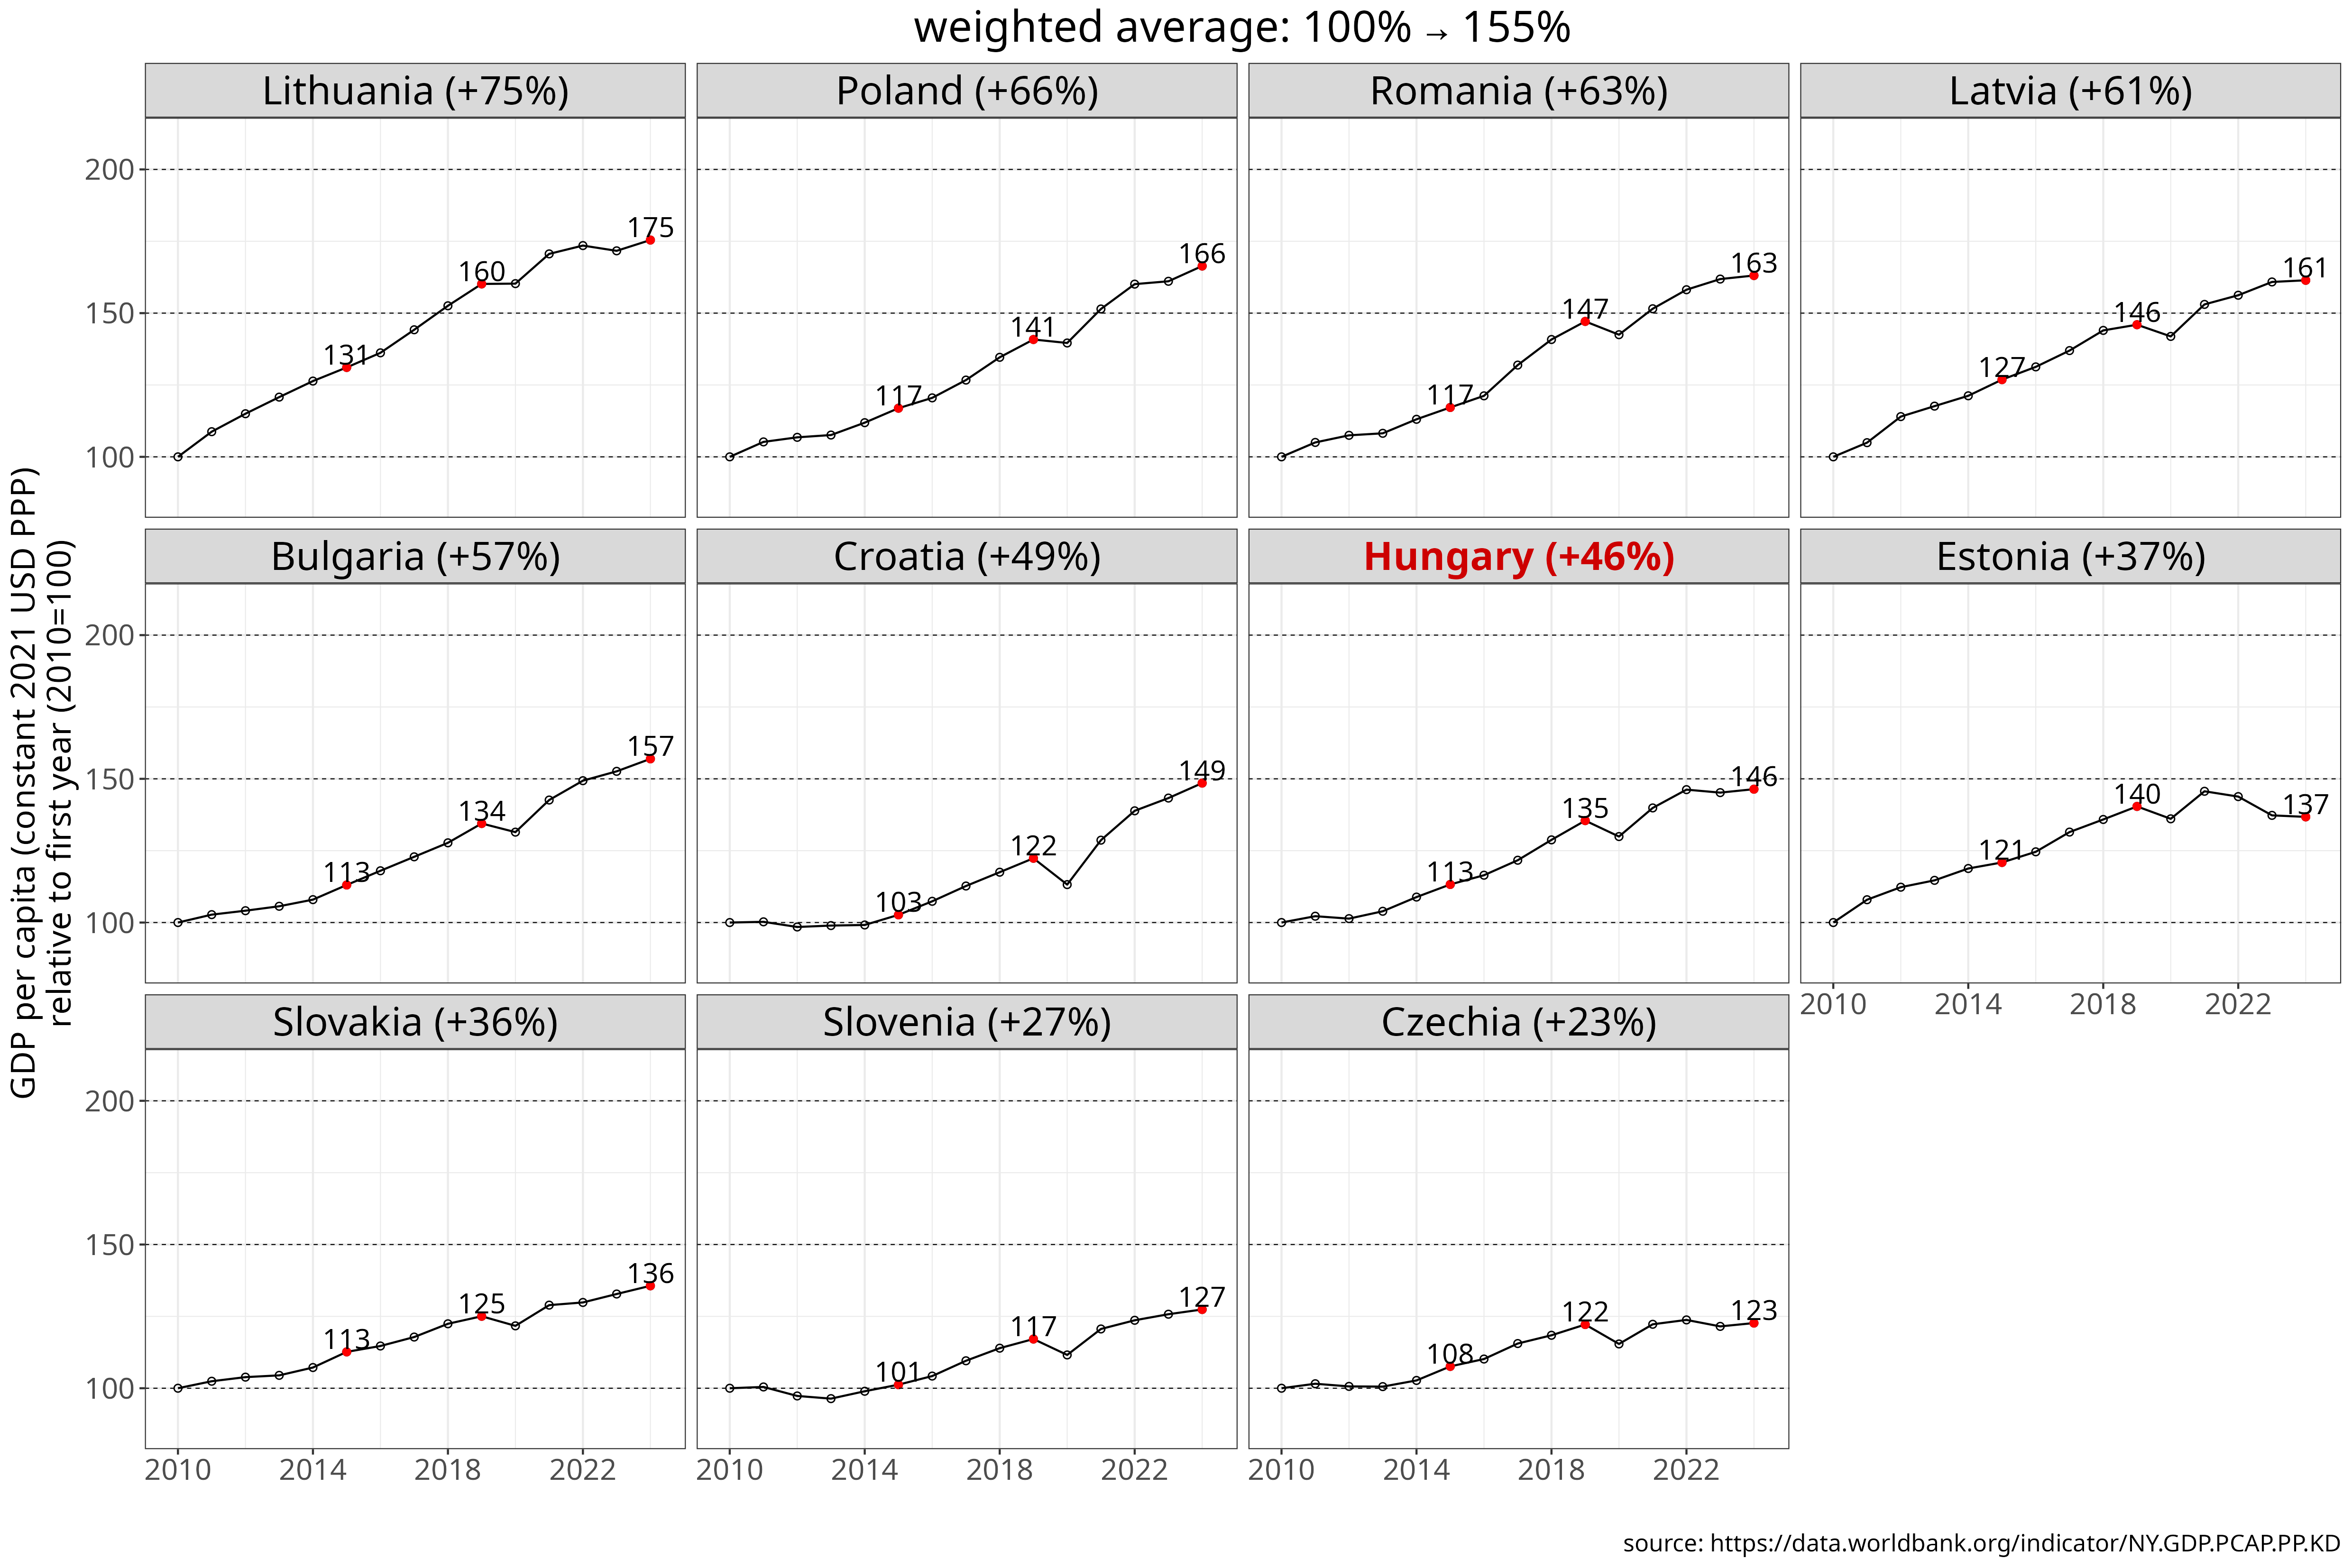
Figure 1 GDP per capita since 2004, measured in constant 2021 international dollars (PPP).
The chart shows levels (const. USD PPP), indexed values relative to 2004 and 2010, and percentages of the EU8 weighted average. Countries are ranked by cumulative growth from the selected base year through 2024.
[download data]
[source]
Ranking countries by cumulative convergence places Hungary in the lower half of the regional ranking, whether calculated from 2004 or 2010. Czechia and Slovenia registered even smaller gains, but this reflects their higher starting (and finishing) levels. Apart from these two countries, only Estonia - and, using the 2010 baseline, Slovakia - experienced smaller convergence to the EU8 average. Consequently, while Hungary ranked 4th in 2004 and 6th in 2010, it slipped to 8th position by 2024.
However, this ranking understates just how weak Hungary’s convergence has been by regional standards, since GDP per capita is an area where its relative performance was actually stronger than in most other metrics, moving from 52 to 67% of the EU8 average from 2004 to 2024. It should be noted too that in the 2004-2010 period Hungary showed slight deconvergence, falling 1% behind the EU8 benchmark, so all its increase occurred in the 2013 to 2022 period.
| country | % of EU8 | relative to initial value (%) | absolute value (thousand USD PPP) |
|---|---|---|---|
| Lithuania | +35% (43→77) | +116% | +25.3k (21.9→47.2) |
| Poland | +33% (41→74) | +116% | +24.2k (20.9→45.1) |
| Romania | +28% (38→67) | +108% | +21.1k (19.5→40.6) |
| Bulgaria | +24% (32→56) | +108% | +17.7k (16.4→34.1) |
| Latvia | +24% (40→64) | +89% | +18.4k (20.6→38.9) |
| Slovakia | +23% (43→66) | +85% | +18.5k (21.8→40.3) |
| Croatia | +18% (52→70) | +61% | +16.1k (26.5→42.6) |
| Hungary | +15% (52→67) | +53% | +14.1k (26.6→40.7) |
| Estonia | +14% (54→68) | +50% | +13.9k (27.7→41.5) |
| Czechia | +13% (66→79) | +43% | +14.5k (33.5→48) |
| Slovenia | +12% (67→80) | +41% | +14.2k (34.3→48.5) |
| country | % of EU8 | relative to initial value (%) | absolute value (thousand USD PPP) |
|---|---|---|---|
| Lithuania | +28% (50→77) | +75% | +20.3k (26.9→47.2) |
| Poland | +24% (50→74) | +66% | +18k (27.1→45.1) |
| Romania | +20% (46→67) | +63% | +15.7k (24.9→40.6) |
| Latvia | +19% (45→64) | +61% | +14.8k (24.1→38.9) |
| Croatia | +17% (53→70) | +49% | +13.9k (28.7→42.6) |
| Bulgaria | +16% (40→56) | +57% | +12.4k (21.7→34.1) |
| Hungary | +15% (51→67) | +46% | +12.9k (27.8→40.7) |
| Estonia | +12% (56→68) | +37% | +11.2k (30.4→41.5) |
| Slovakia | +11% (55→66) | +36% | +10.6k (29.7→40.3) |
| Slovenia | +9.1% (70→80) | +27% | +10.4k (38.1→48.5) |
| Czechia | +6.3% (72→79) | +23% | +8.9k (39.1→48) |
Table 1: Cumulative change in GDP per capita from 2004 or 2010 to 2024, shown as a percentage of the EU8 weighted average, relative to the initial year, and in absolute terms (constant 2021 international dollars (PPP)). Countries are ranked by the EU8-relative measure.
GNI per capita
We saw in a previous analysis that GNI per capita is a better metric of domestsic income growth than GDP per capita, as several countries in CEE (such as Slovakia, Hungary, Bulgaria or Latvia) GDP growth has outstripped gross national income growth due to a large negative primary income balance.
GNI per capita trends tell a similar story regarding which countries have shown stronger or weaker convergence. Poland, Romania, and the Baltic countries moved 23-29% closer to the EU8 average. At the bottom of the table, we again find Czechia, Slovenia, Slovakia and Hungary. However, CZ and SI were again already at a higher level relative to the EU8 in 2003 than Hungary was even in 2024, so their smaller convergence is arguably less concerning.
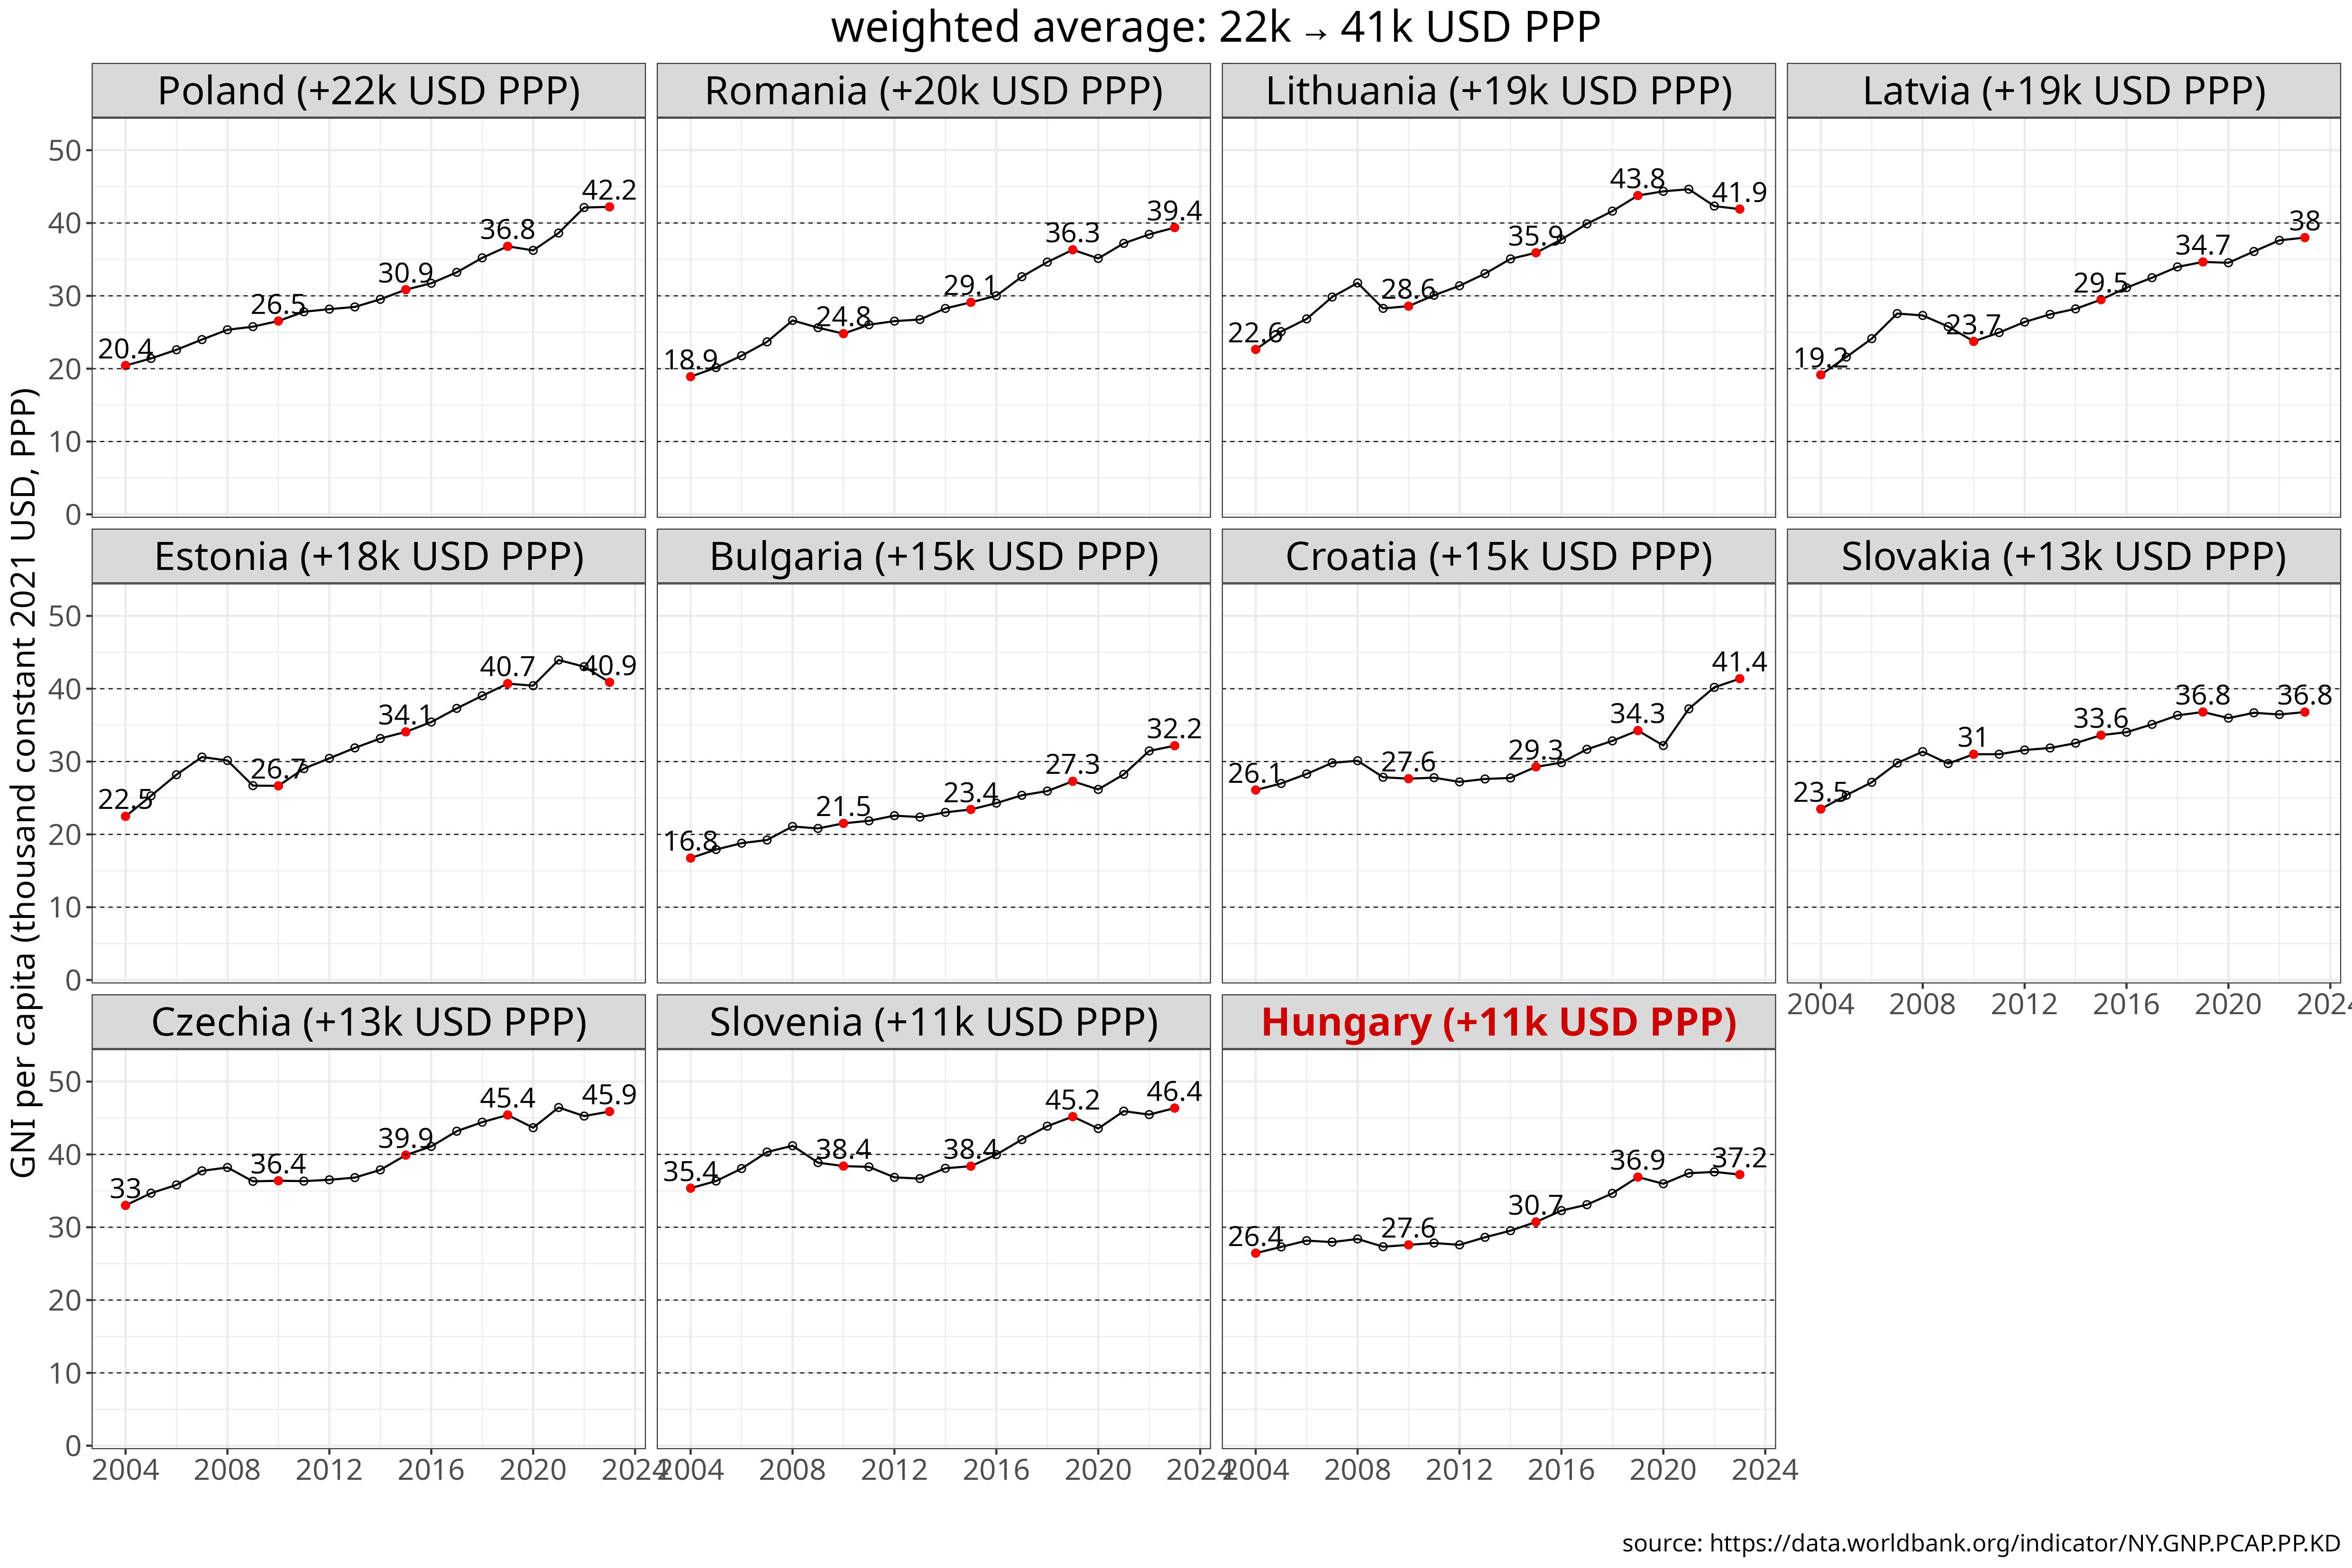
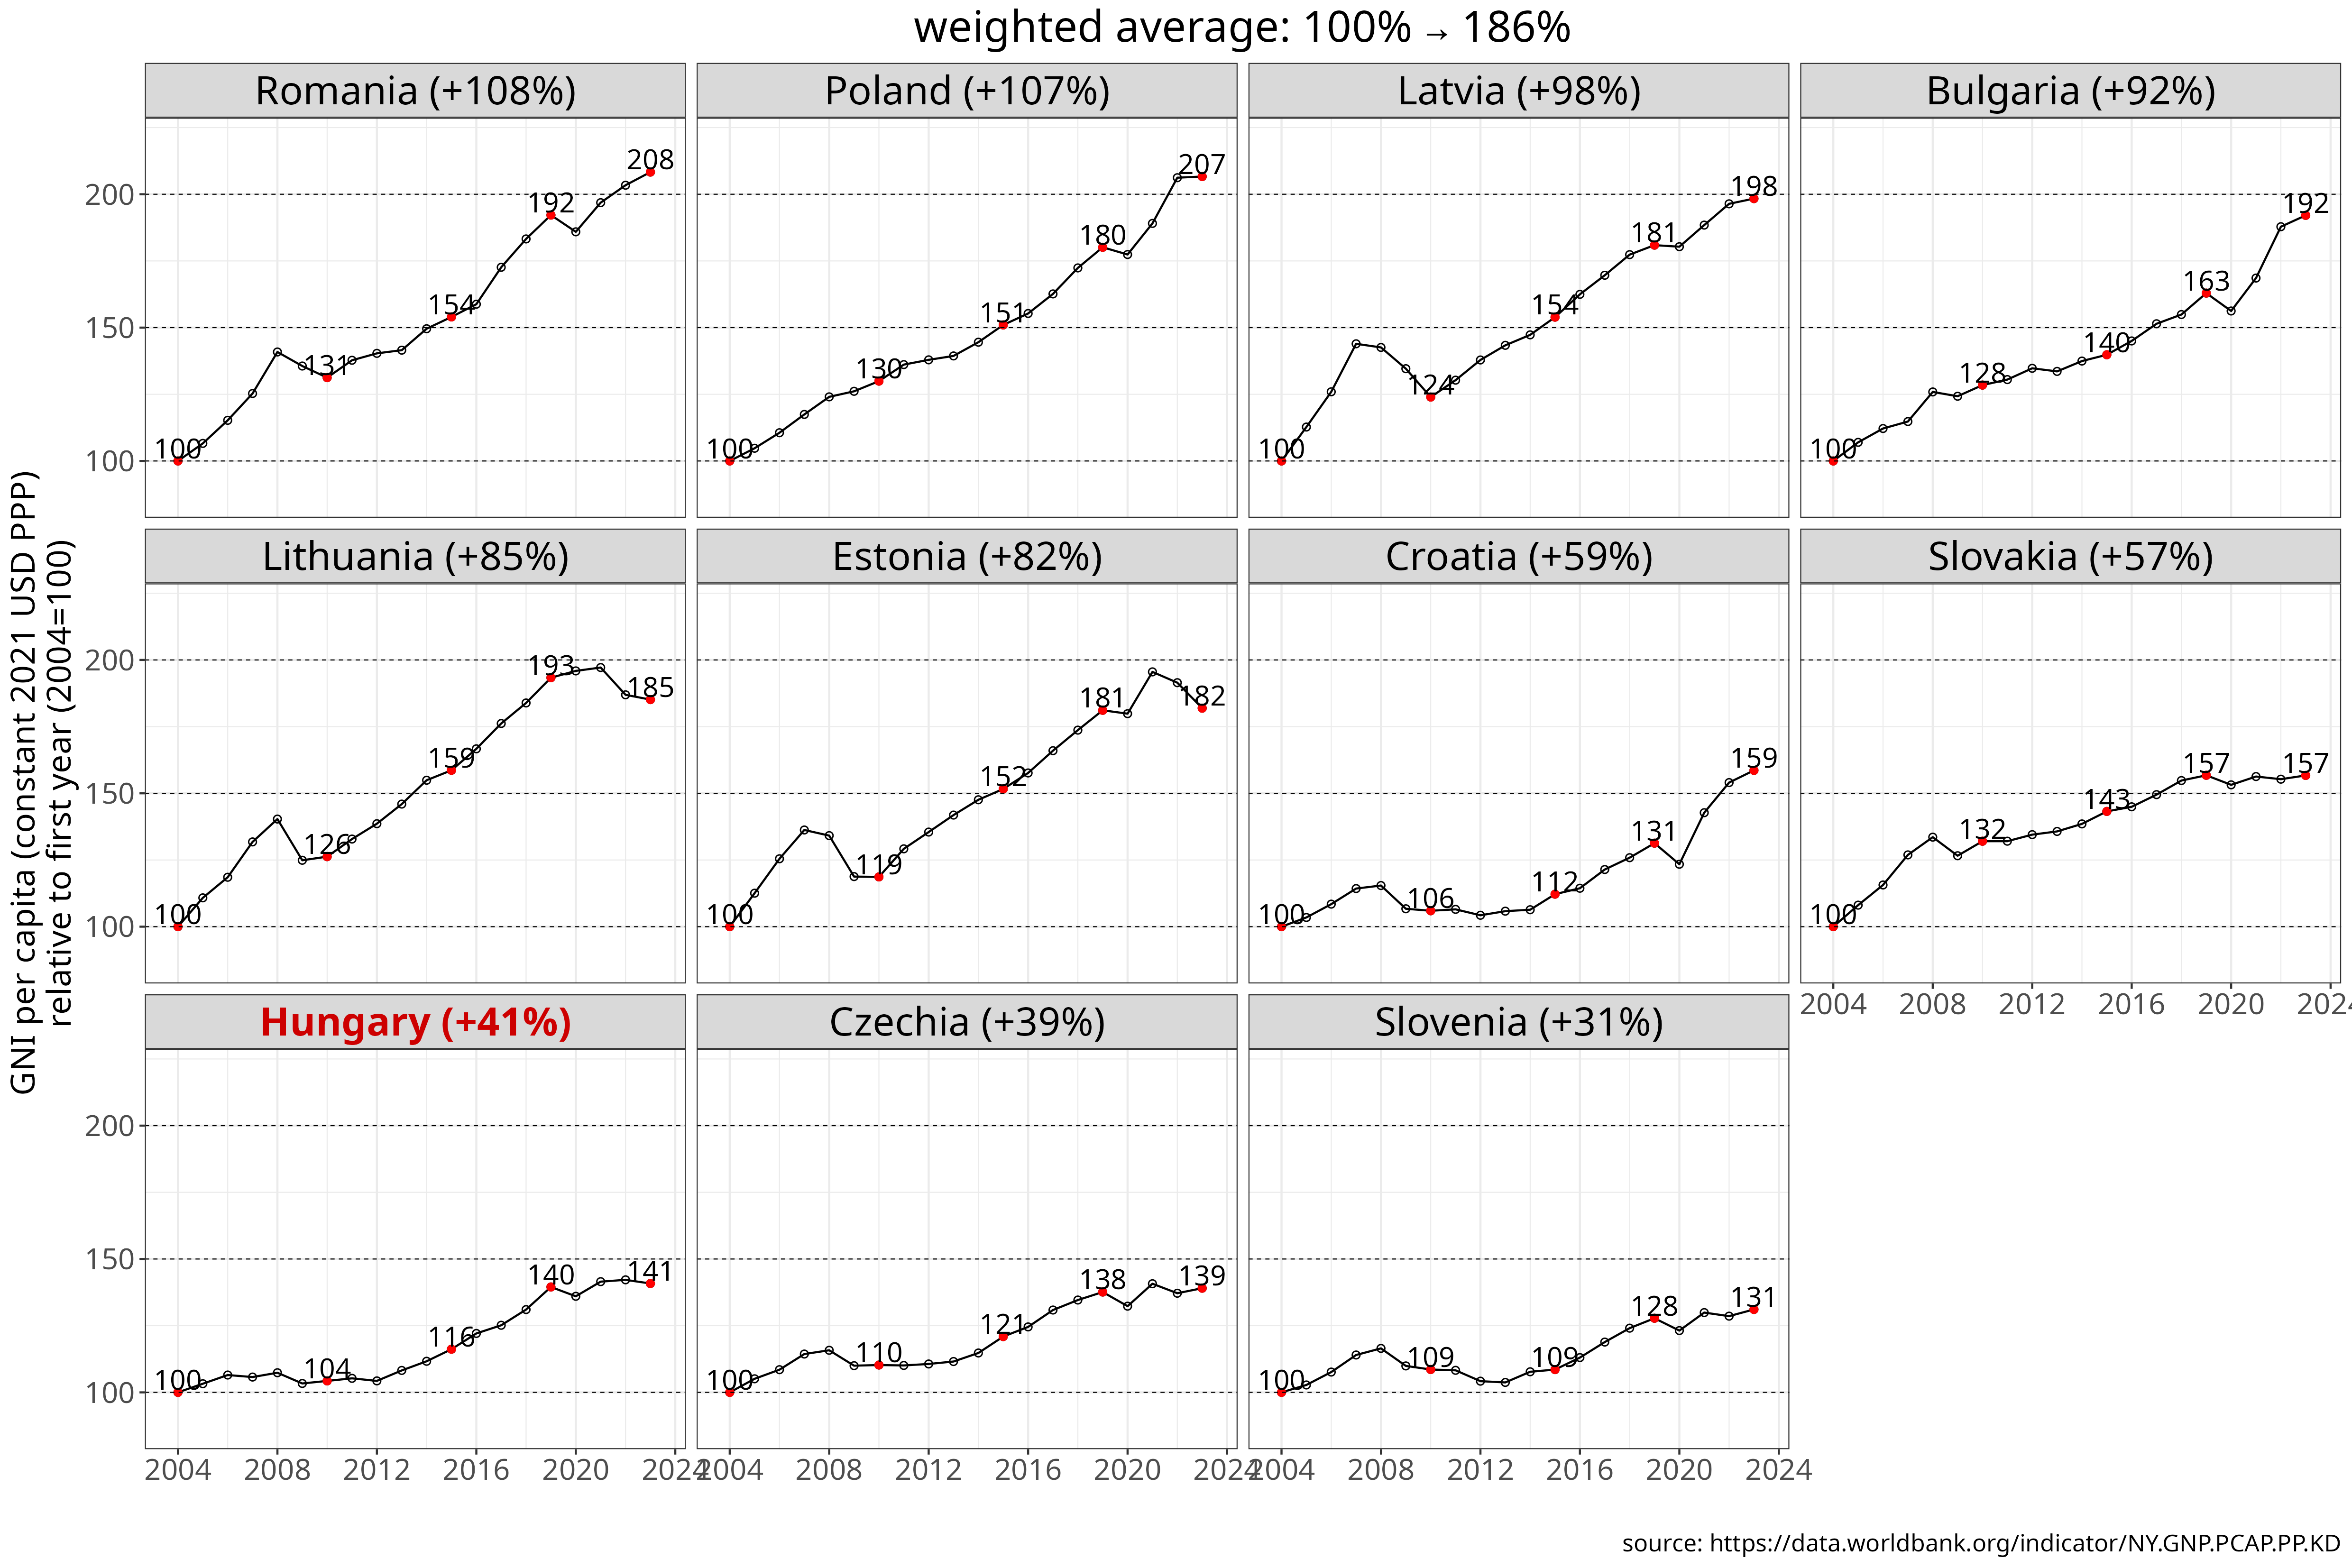
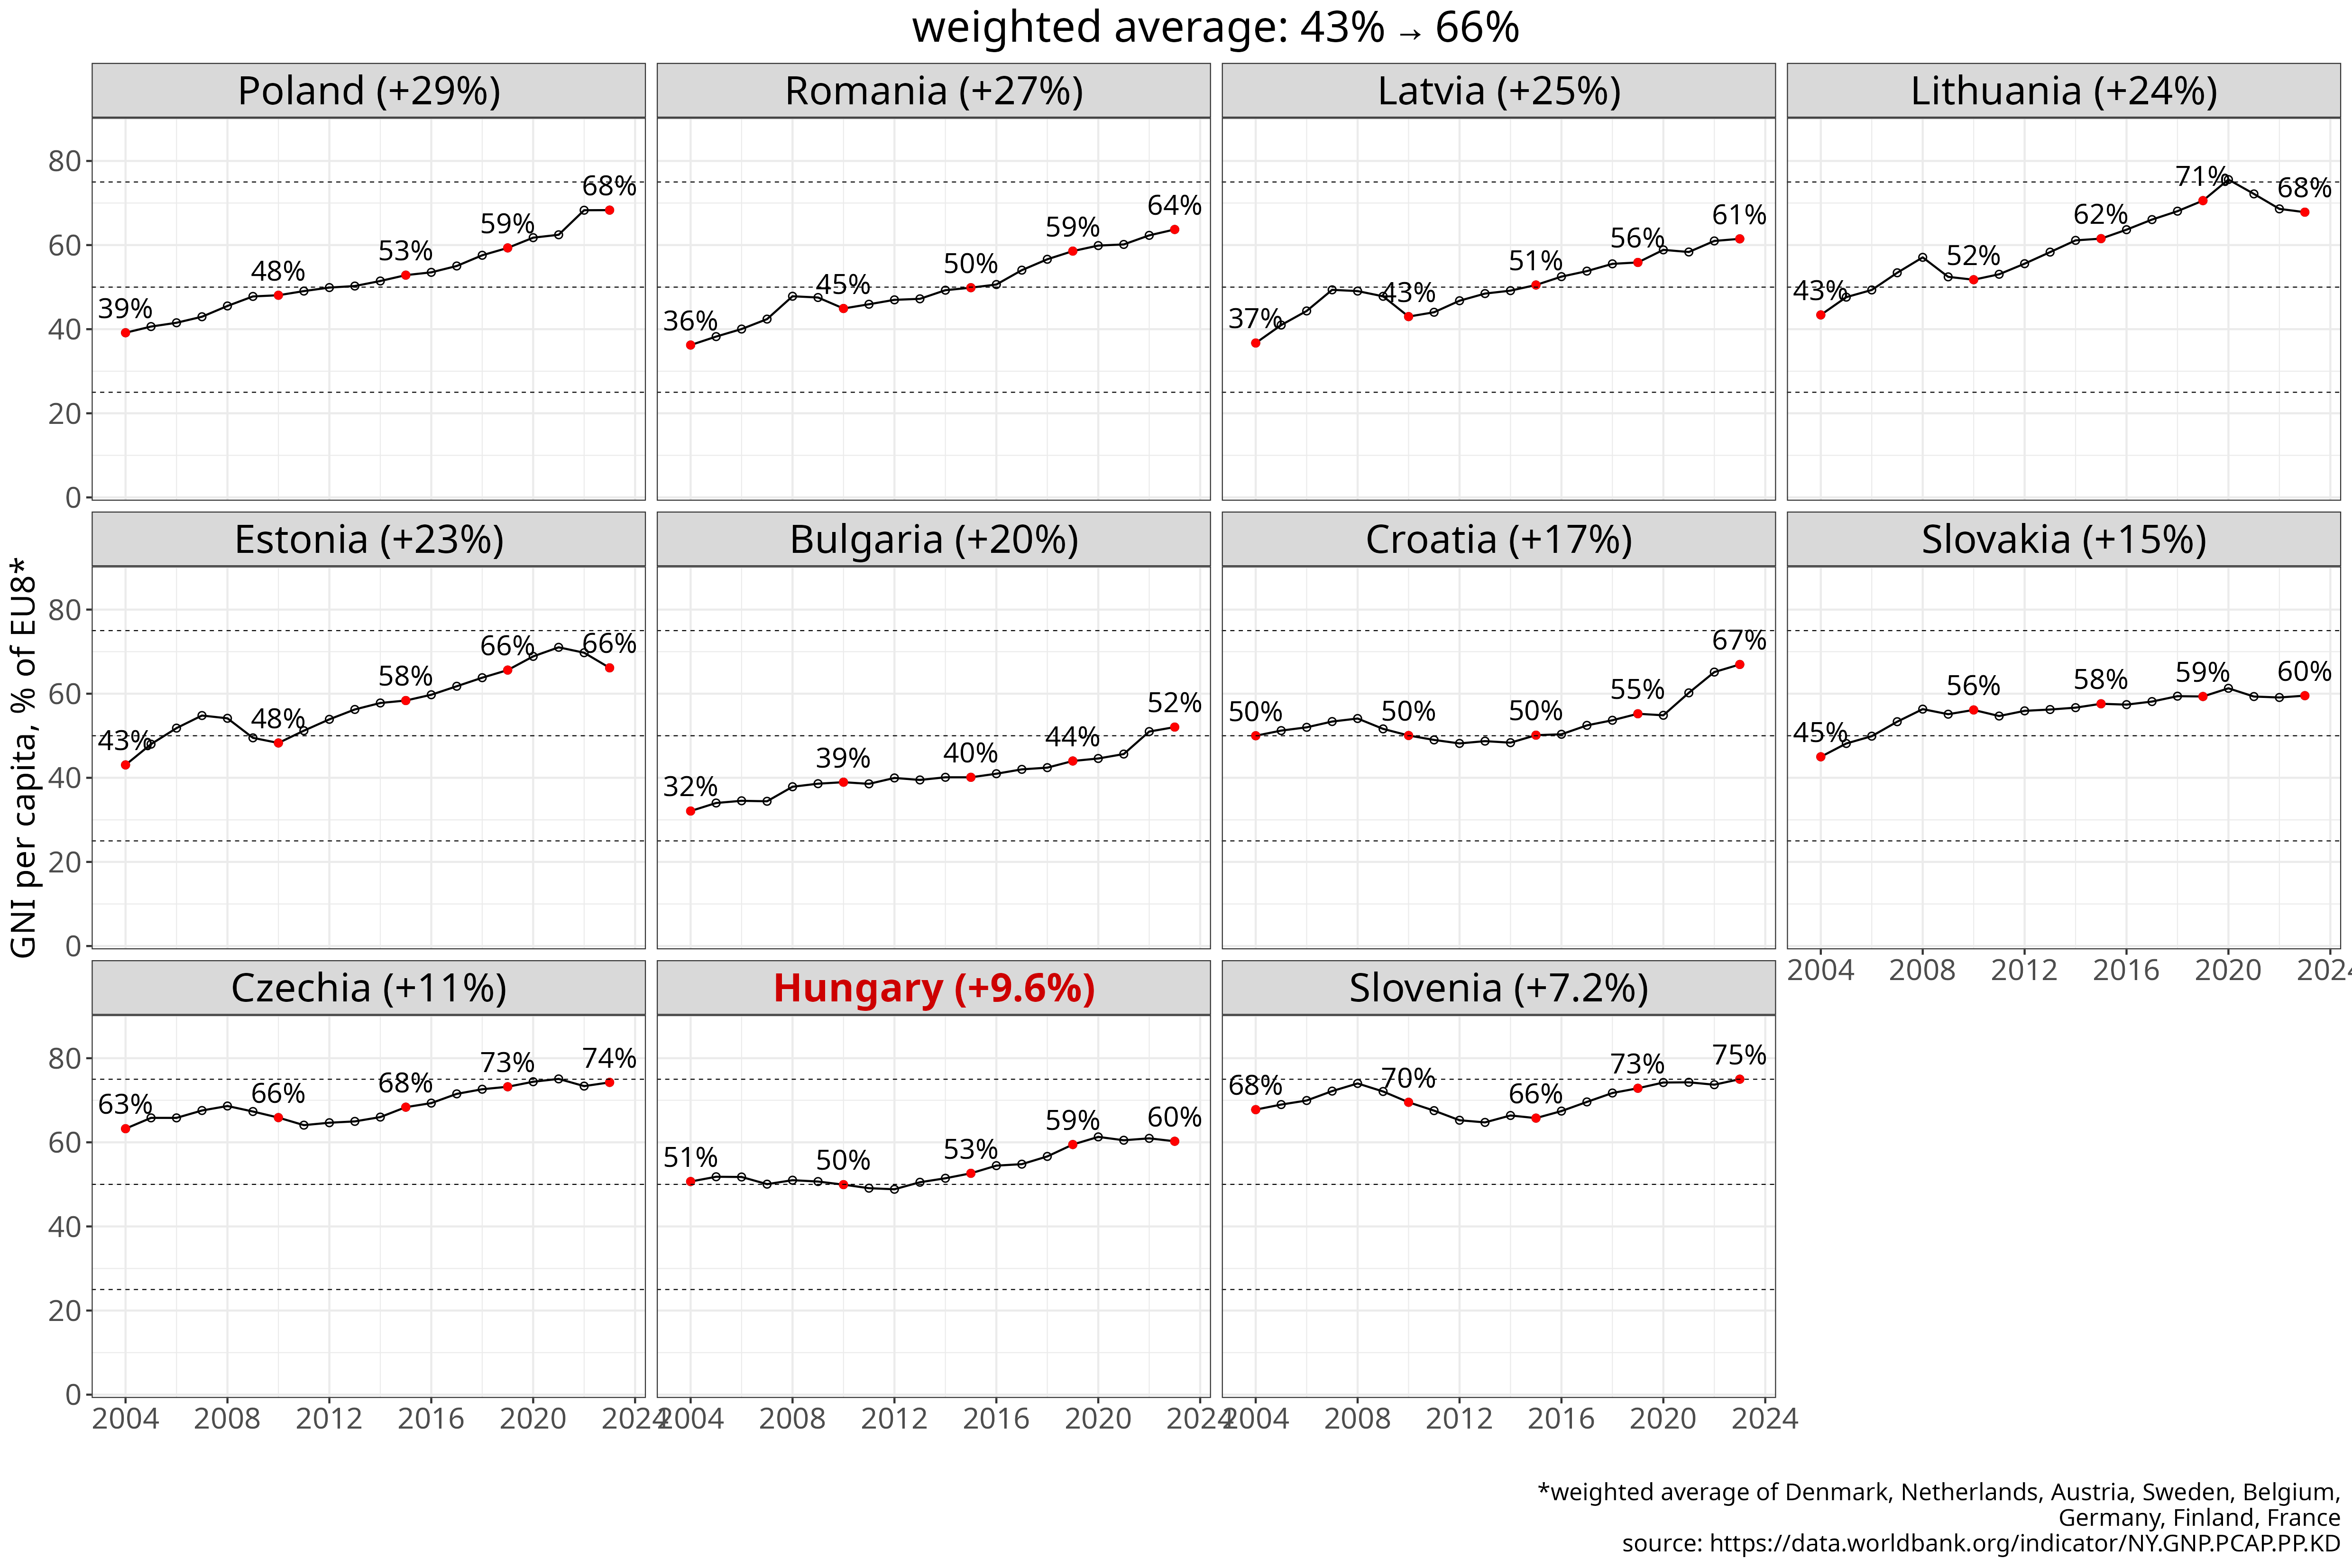
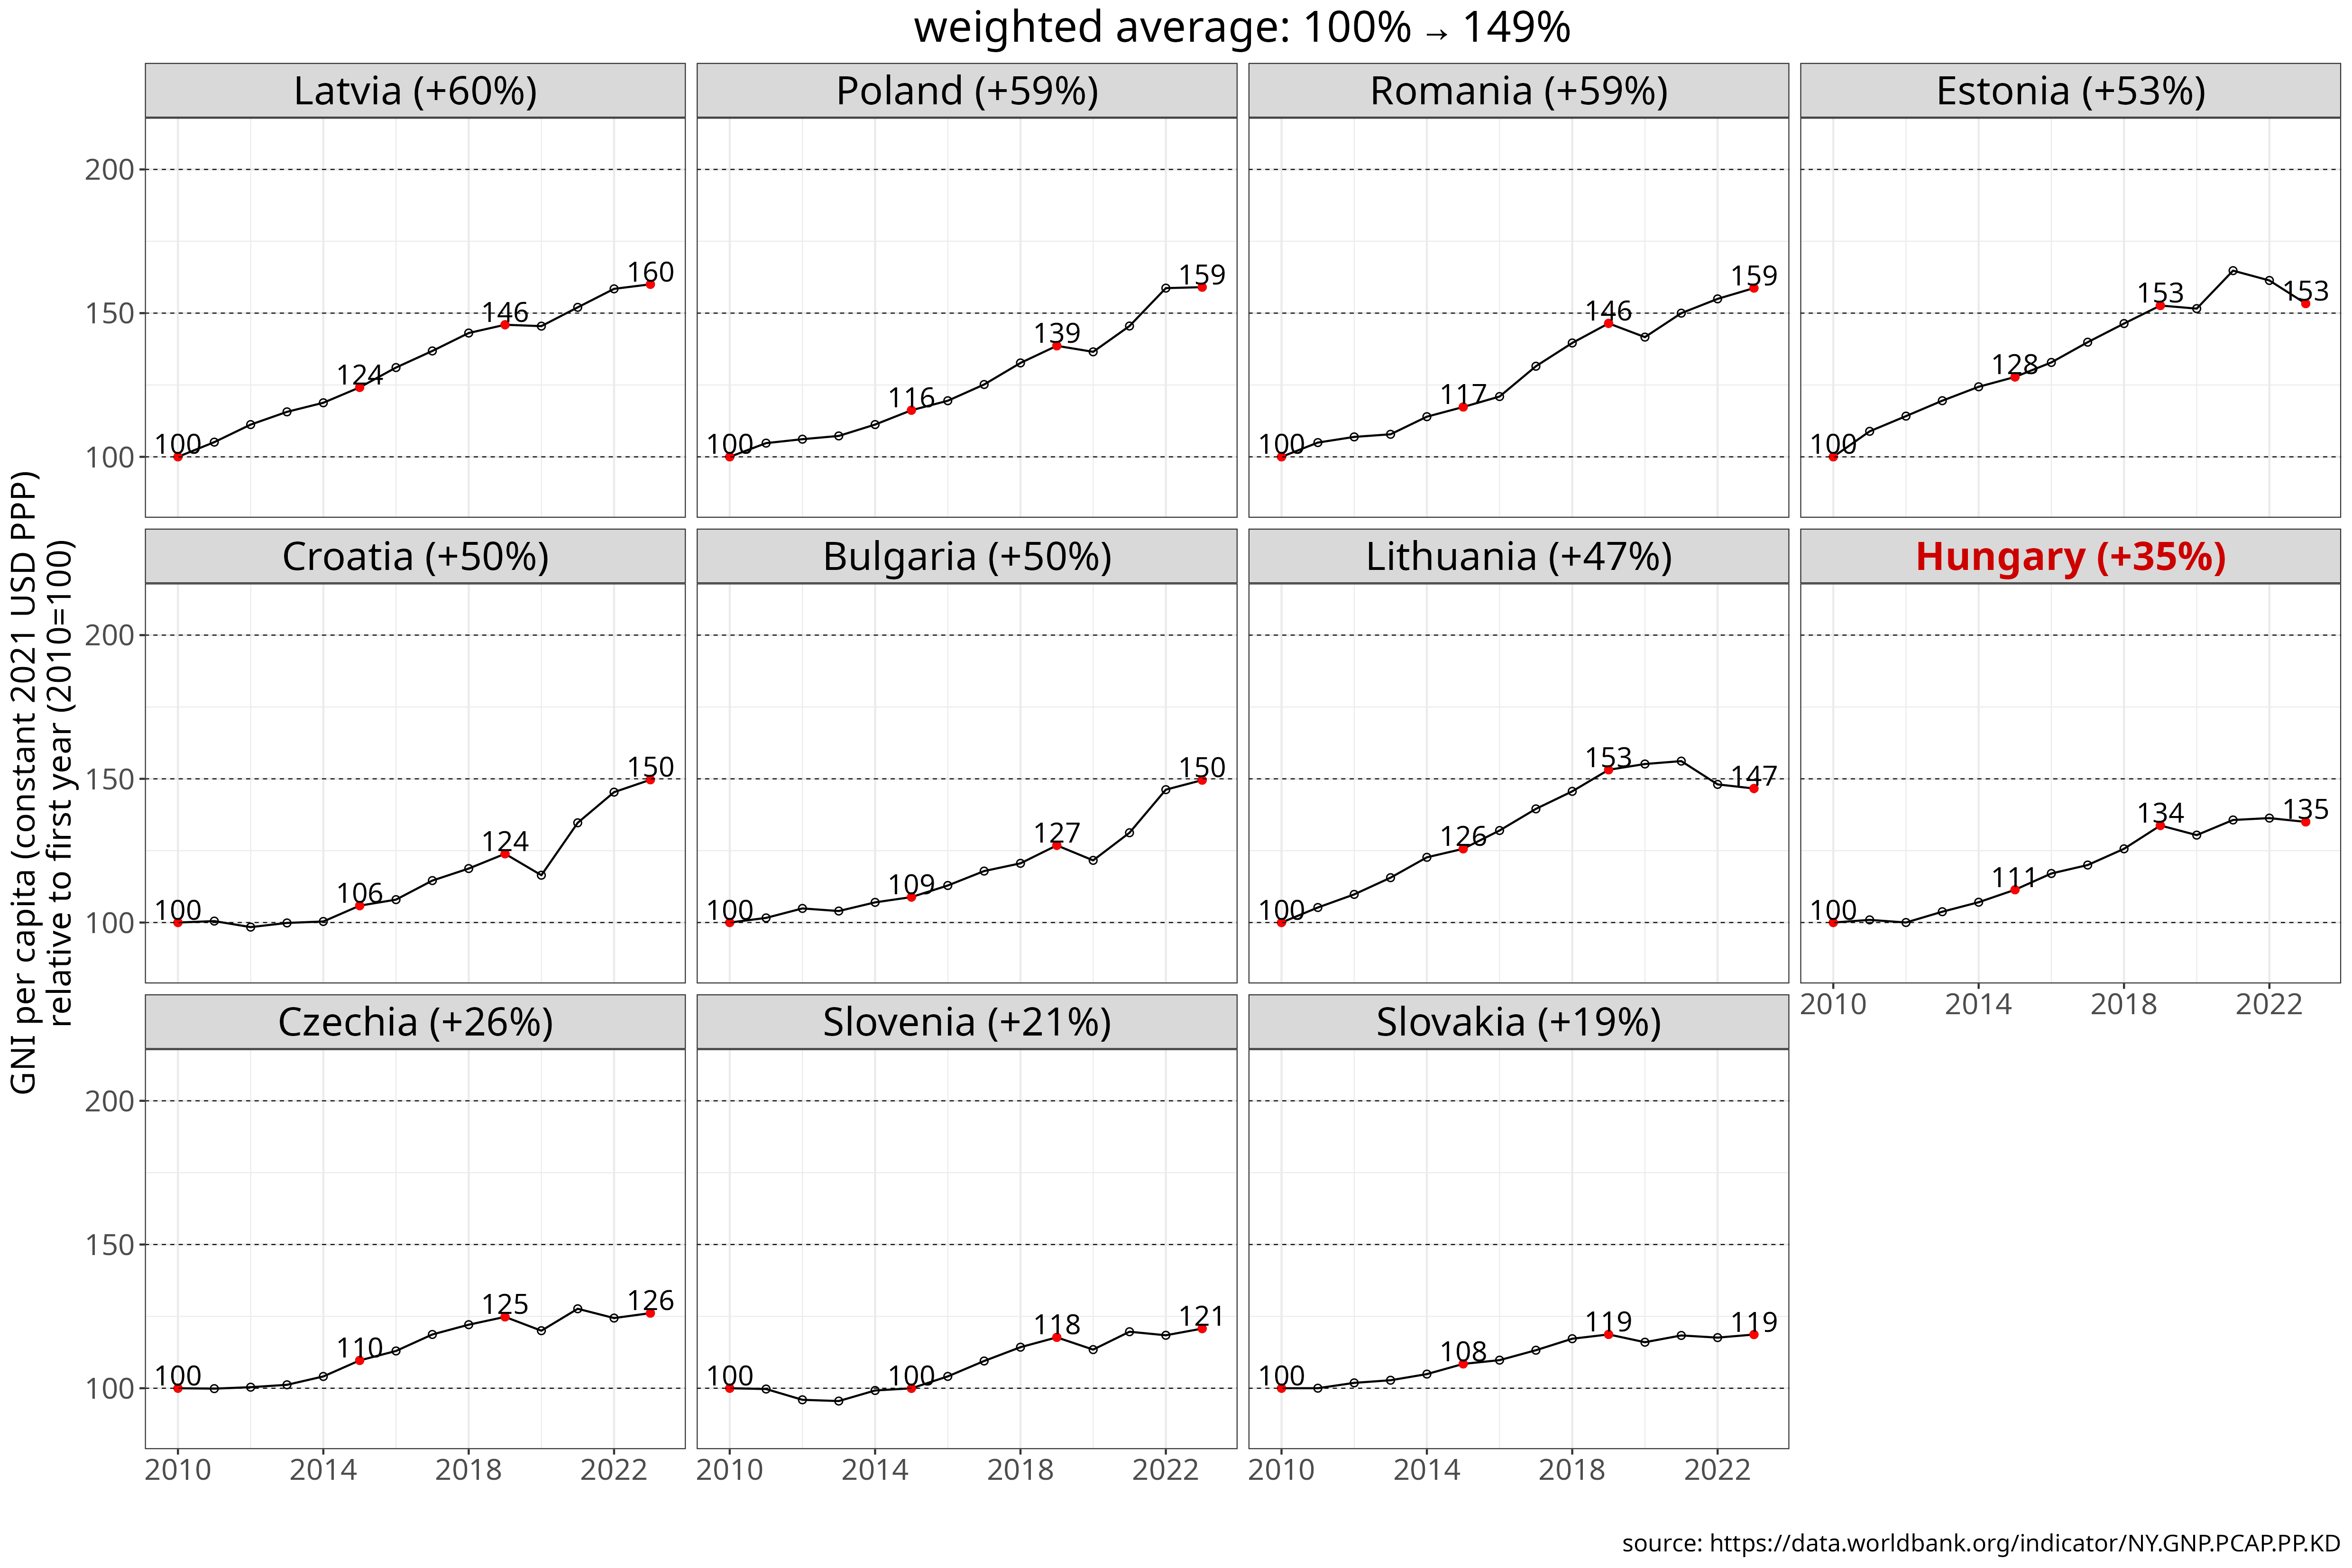
Figure 2 GNI per capita since 2004, measured in constant 2021 international dollars (PPP).
The chart shows levels (const. USD PPP), indexed values relative to 2004 and 2010, and percentages of the EU8 weighted average. Countries are ranked by cumulative growth from the selected base year through 2023.
[download data]
[source]
Hungary’s +10% convergence in GNI per capita to the EU8 benchmark over two decades - compared with +23% for the CEE region as a whole - represents a remarkably poor performance. The only comparably weak convergence story is Slovakia’s, which has shown almost no progress since 2010. Considering relative change since 2010 alone, Slovakia ranks worst, while Hungary is the second worst, excluding Czechia and Slovenia, which started (and finished) from levels 30-40% higher than HU.
As can be seen from Figure 2, Hungary saw two prolonged periods of stagnation, from 2005 to 2012 and from 2022 to today. While the Baltics have also suffered in the last three years, they had stronger growth in the previous periods, so their cumulative performance has been better. It is only Slovakia where the growth model seems to be similarly stuck as in HU.
| country | % of EU8 | relative to initial value (%) | absolute value (thousand USD PPP) |
|---|---|---|---|
| Poland | +29% (39→68) | +107% | +21.8k (20.4→42.2) |
| Romania | +27% (36→64) | +108% | +20.5k (18.9→39.4) |
| Latvia | +25% (37→61) | +98% | +18.8k (19.2→38) |
| Lithuania | +24% (43→68) | +85% | +19.3k (22.6→41.9) |
| Estonia | +23% (43→66) | +82% | +18.4k (22.5→40.9) |
| Bulgaria | +20% (32→52) | +92% | +15.4k (16.8→32.2) |
| Croatia | +17% (50→67) | +59% | +15.3k (26.1→41.4) |
| Slovakia | +15% (45→60) | +57% | +13.3k (23.5→36.8) |
| Czechia | +11% (63→74) | +39% | +12.9k (33→45.9) |
| Hungary | +9.6% (51→60) | +41% | +10.8k (26.4→37.2) |
| Slovenia | +7.2% (68→75) | +31% | +11k (35.4→46.4) |
| country | % of EU8 | relative to initial value (%) | absolute value (thousand USD PPP) |
|---|---|---|---|
| Poland | +20% (48→68) | +59% | +15.7k (26.5→42.2) |
| Romania | +19% (45→64) | +59% | +14.6k (24.8→39.4) |
| Estonia | +18% (48→66) | +53% | +14.2k (26.7→40.9) |
| Latvia | +18% (43→61) | +60% | +14.3k (23.7→38) |
| Croatia | +17% (50→67) | +50% | +13.7k (27.6→41.4) |
| Lithuania | +16% (52→68) | +47% | +13.3k (28.6→41.9) |
| Bulgaria | +13% (39→52) | +50% | +10.7k (21.5→32.2) |
| Hungary | +10% (50→60) | +35% | +9.7k (27.6→37.2) |
| Czechia | +8.4% (66→74) | +26% | +9.5k (36.4→45.9) |
| Slovenia | +5.5% (70→75) | +21% | +8k (38.4→46.4) |
| Slovakia | +3.4% (56→60) | +19% | +5.8k (31→36.8) |
Table 2: Cumulative change in GNI per capita from 2004 to 2024 or from 2010 to 2023, shown as a percentage of the EU8 weighted average, relative to the initial year, and in absolute terms (constant 2021 international dollars (PPP)). Countries are ranked by the EU8-relative measure.
Labour productivity
Ultimately, growth in output and income has to come from productivity growth. If a national economy suffers from chronic underemployment, increasing the employment ratio can temporarily boost output, but this effect is naturally limited by demographics. Similarly, in high-income countries, annual working hours tend to be stable - or even decline slowly - and extending hours is neither politically feasible nor socially desirable.
The convergence of the CEE region’s labour productivity to the EU8 average illustrates this dynamic. Productivity convergence has been somewhat weaker than convergence of GDP or GNI per capita, going from 40 to 57% of the EU8 benchmark in the 2004-2024 period. Some of CEE’s per capita convergence in output was due to a substantial increase in the employment ratio from the mid-2000s onward, reflecting recovery from the post-transition recession and the resulting structural underemployment. However, this source of growth has largely run its course, leaving labour productivity as the main plausible driver of further growth.
We again see a similar picture for the relative performance of countries as for the previous indicators. Romania, Poland and the Baltics have seen the strongest convergence in output per hour worked, with Romania tripling and the Baltics roughly doubling their level.
What is potentially worrisome for the convergence prospects of the whole region is that the two most advanced regional countries (CZ and SI) have only managed to move 6-10% closer to the EU8 average in 20 years, a yearly rate of less than 0.5%.
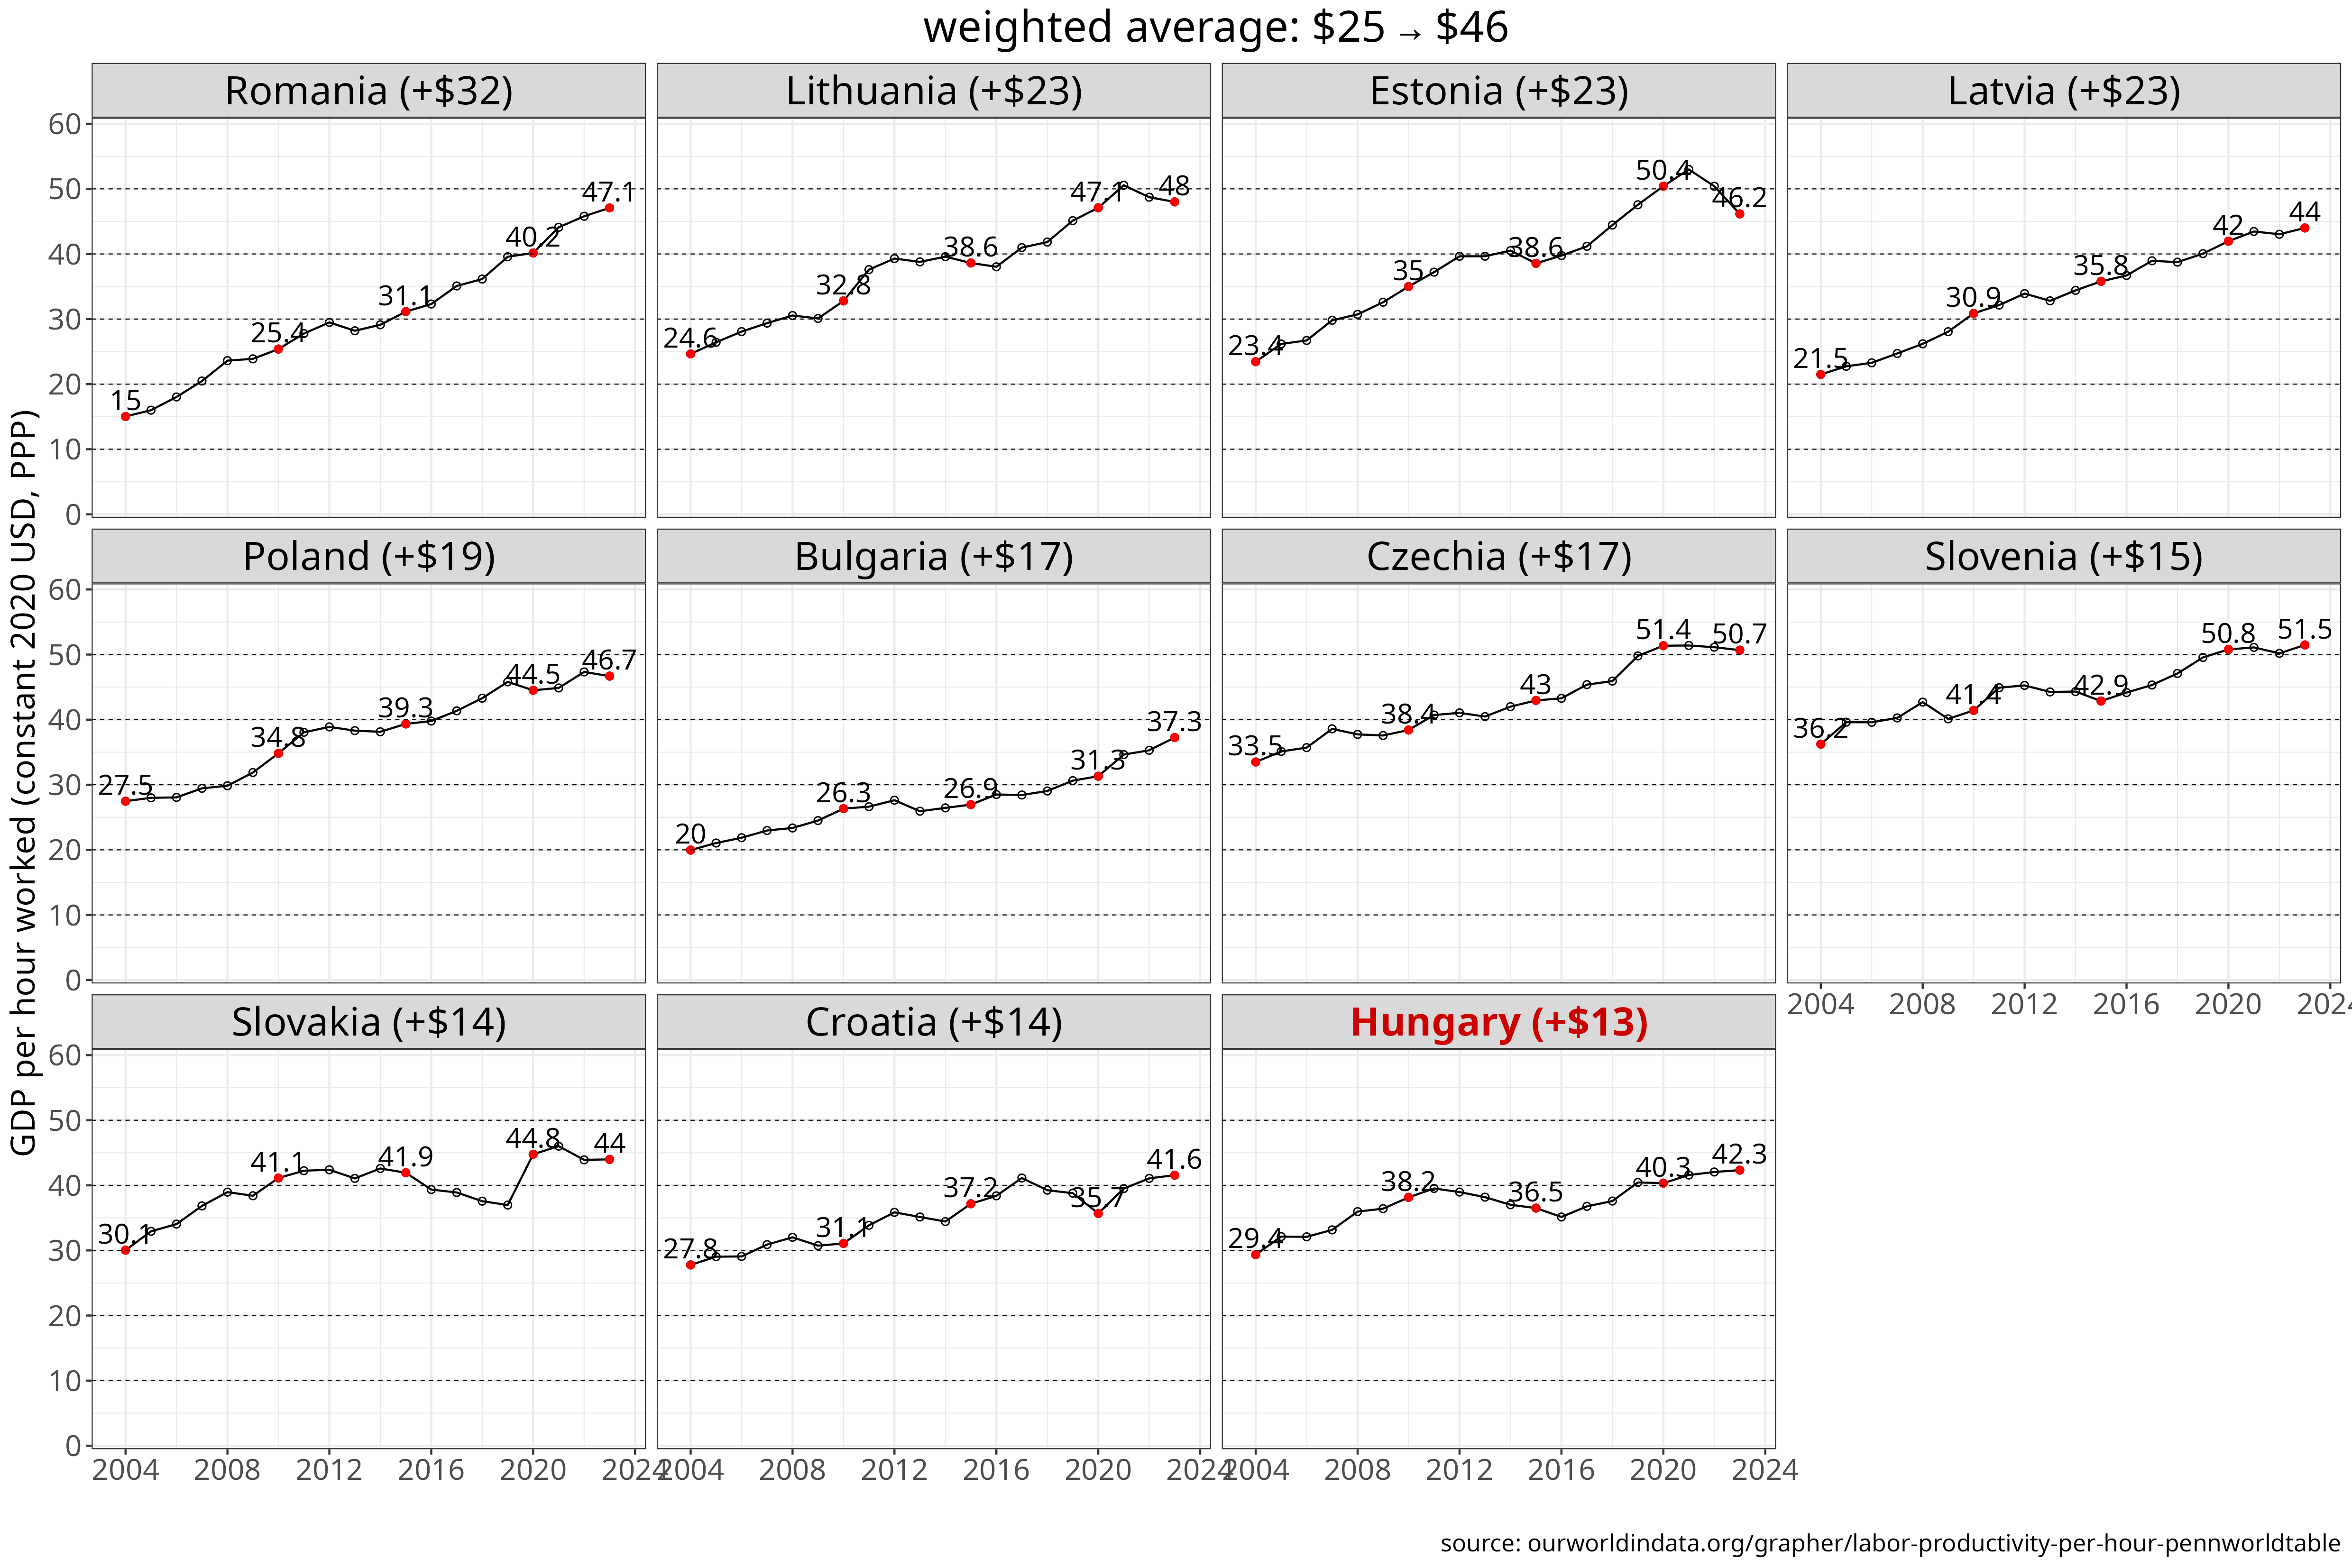
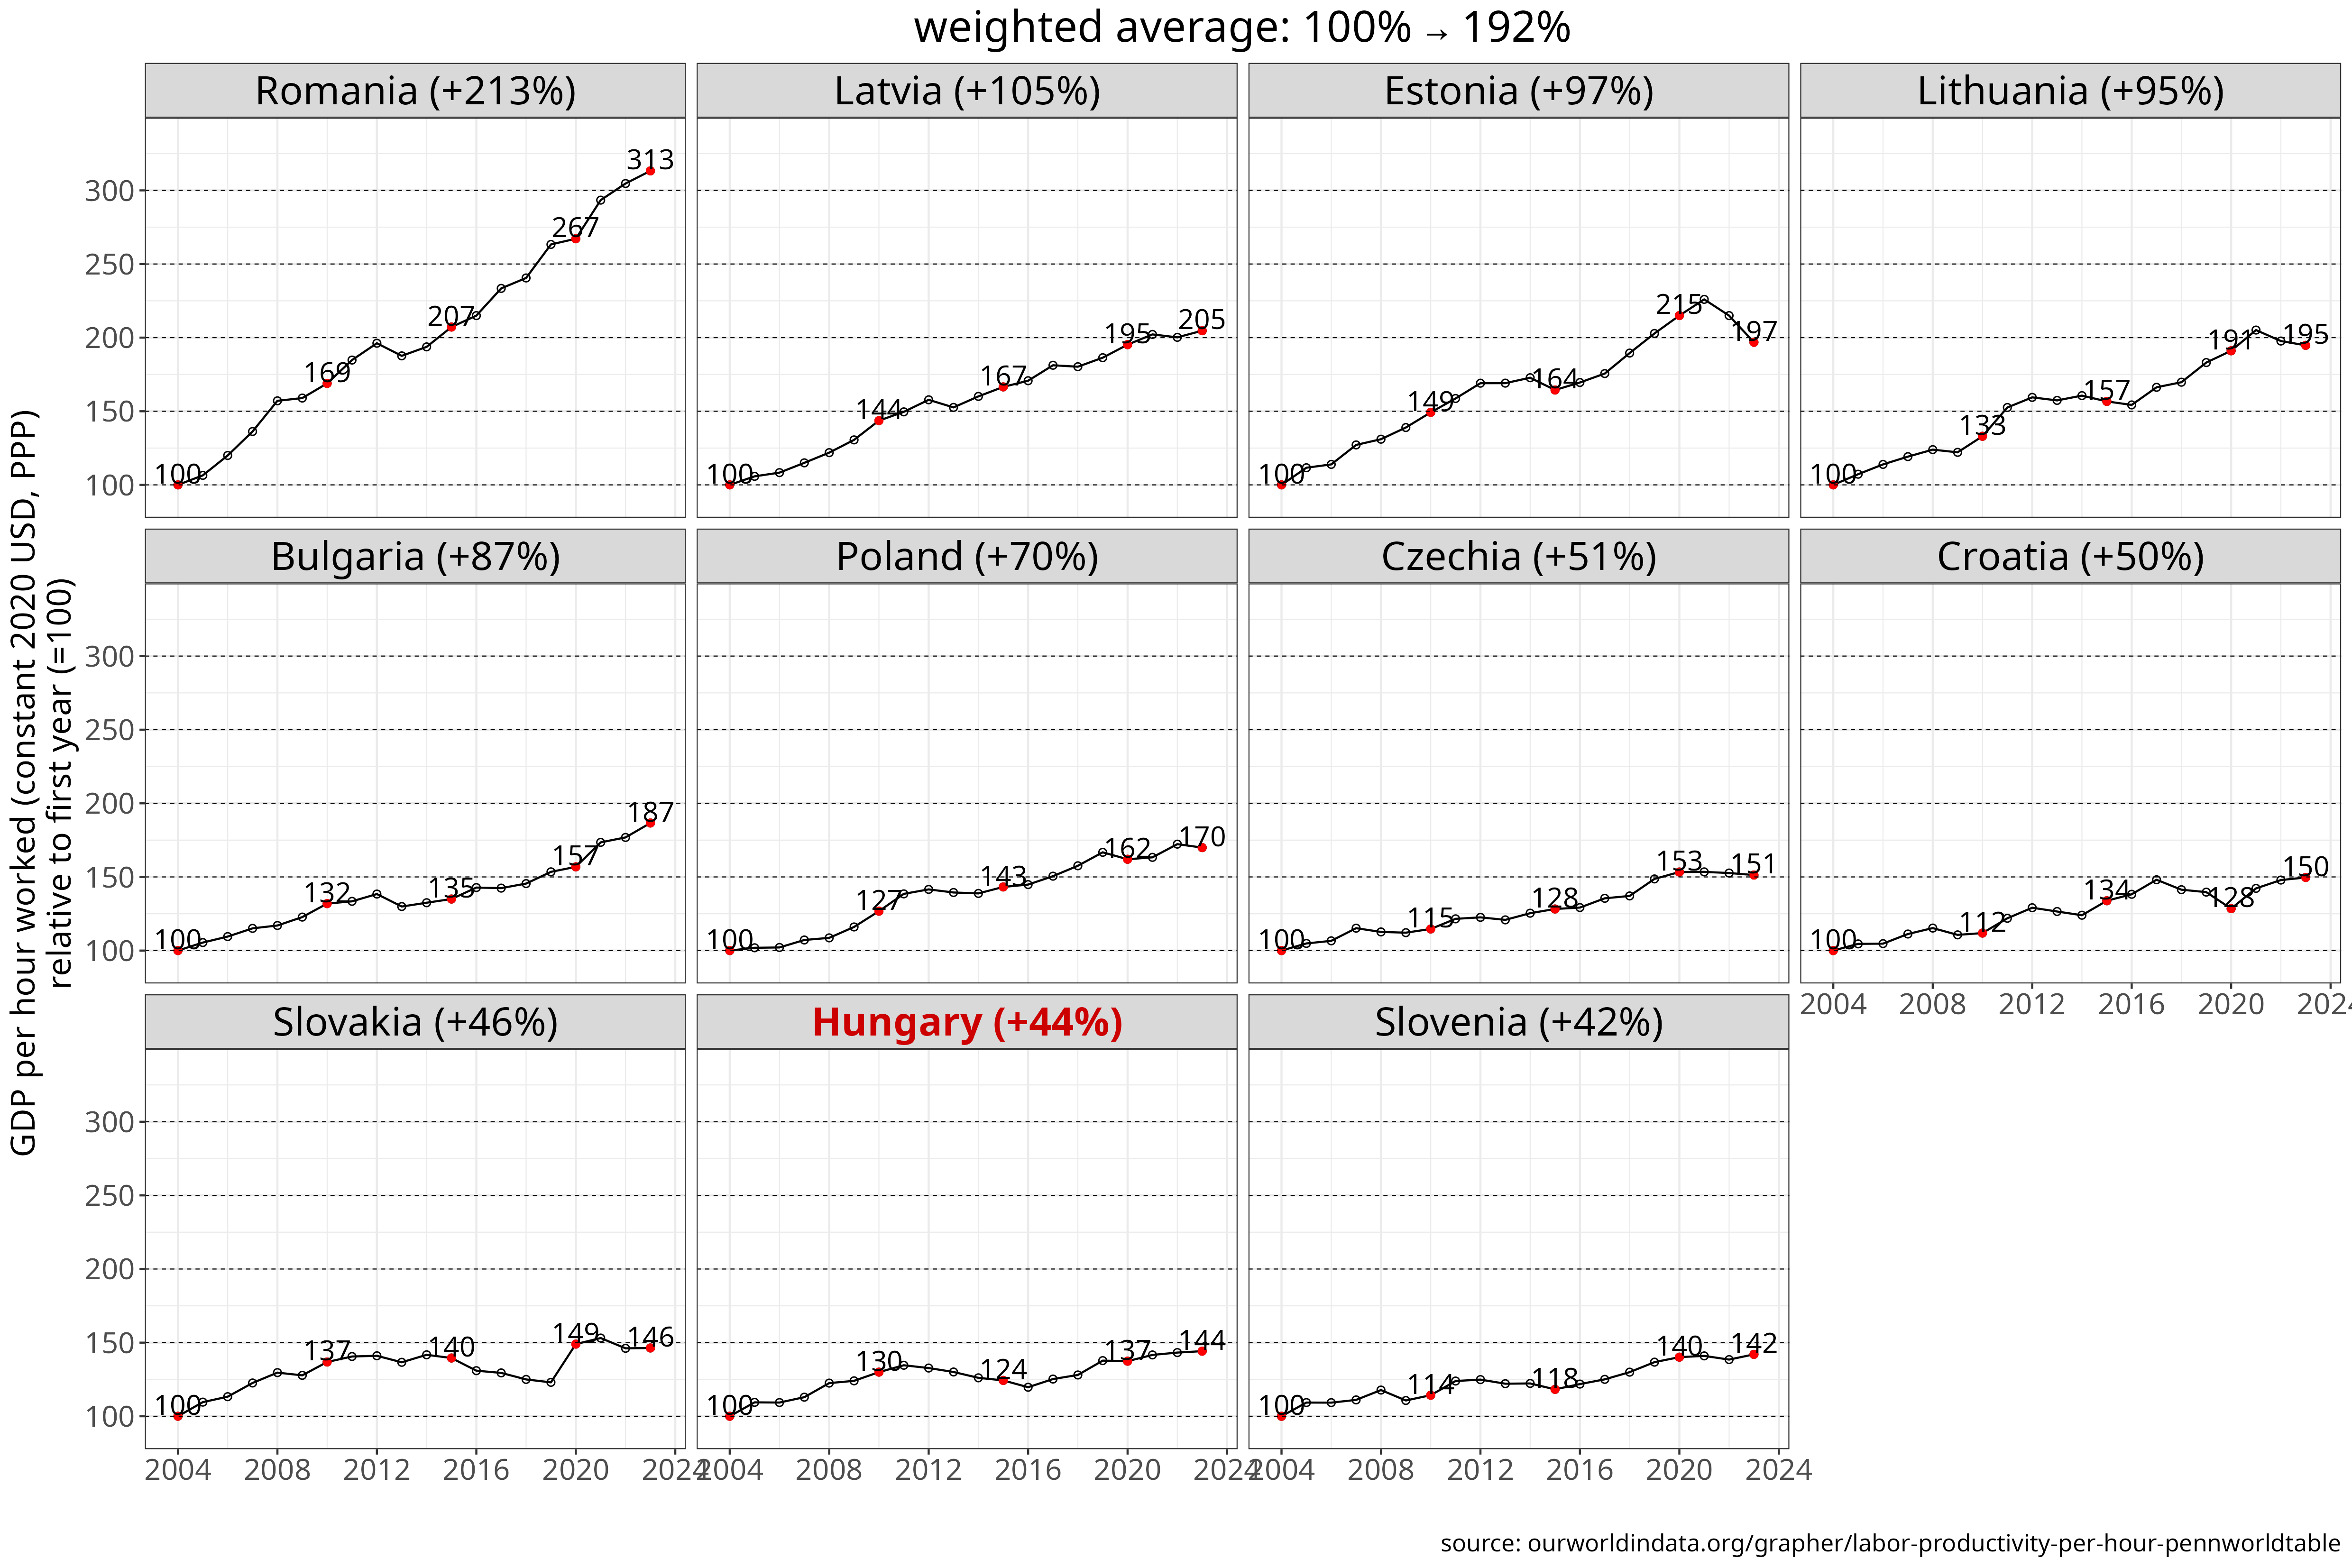
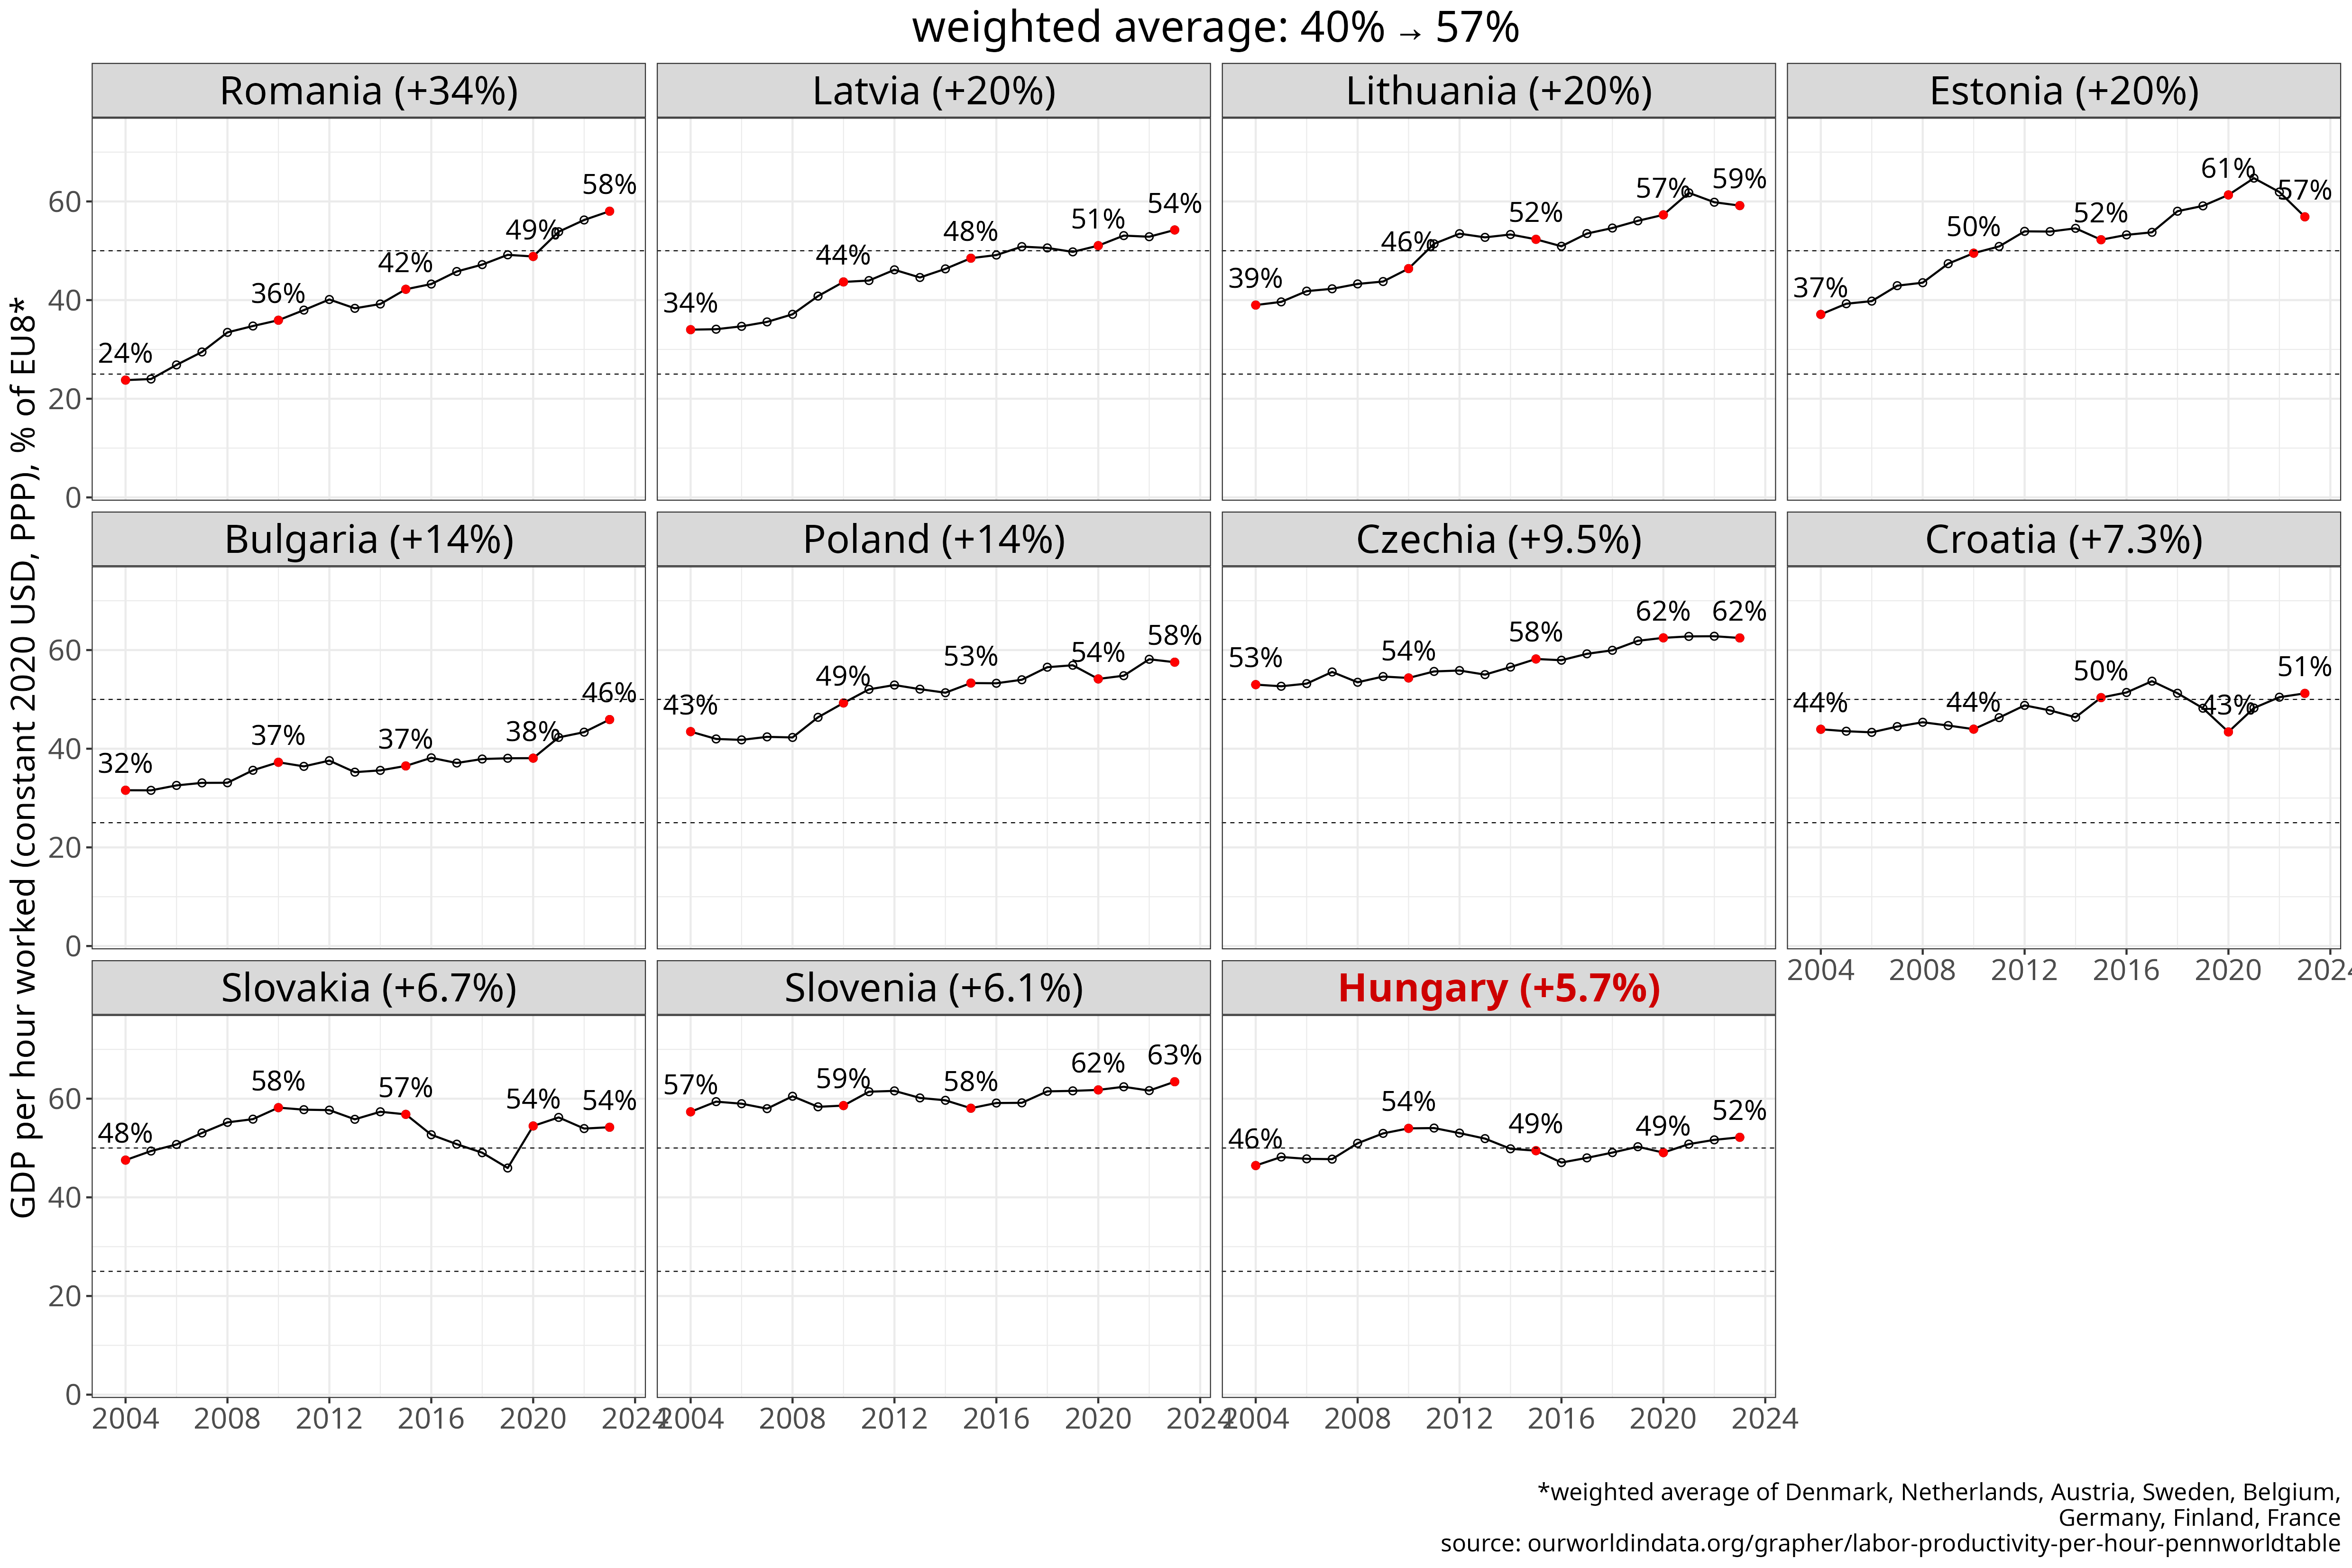
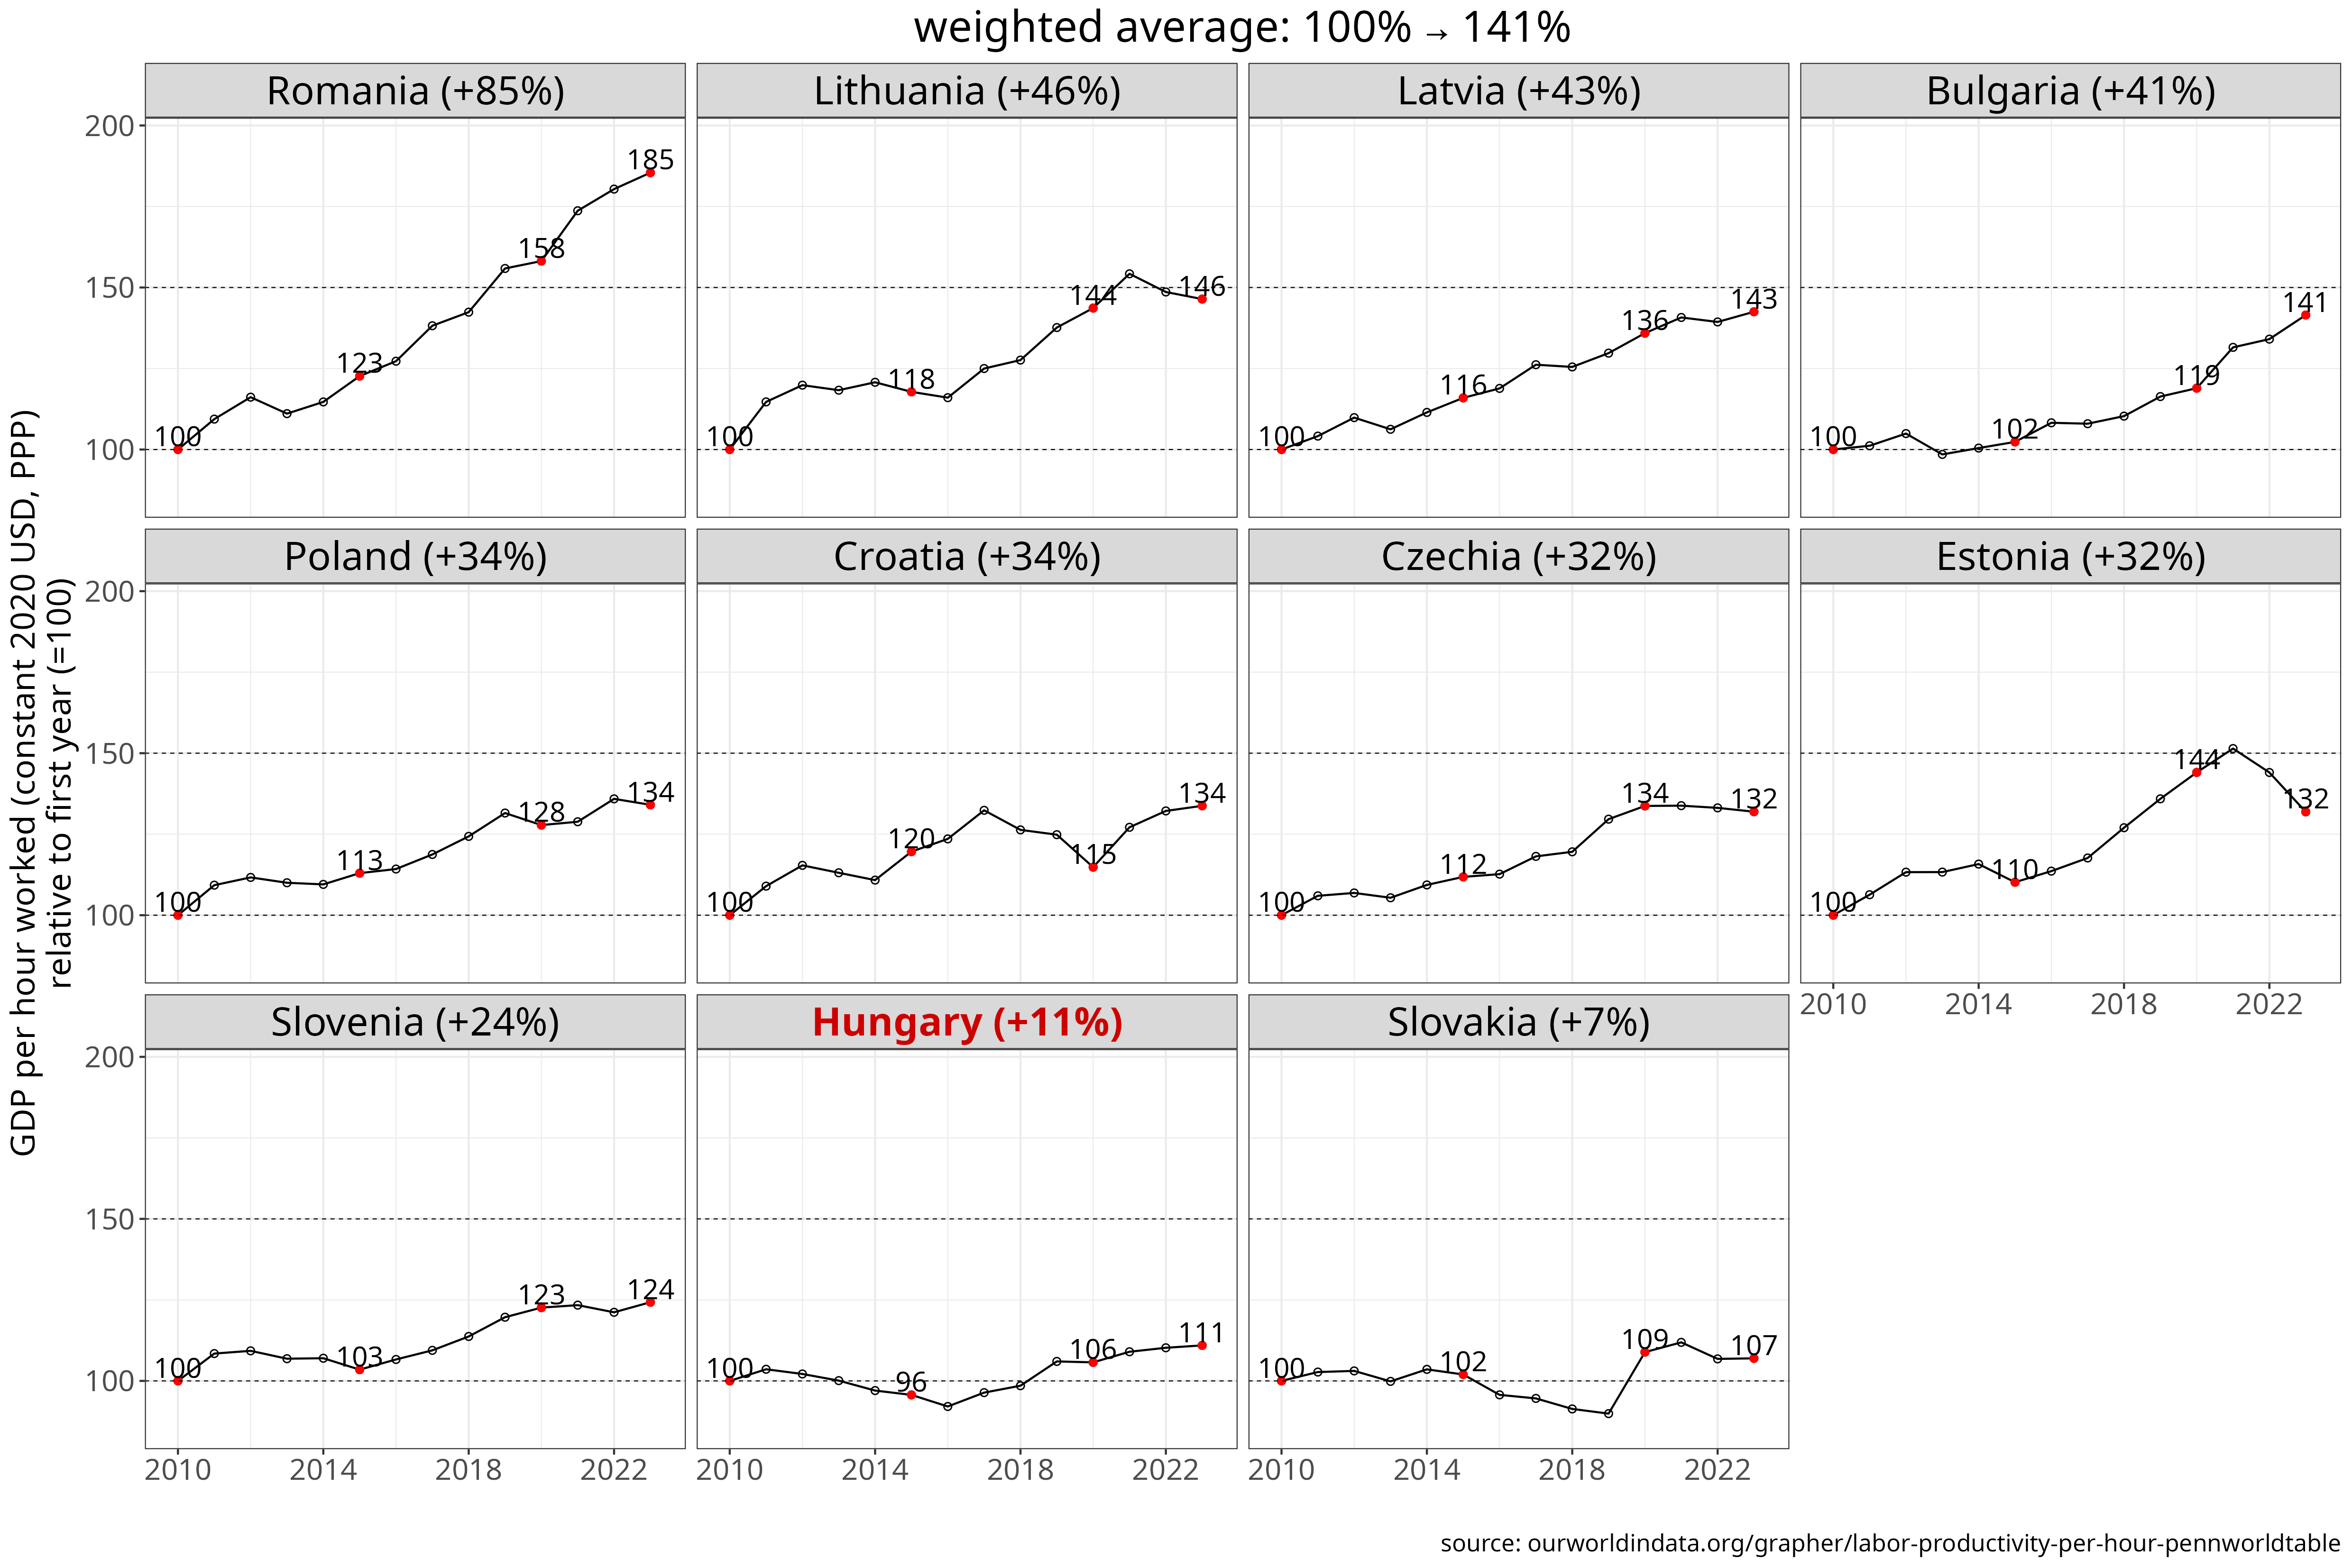
Figure 3 Labour productivity (output per hour worked) since 2004, measured in constant 2021 international dollars (PPP). The chart shows levels (const. USD PPP), indexed values relative to 2004 and 2010, and percentages of the EU8 weighted average. Countries are ranked by cumulative growth from the selected base year through 2024. [download data] [source]
Measured from the 2004 baseline, Hungary ranks last in labour productivity convergence, both in absolute terms (constant USD PPP) and when expressed as a percentage of the EU-8 average. When measured from 2010 it ranks second from the bottom. Remarkably, by 2024, Hungary’s labour productivity was at a lower percentage of the EU8 average than in 2010. Only Hungary and Slovakia experienced a relative decline in labour productivity compared to Western Europe over this period. Croatia also experienced very weak convergence. Looking at the dynamics, there may be some signs of improvement though for HU: labour productivity began to increase from 2016 onward, although still at a slower pace than in most of the region.
| country | % of EU8 | relative to initial value (%) | absolute value (PPS) |
|---|---|---|---|
| Romania | +34% (24→58) | +213% | +32 (15→47.1) |
| Estonia | +20% (37→57) | +97% | +22.7 (23.4→46.2) |
| Latvia | +20% (34→54) | +105% | +22.5 (21.5→44) |
| Lithuania | +20% (39→59) | +95% | +23.4 (24.6→48) |
| Bulgaria | +14% (32→46) | +87% | +17.3 (20→37.3) |
| Poland | +14% (43→58) | +70% | +19.2 (27.5→46.7) |
| Czechia | +9.5% (53→62) | +51% | +17.2 (33.5→50.7) |
| Croatia | +7.3% (44→51) | +50% | +13.8 (27.8→41.6) |
| Slovakia | +6.7% (48→54) | +46% | +13.9 (30.1→44) |
| Slovenia | +6.1% (57→63) | +42% | +15.2 (36.2→51.5) |
| Hungary | +5.7% (46→52) | +44% | +13 (29.4→42.3) |
| country | % of EU8 | relative to initial value (%) | absolute value (PPS) |
|---|---|---|---|
| Romania | +22% (36→58) | +85% | +21.7 (25.4→47.1) |
| Lithuania | +13% (46→59) | +46% | +15.2 (32.8→48) |
| Latvia | +11% (44→54) | +43% | +13.1 (30.9→44) |
| Bulgaria | +8.7% (37→46) | +41% | +10.9 (26.3→37.3) |
| Poland | +8.3% (49→58) | +34% | +11.9 (34.8→46.7) |
| Czechia | +8.1% (54→62) | +32% | +12.3 (38.4→50.7) |
| Estonia | +7.4% (50→57) | +32% | +11.2 (35→46.2) |
| Croatia | +7.3% (44→51) | +34% | +10.5 (31.1→41.6) |
| Slovenia | +4.8% (59→63) | +24% | +10.1 (41.4→51.5) |
| Hungary | -1.8% (54→52) | +11% | +4.2 (38.2→42.3) |
| Slovakia | -4% (58→54) | +7% | +2.9 (41.1→44) |
Table 3: Cumulative change in labour productivity (per hour worked) from 2004 or 2010 to 2024, shown as a percentage of the EU8 weighted average, relative to the initial year, and in absolute terms (constant 2021 international dollars (PPP)). Countries are ranked by the EU8-relative measure.
Wages, earnings and income
Growth in output and productivity is one thing - but what about the incomes of workers and households? Has Hungary fallen behind its regional peers here as well? We now turn to wage and income indicators to answer these questions.
Annual average wages
We use the OECD database on annual average wages, expressed in purchasing power parities and constant 2021 US dollars. Since 2004, average annual wages in the CEE region have increased by 55% on average, with most of this growth occurring after 2010. Measured relative to the EU8 average, this meant that the CEE region moved from 46% to 63% of the Western European benchmark.
Romania, Croatia and Bulgaria are not included in this dataset, as they are not yet OECD members. Among the remaining eight countries, the strongest convergence is again observed in the Baltic states and Poland, and in this case also in Slovenia, which almost reached the EU8 average (92%) by 2024.
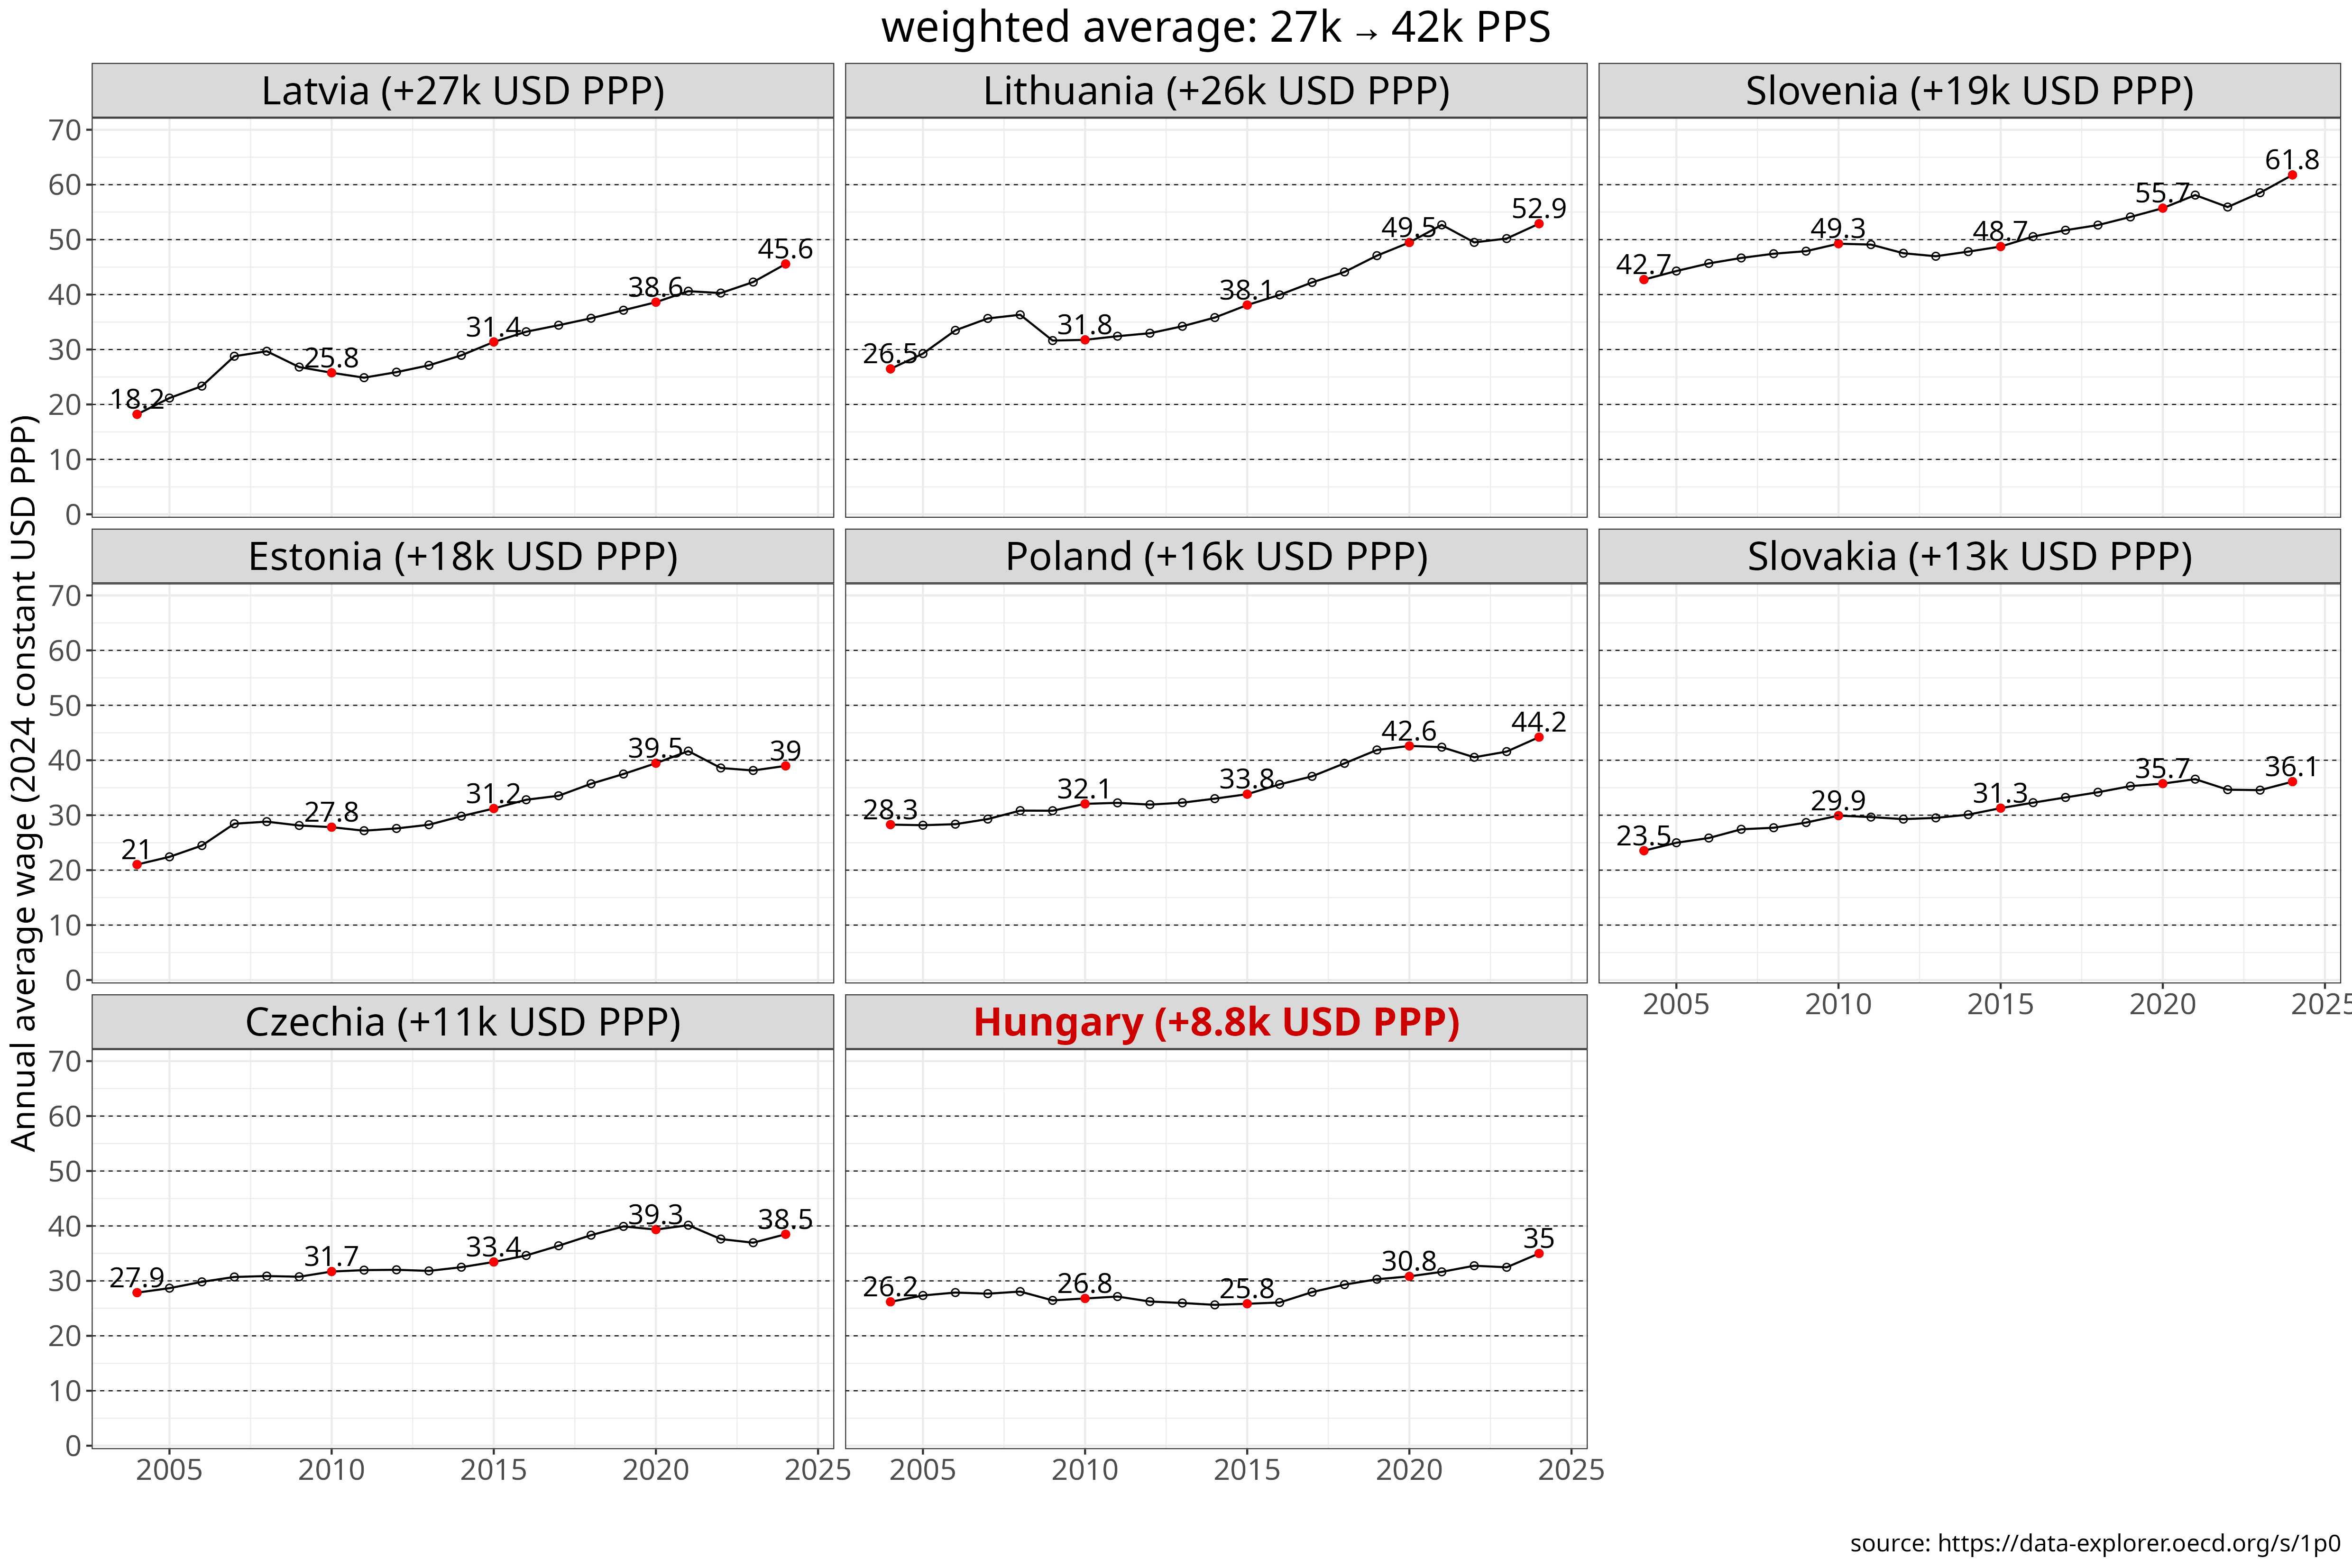
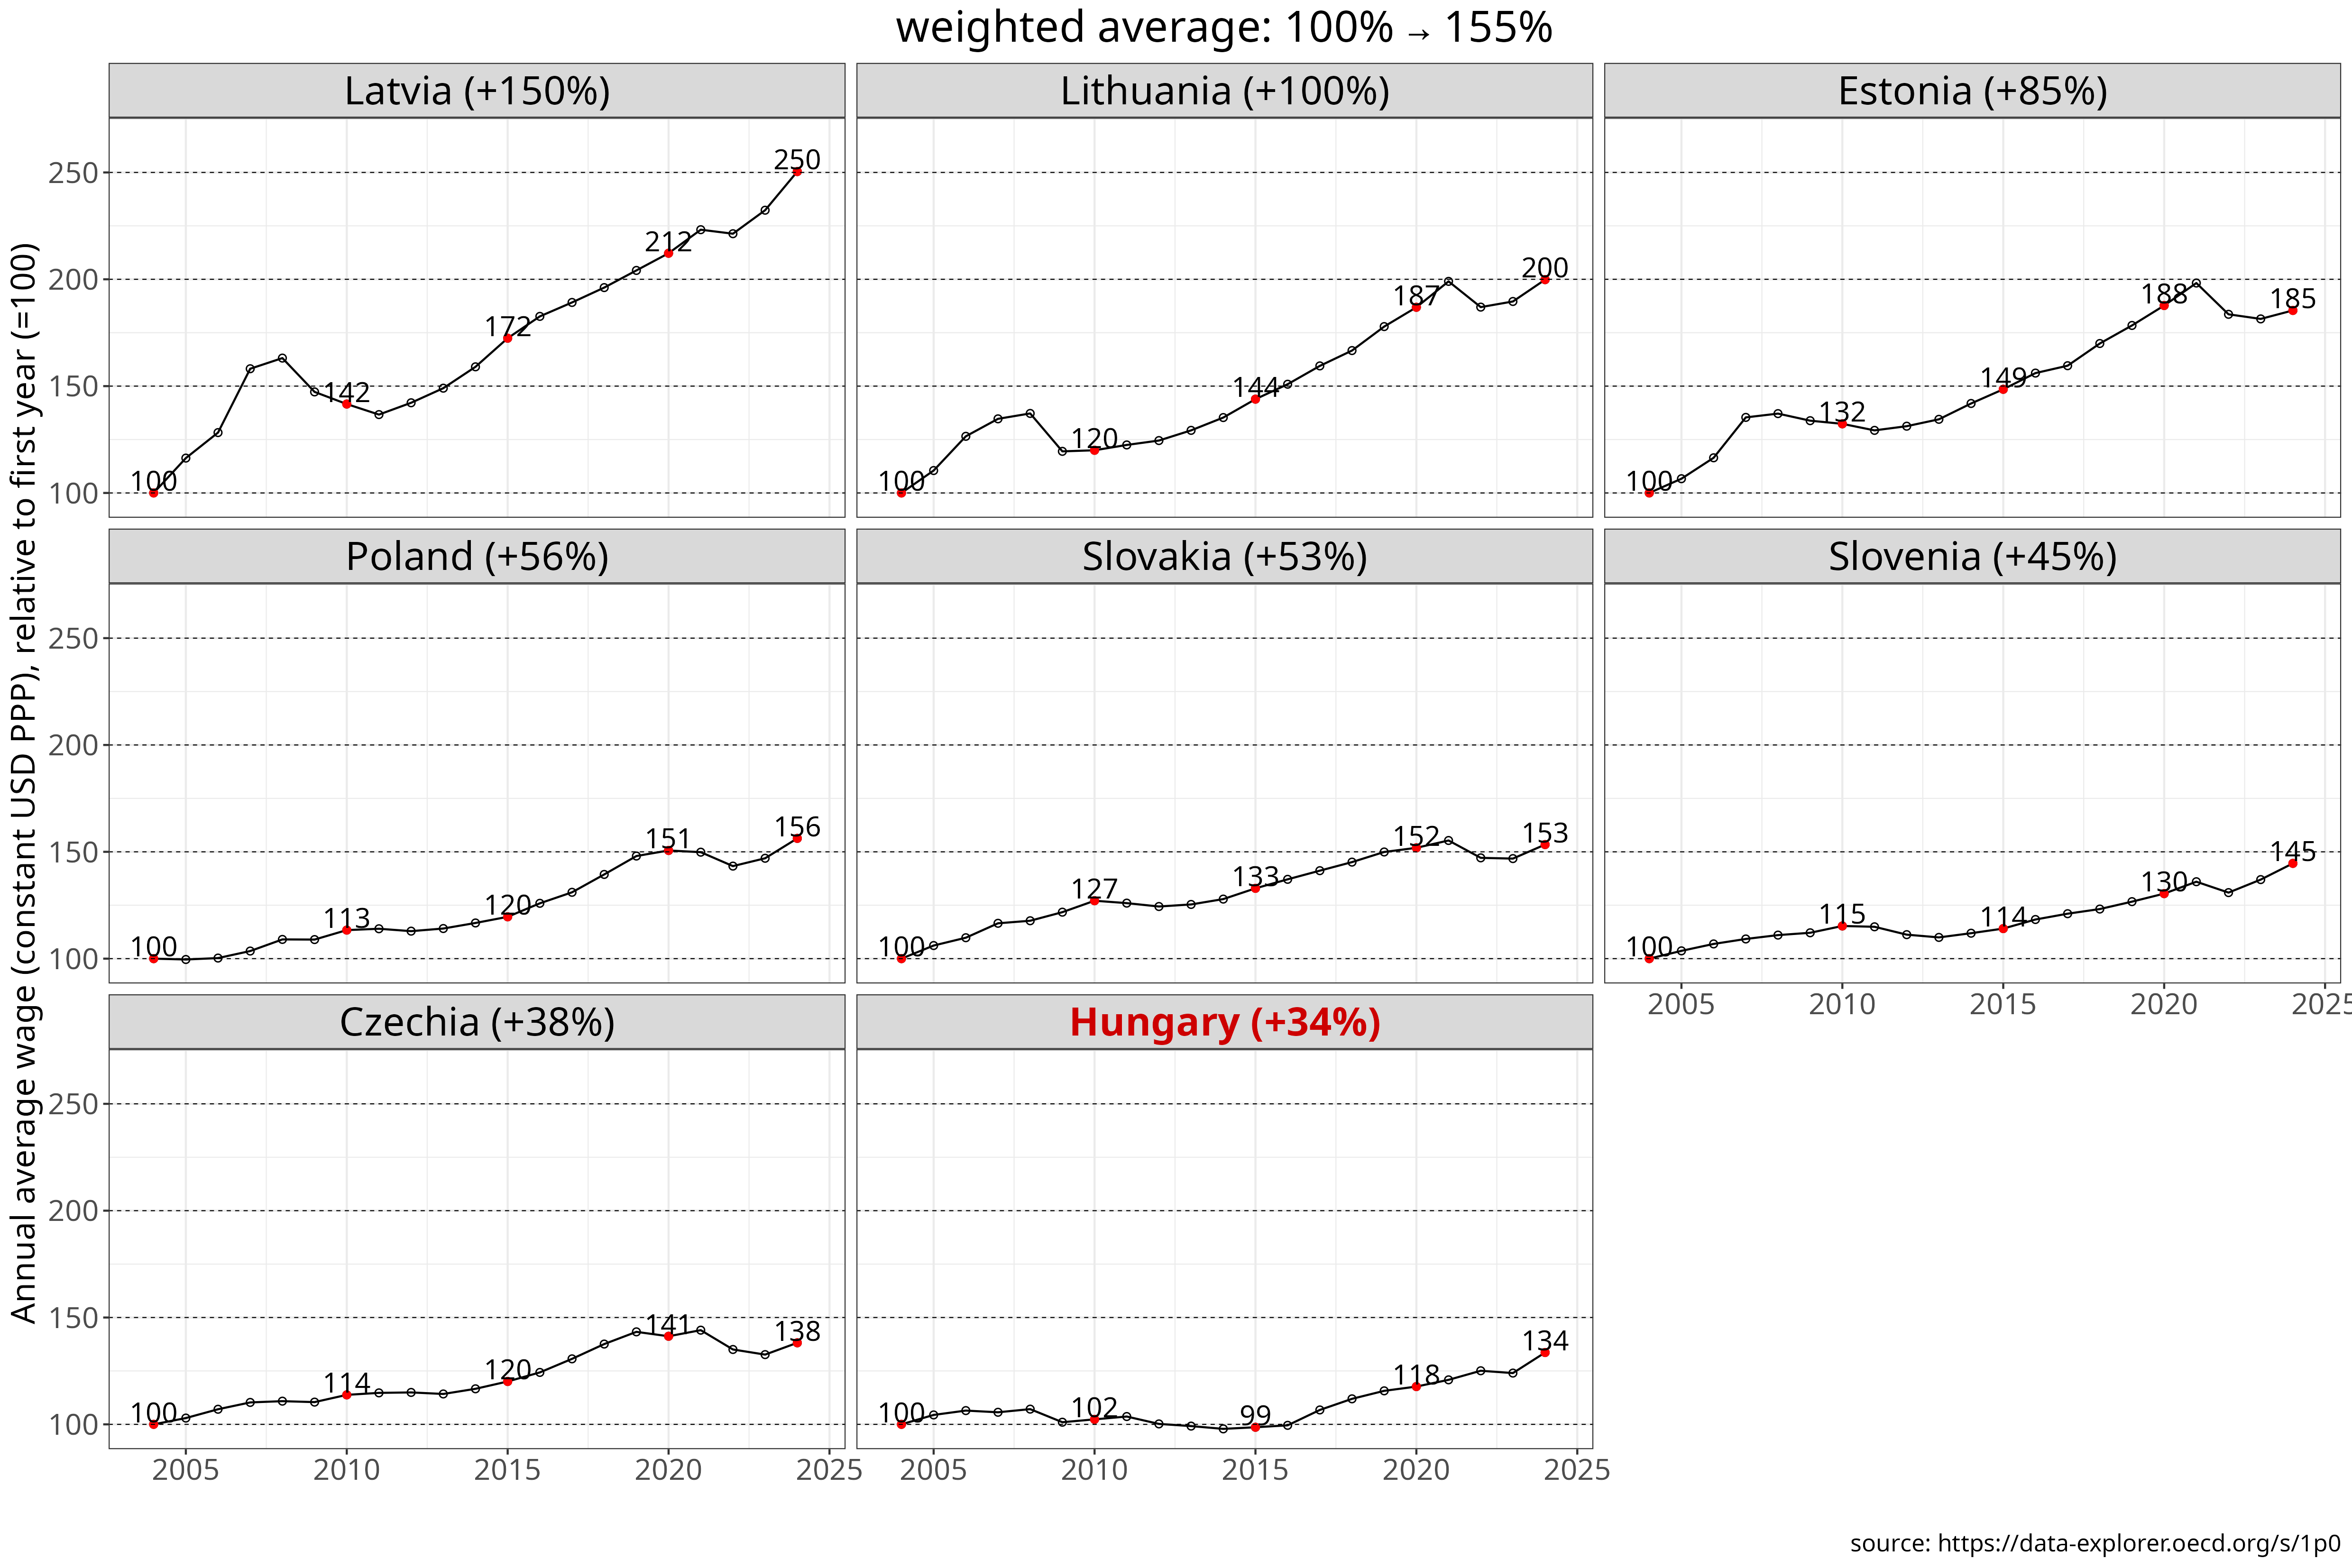
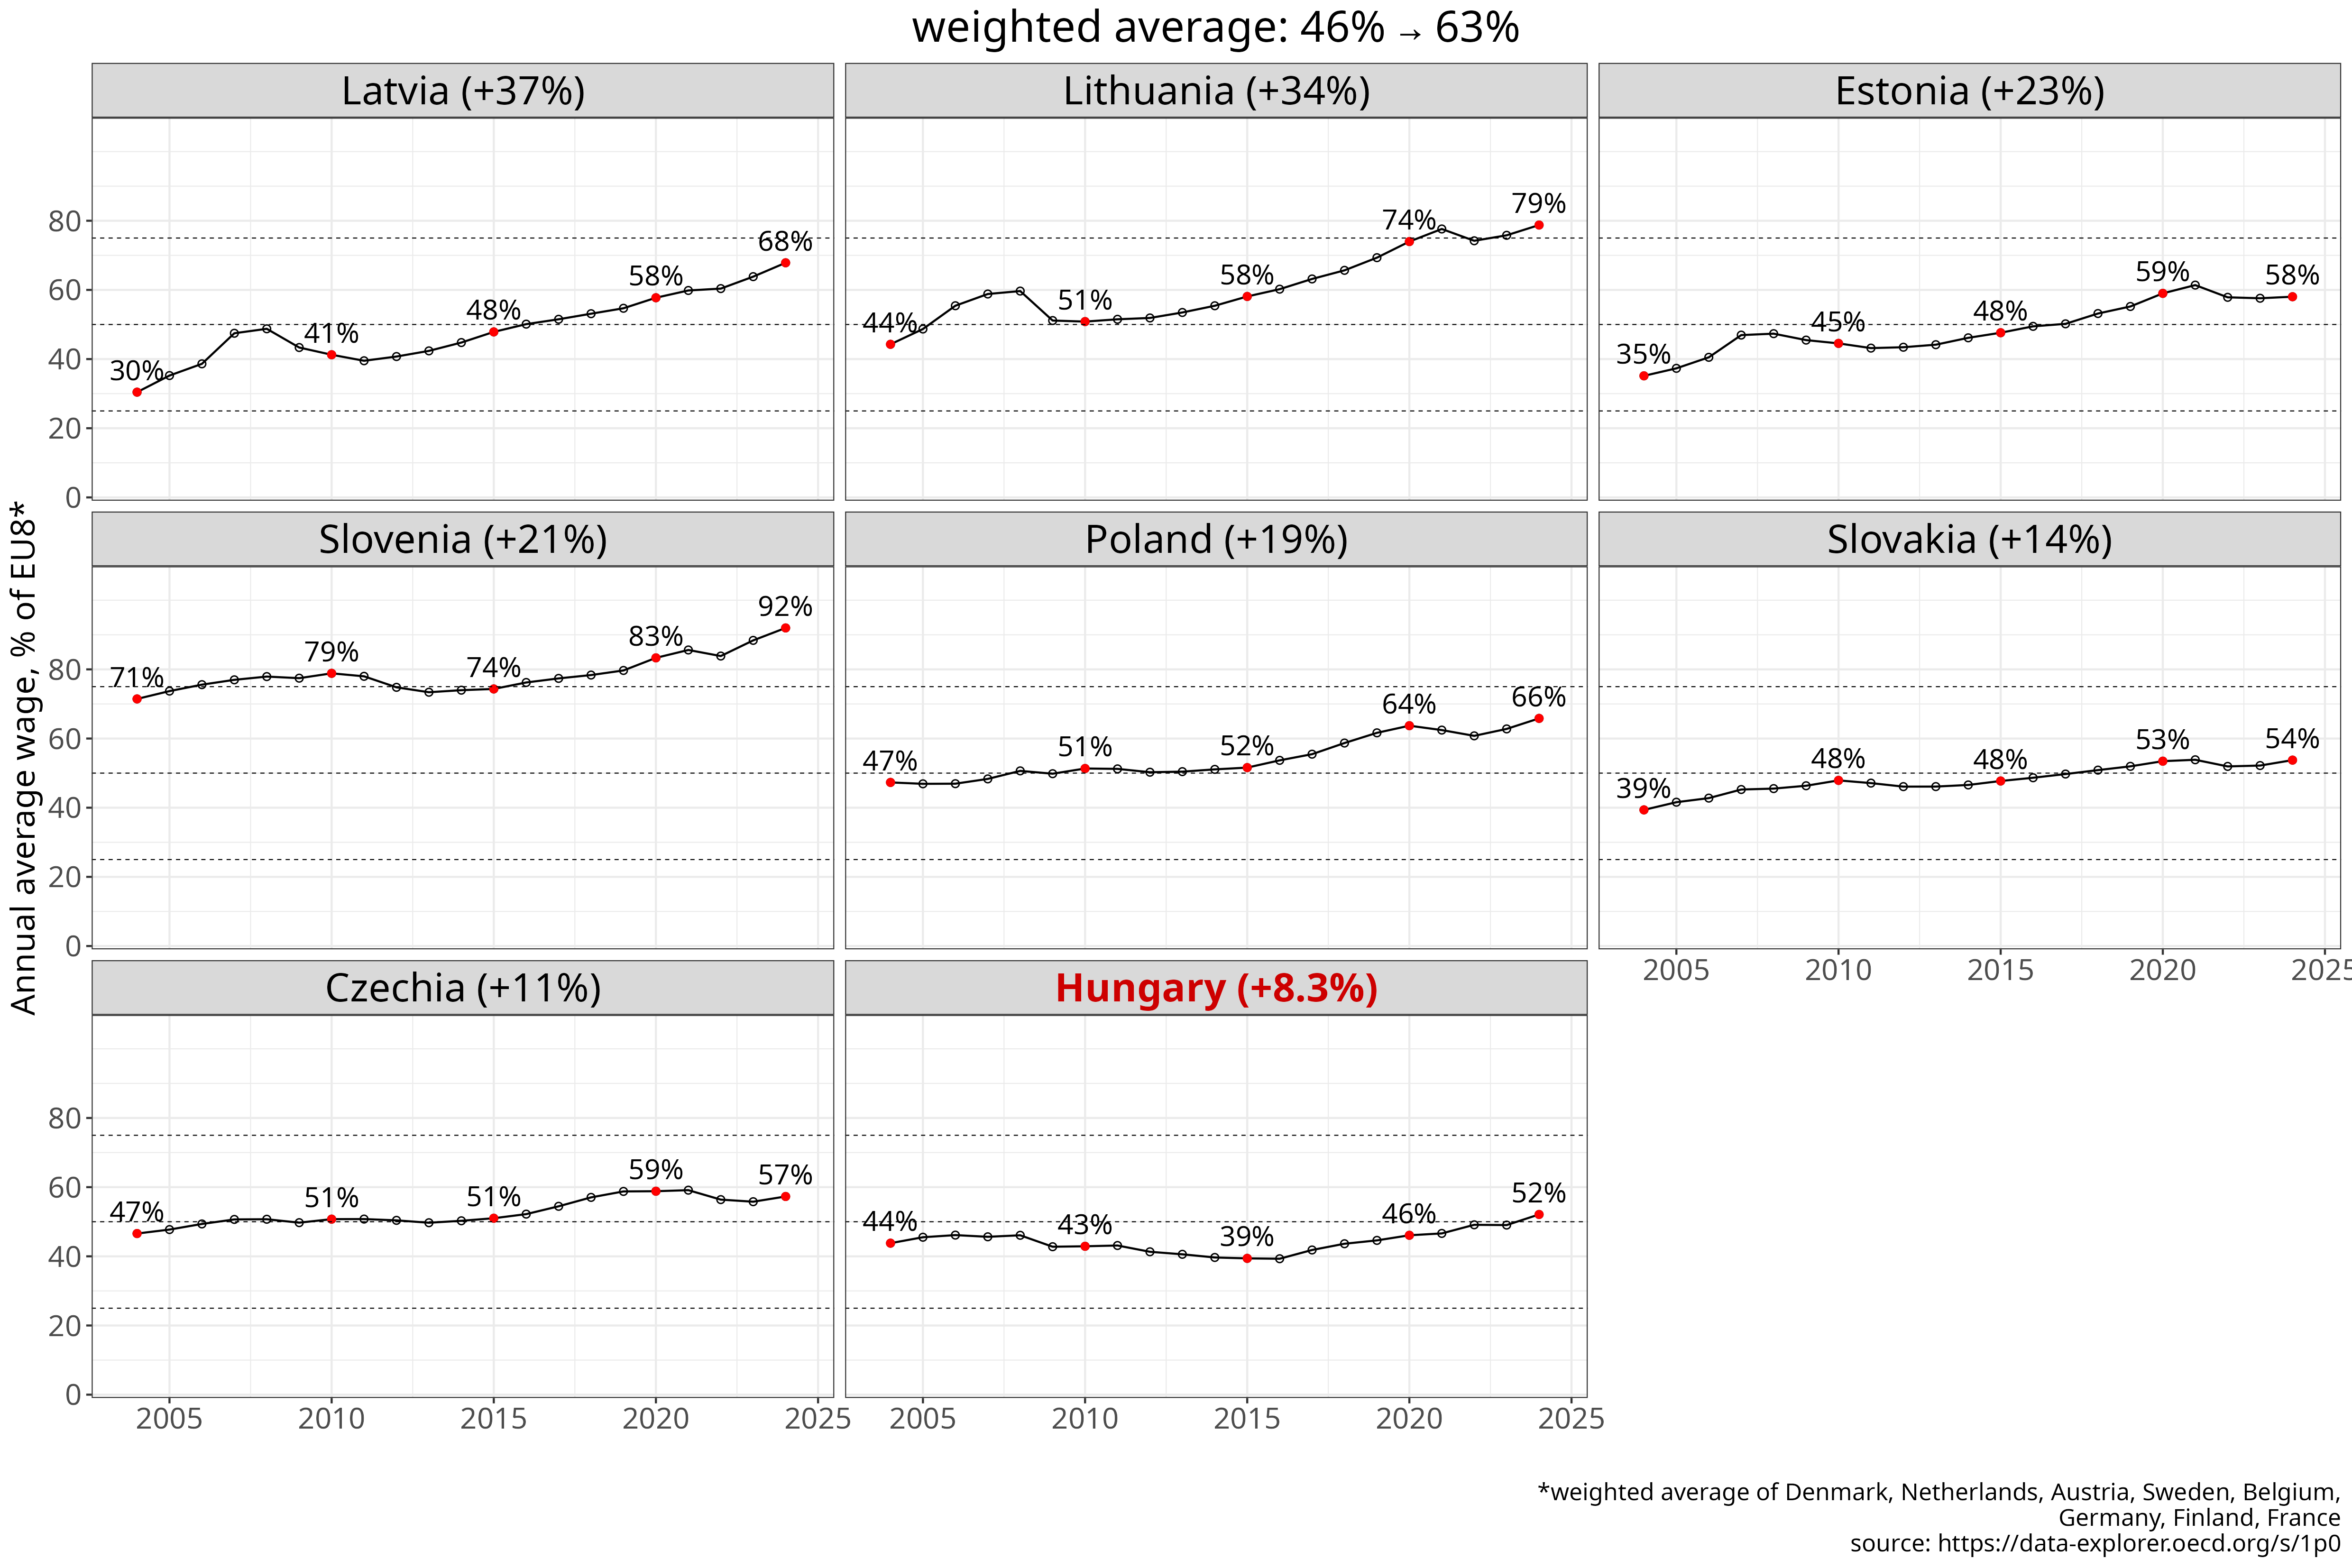
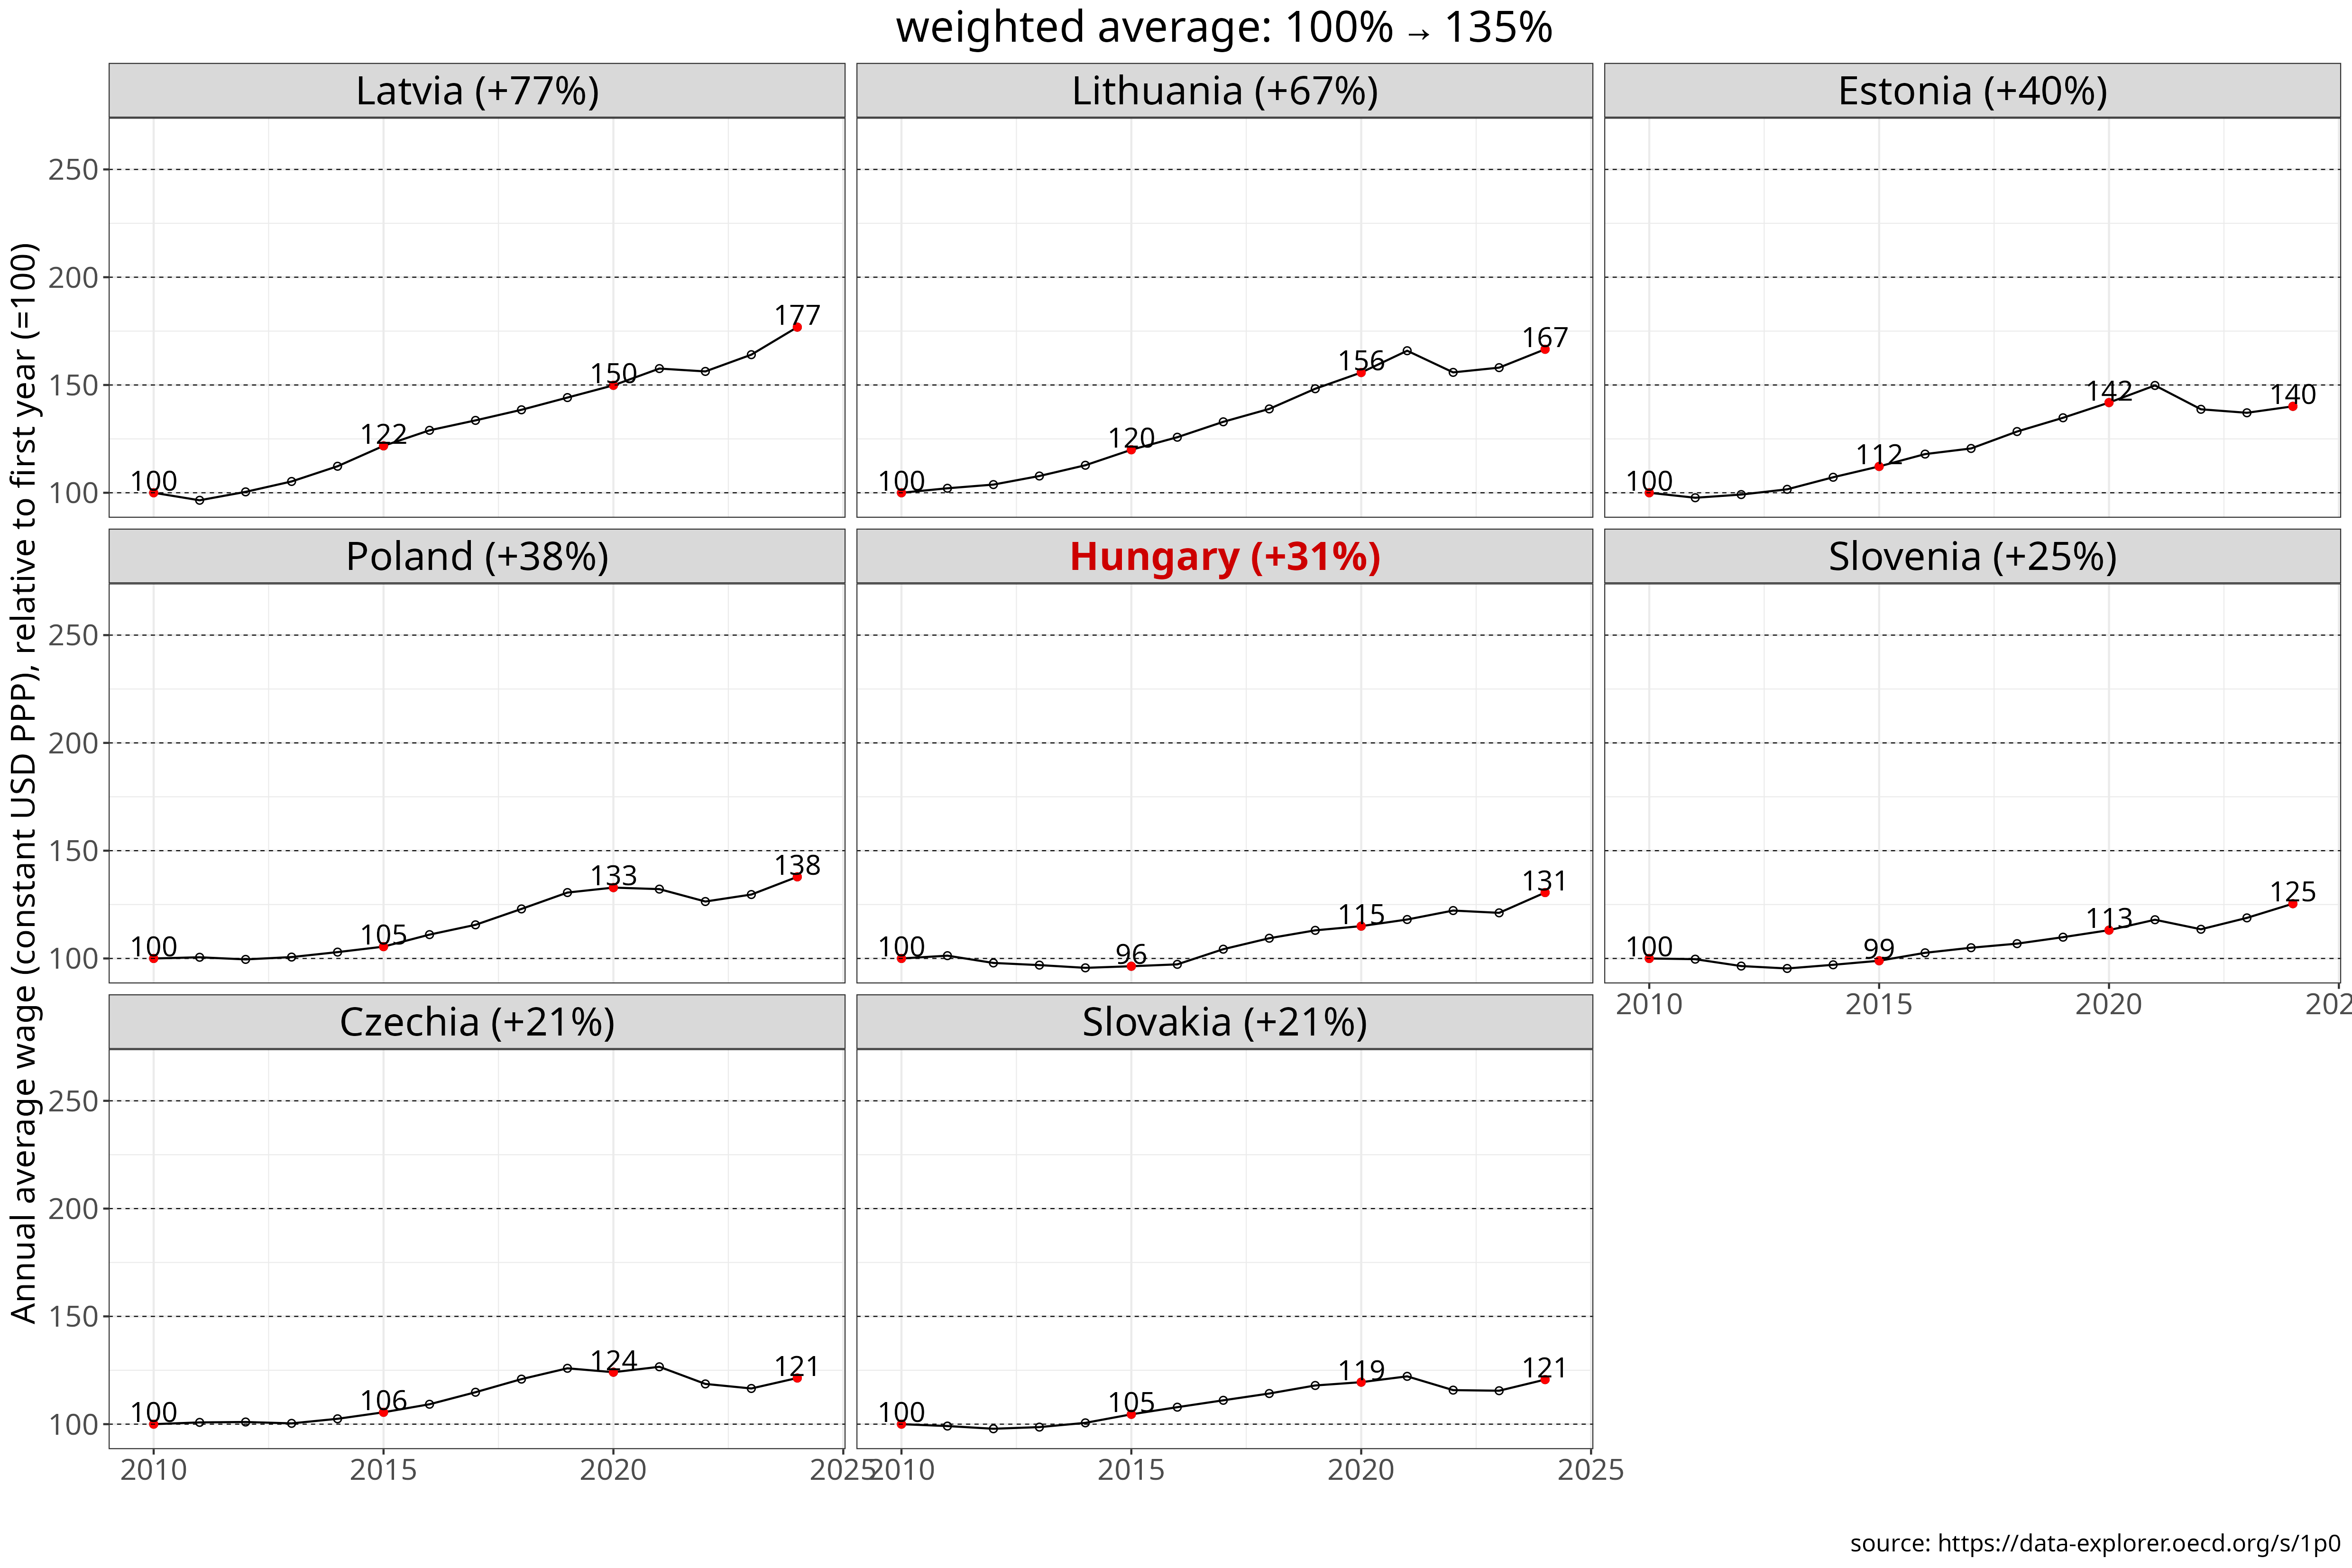
Figure 4 Average annual wages since 2004, measured in constant 2024 international dollars (PPP). The chart shows levels (const. USD PPP), indexed values relative to 2004 and 2010, and percentages of the EU8 weighted average. Countries are ranked by cumulative growth from the selected base year through 2024. [download data] [source]
Measured from the 2004 baseline, Hungary has experienced the slowest convergence in average wage levels. When calculated from the 2010 baseline, its convergence was second slowest, as again Slovakia’s convergence performance has been even weaker. Czechia also shows less convergence from 2010 onward, but this partly reflects its higher starting level, as it both began and ended the period at a higher wage level than Hungary.
Table 4: Cumulative change in average annual wages from 2004 or 2010 to 2024, shown as a percentage of the EU8 weighted average, relative to the initial year, and in absolute terms (constant 2024 international dollars (PPP)). Countries are ranked by the EU8-relative measure.
However, this dataset is about average wages, which can be skewed by high wages and not necessarily reflecting the median worker’s wage situation.
Median hourly earnings
Eurostat provides data on median hourly earnings in the private sector, reported both in nominal euros and in purchasing power standards (PPS), where nominal values are converted into EU-wide purchasing power units. We focus on median earnings expressed in PPS (see Methods). For CEE countries, this series begins in 2006, so the baseline years used here are 2006 and 2010. This dataset is collected every four years and currently its last entry is from 2022, therefore the effects of the inflationary spike on real wages in 2023 are not yet included.
Since 2006, average median hourly earnings in the region have increased from 34% to 61% of the EU8 level. The Baltic countries, Romania and Poland again rank at the top of the region in terms of cumulative convergence to the EU8 benchmark.
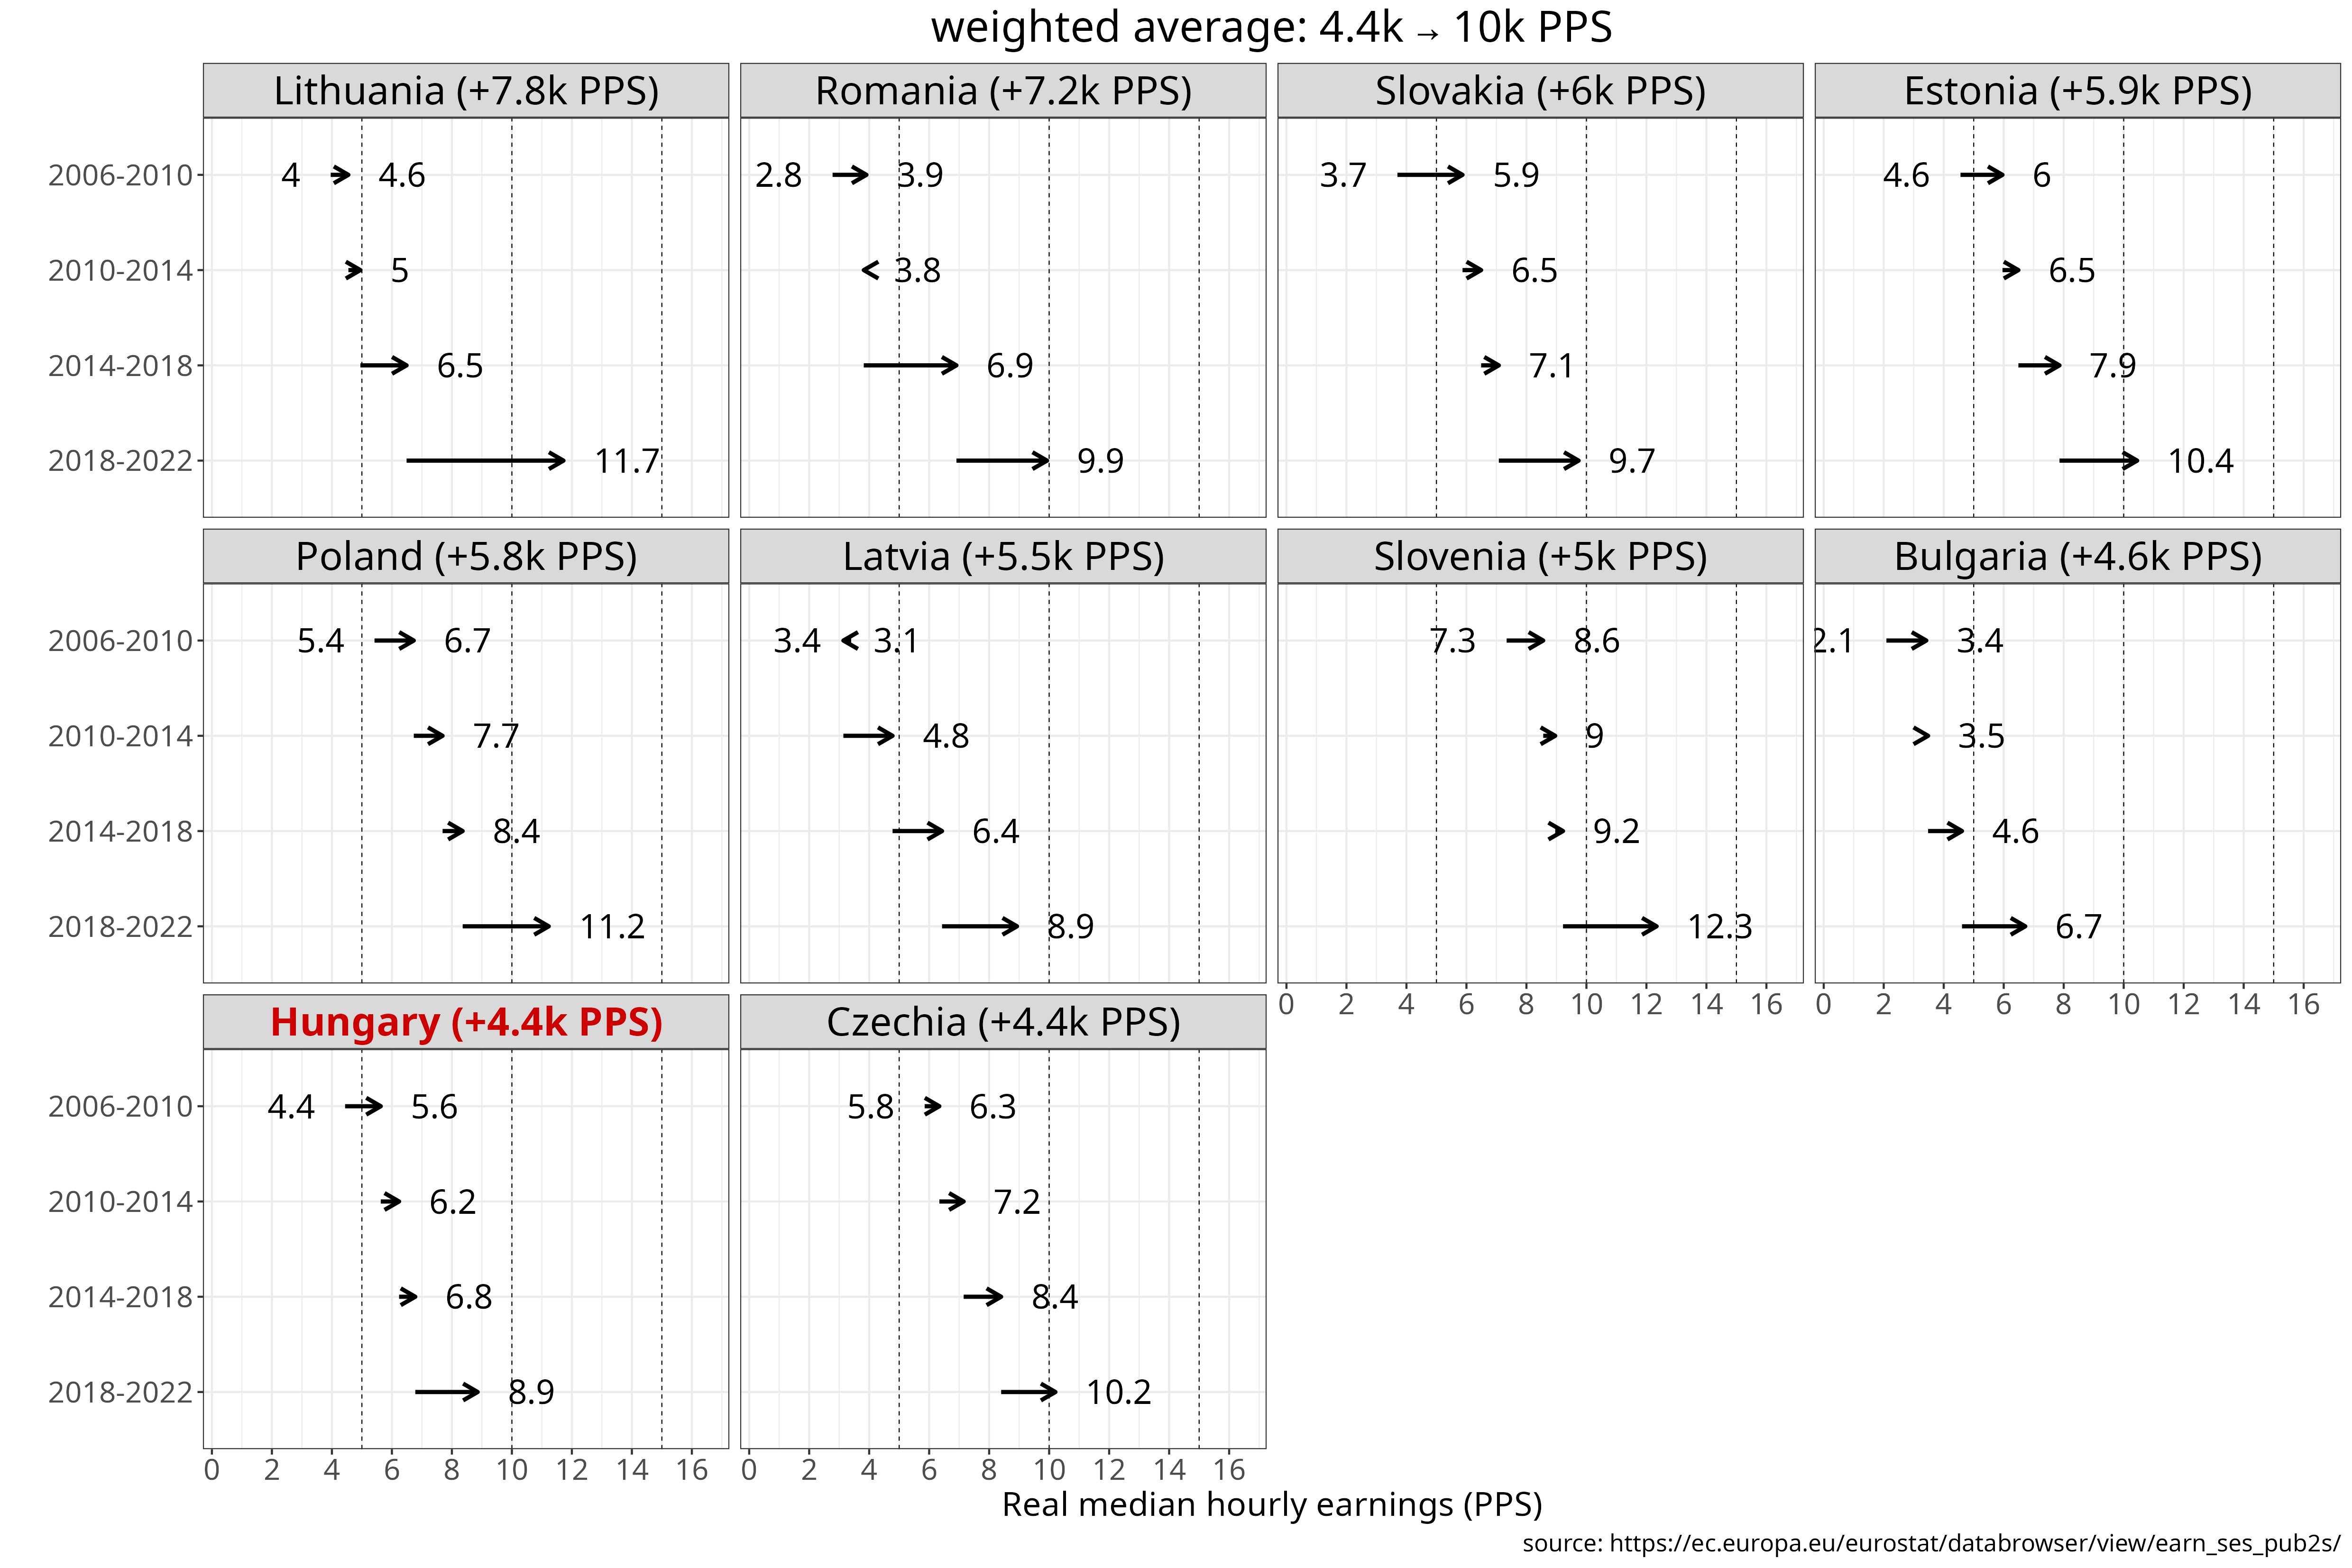
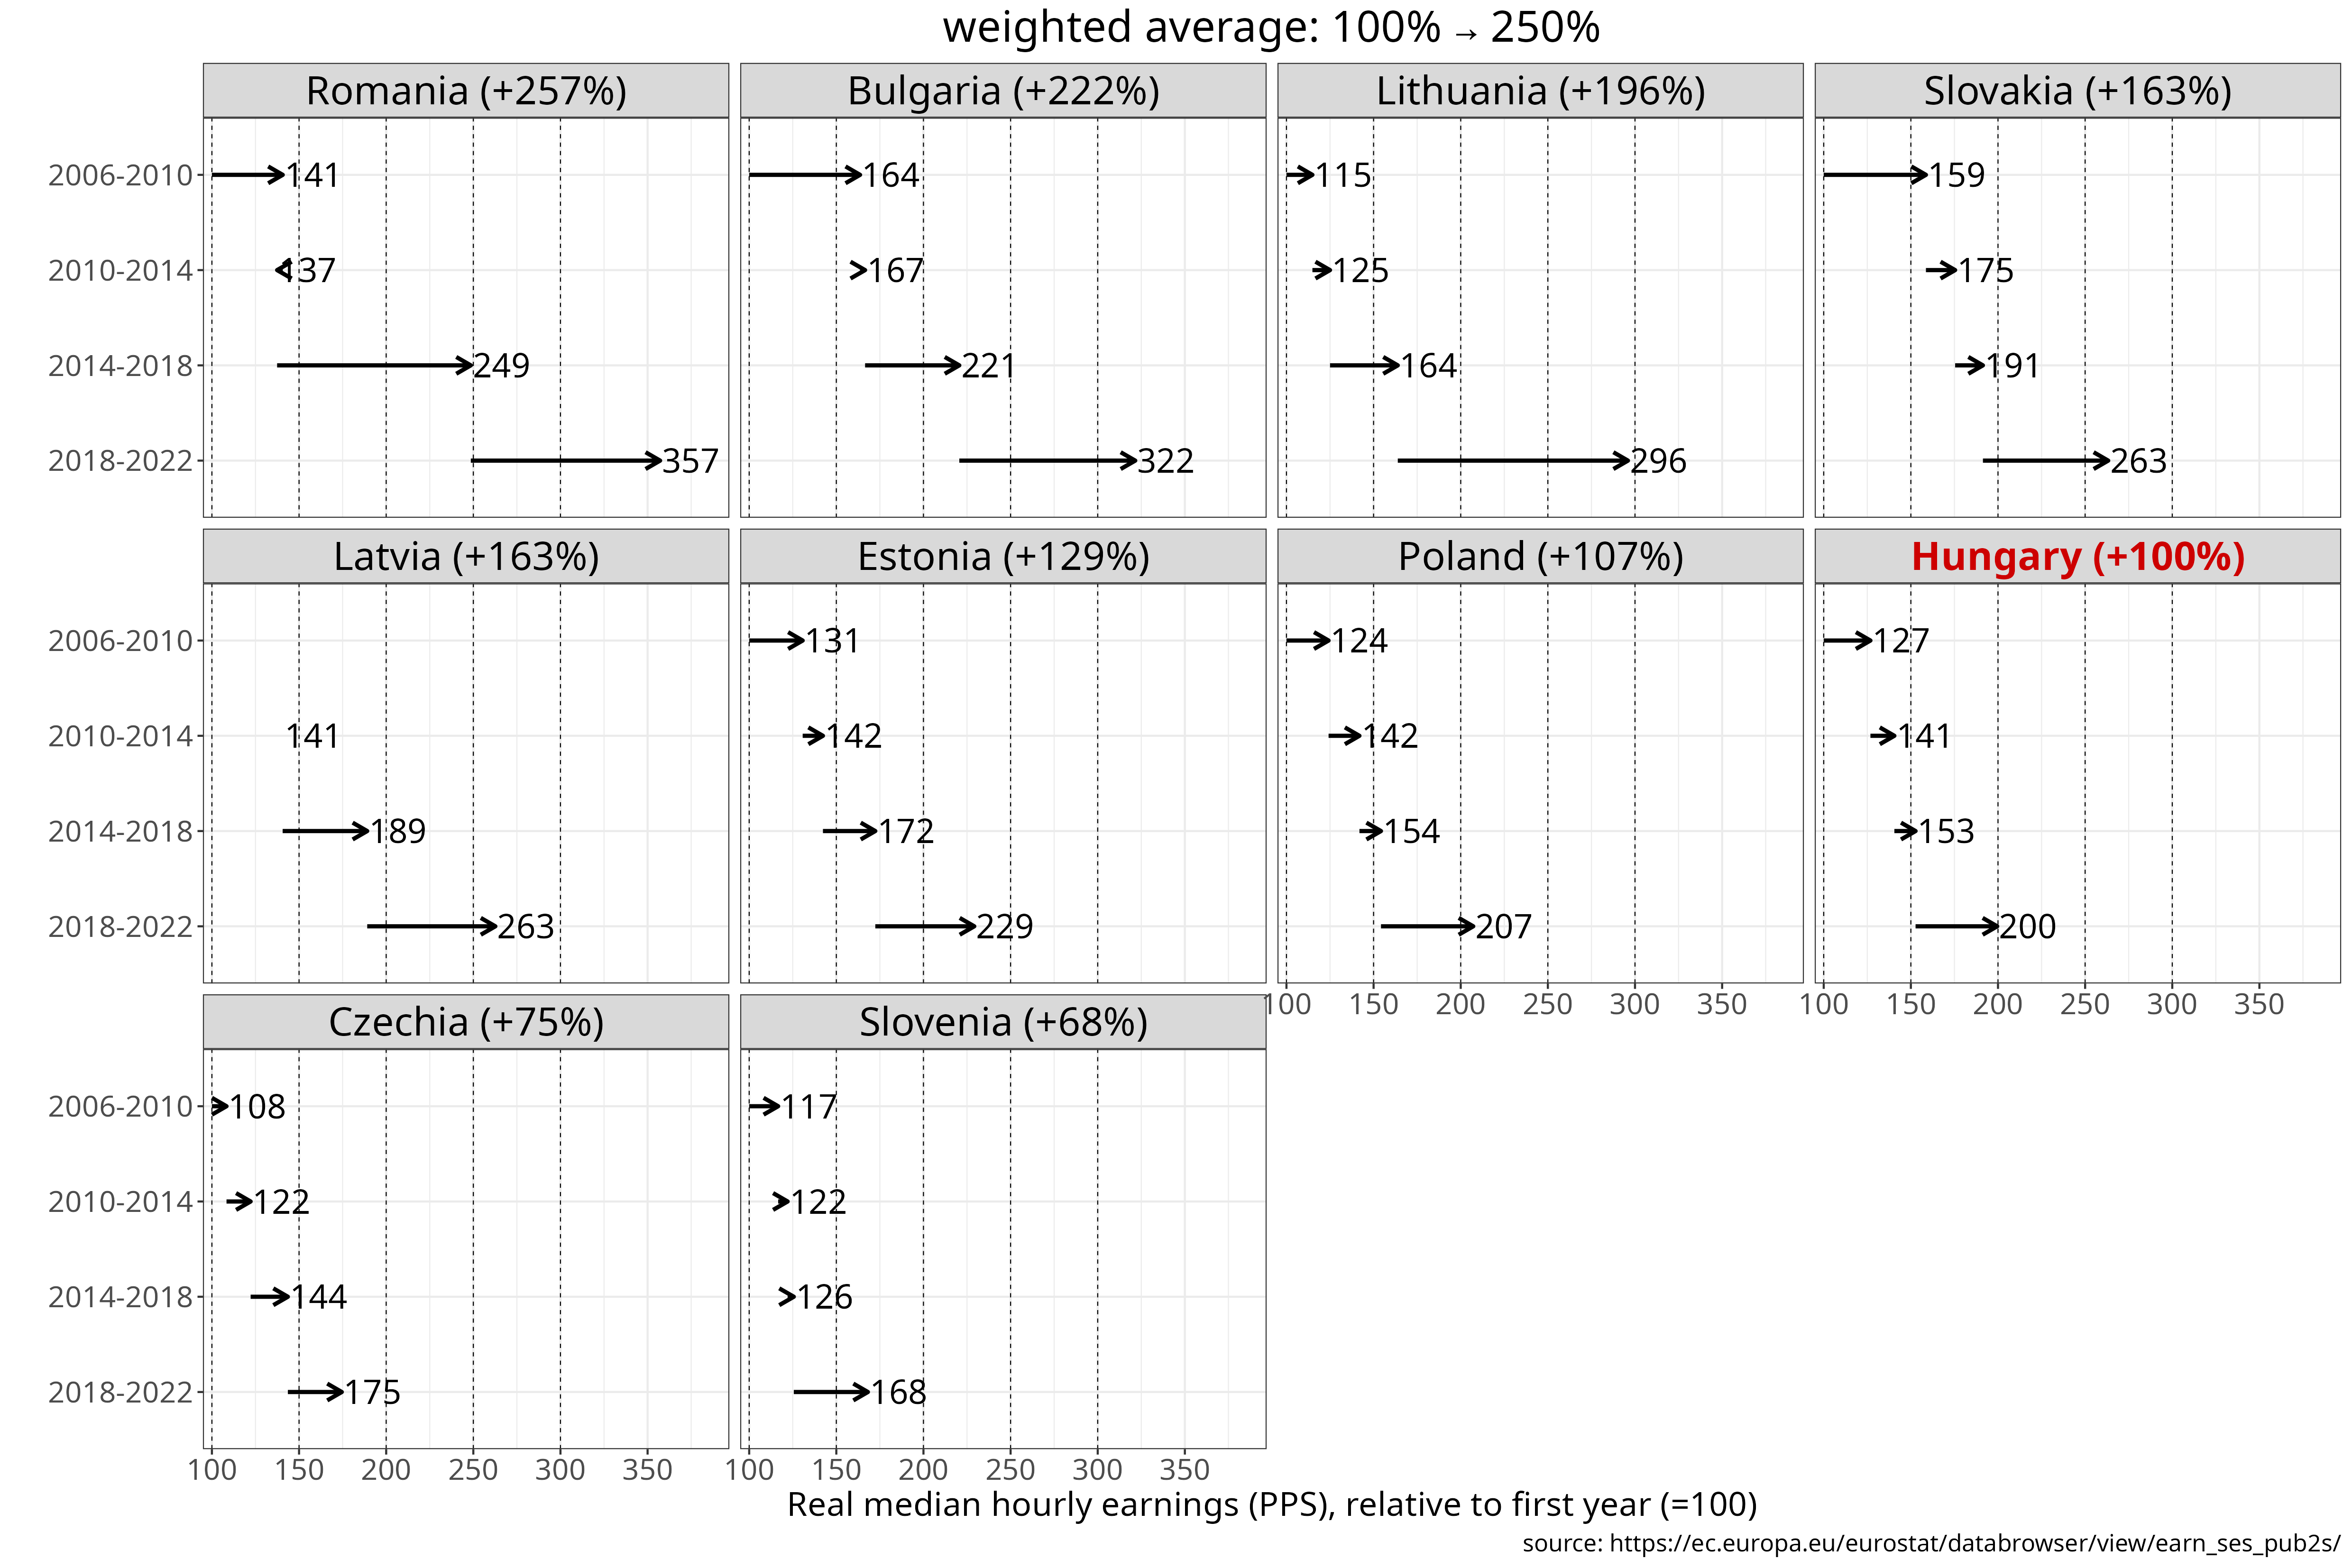
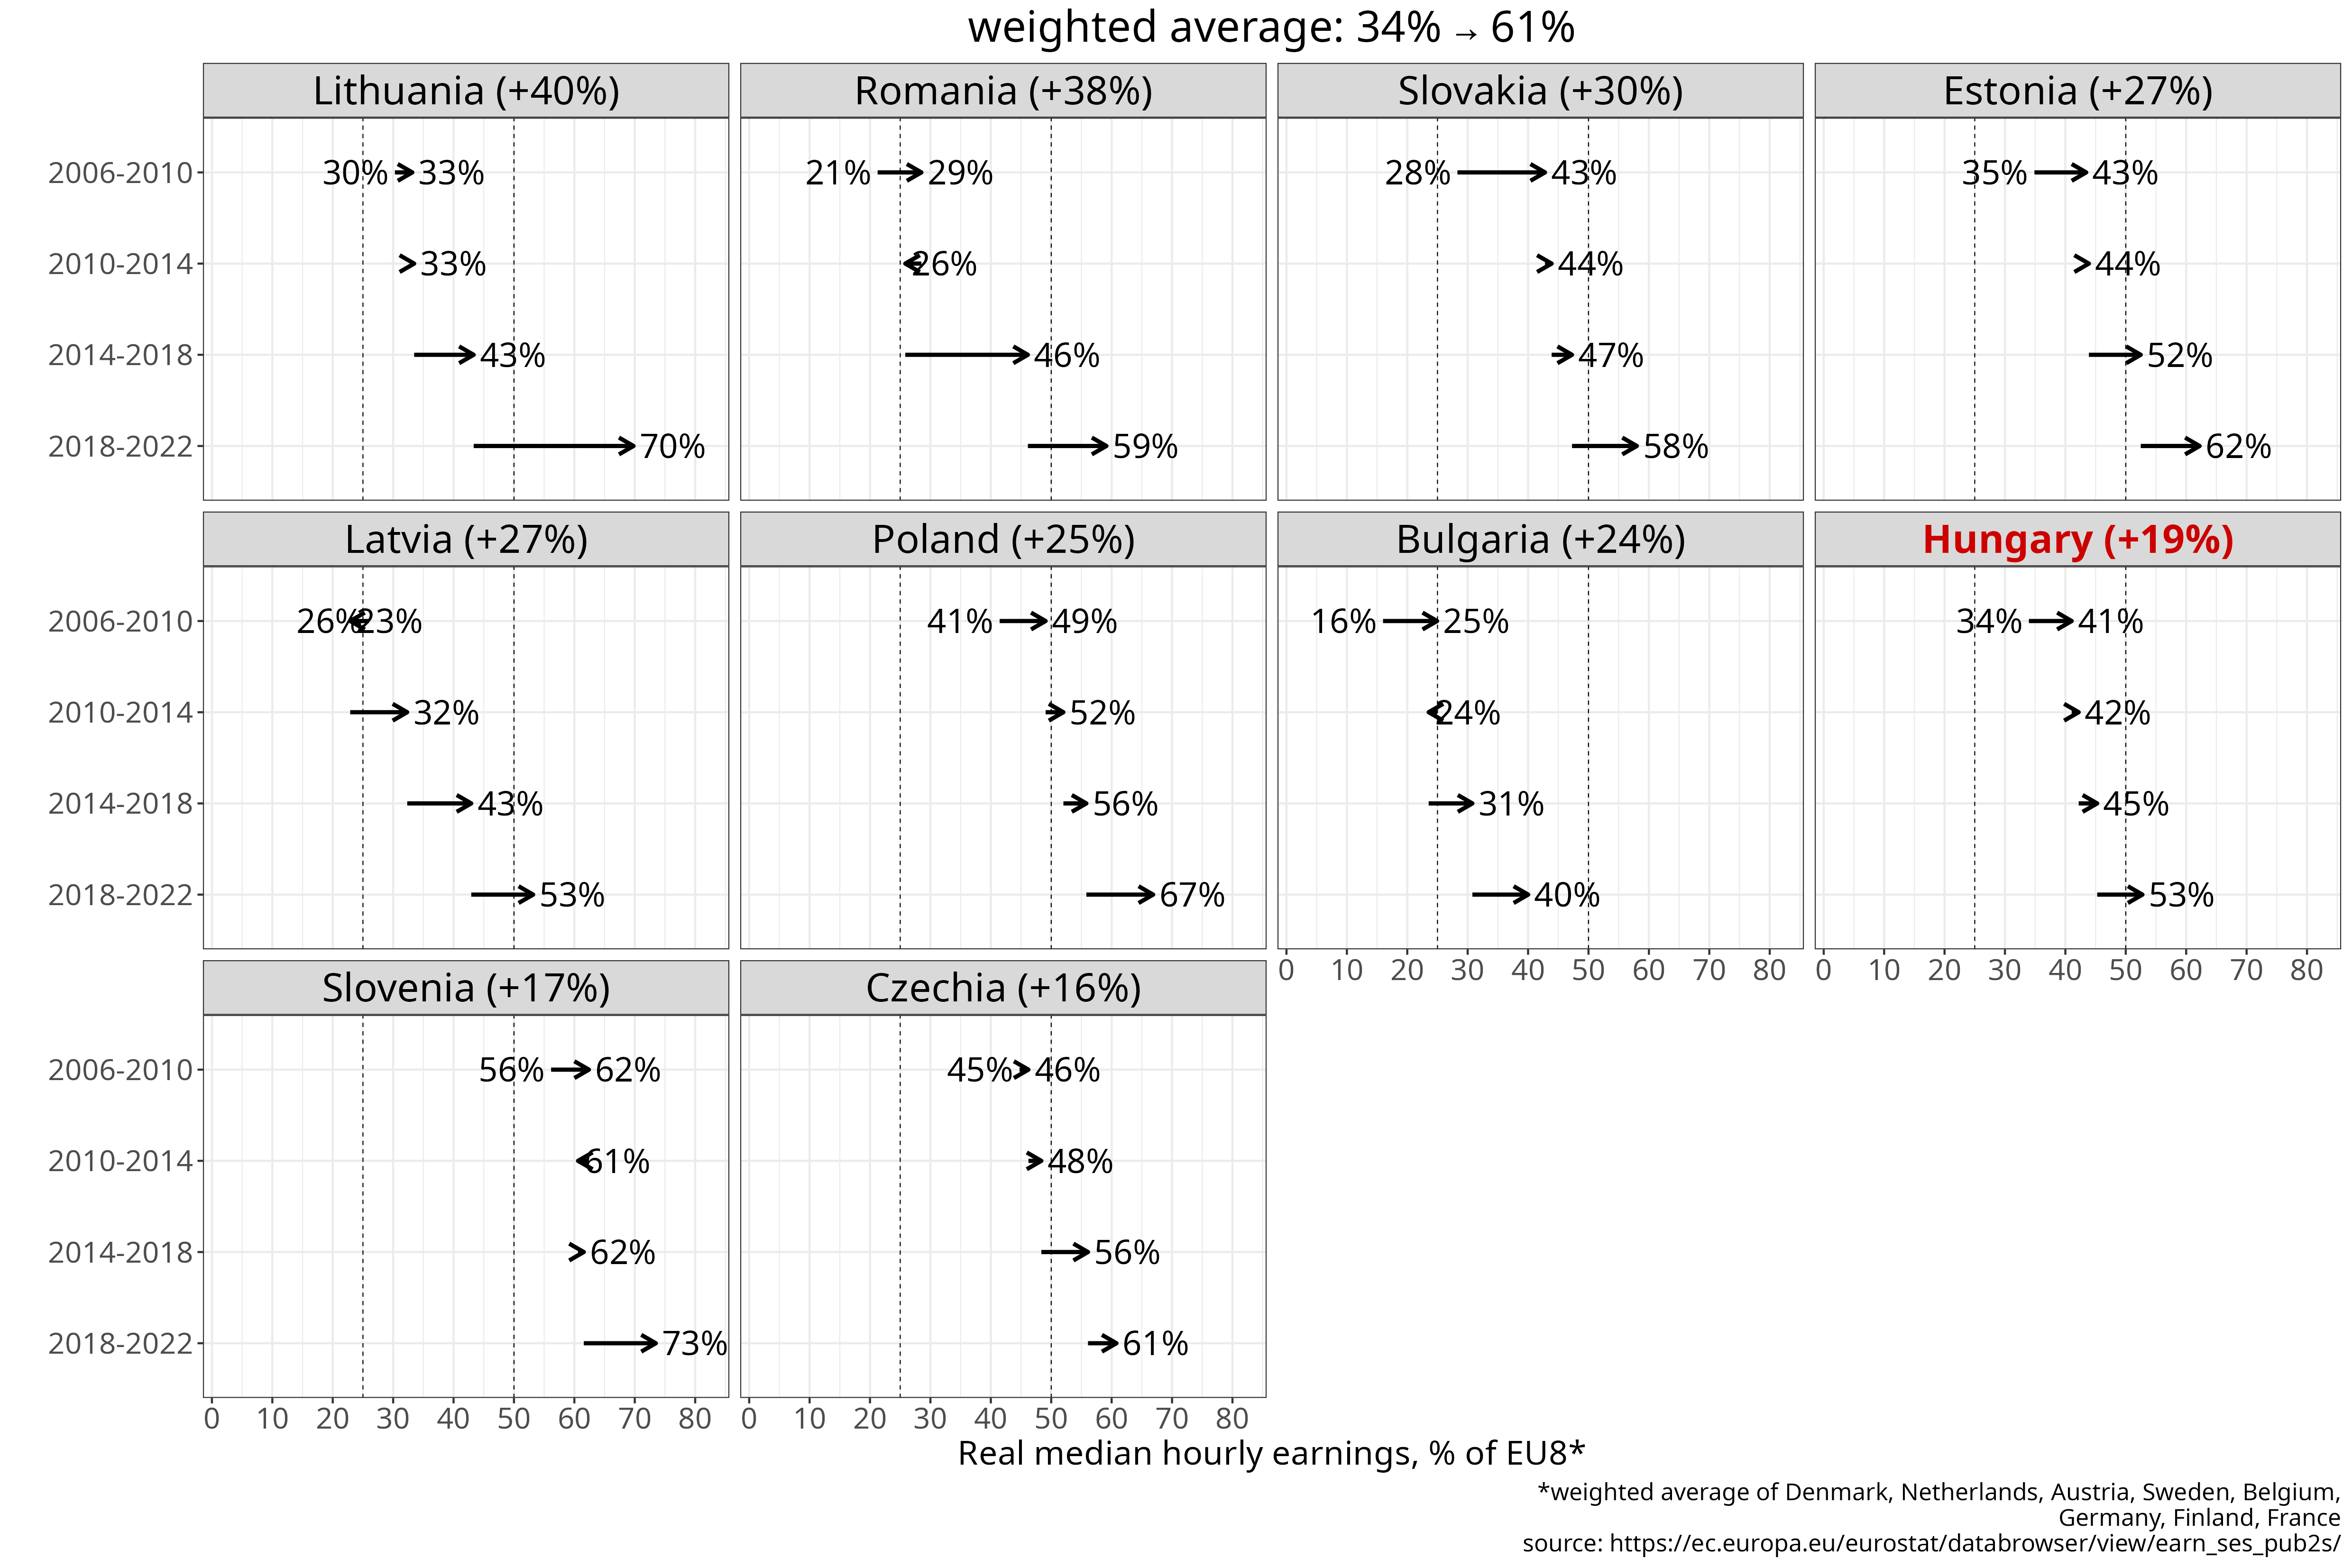
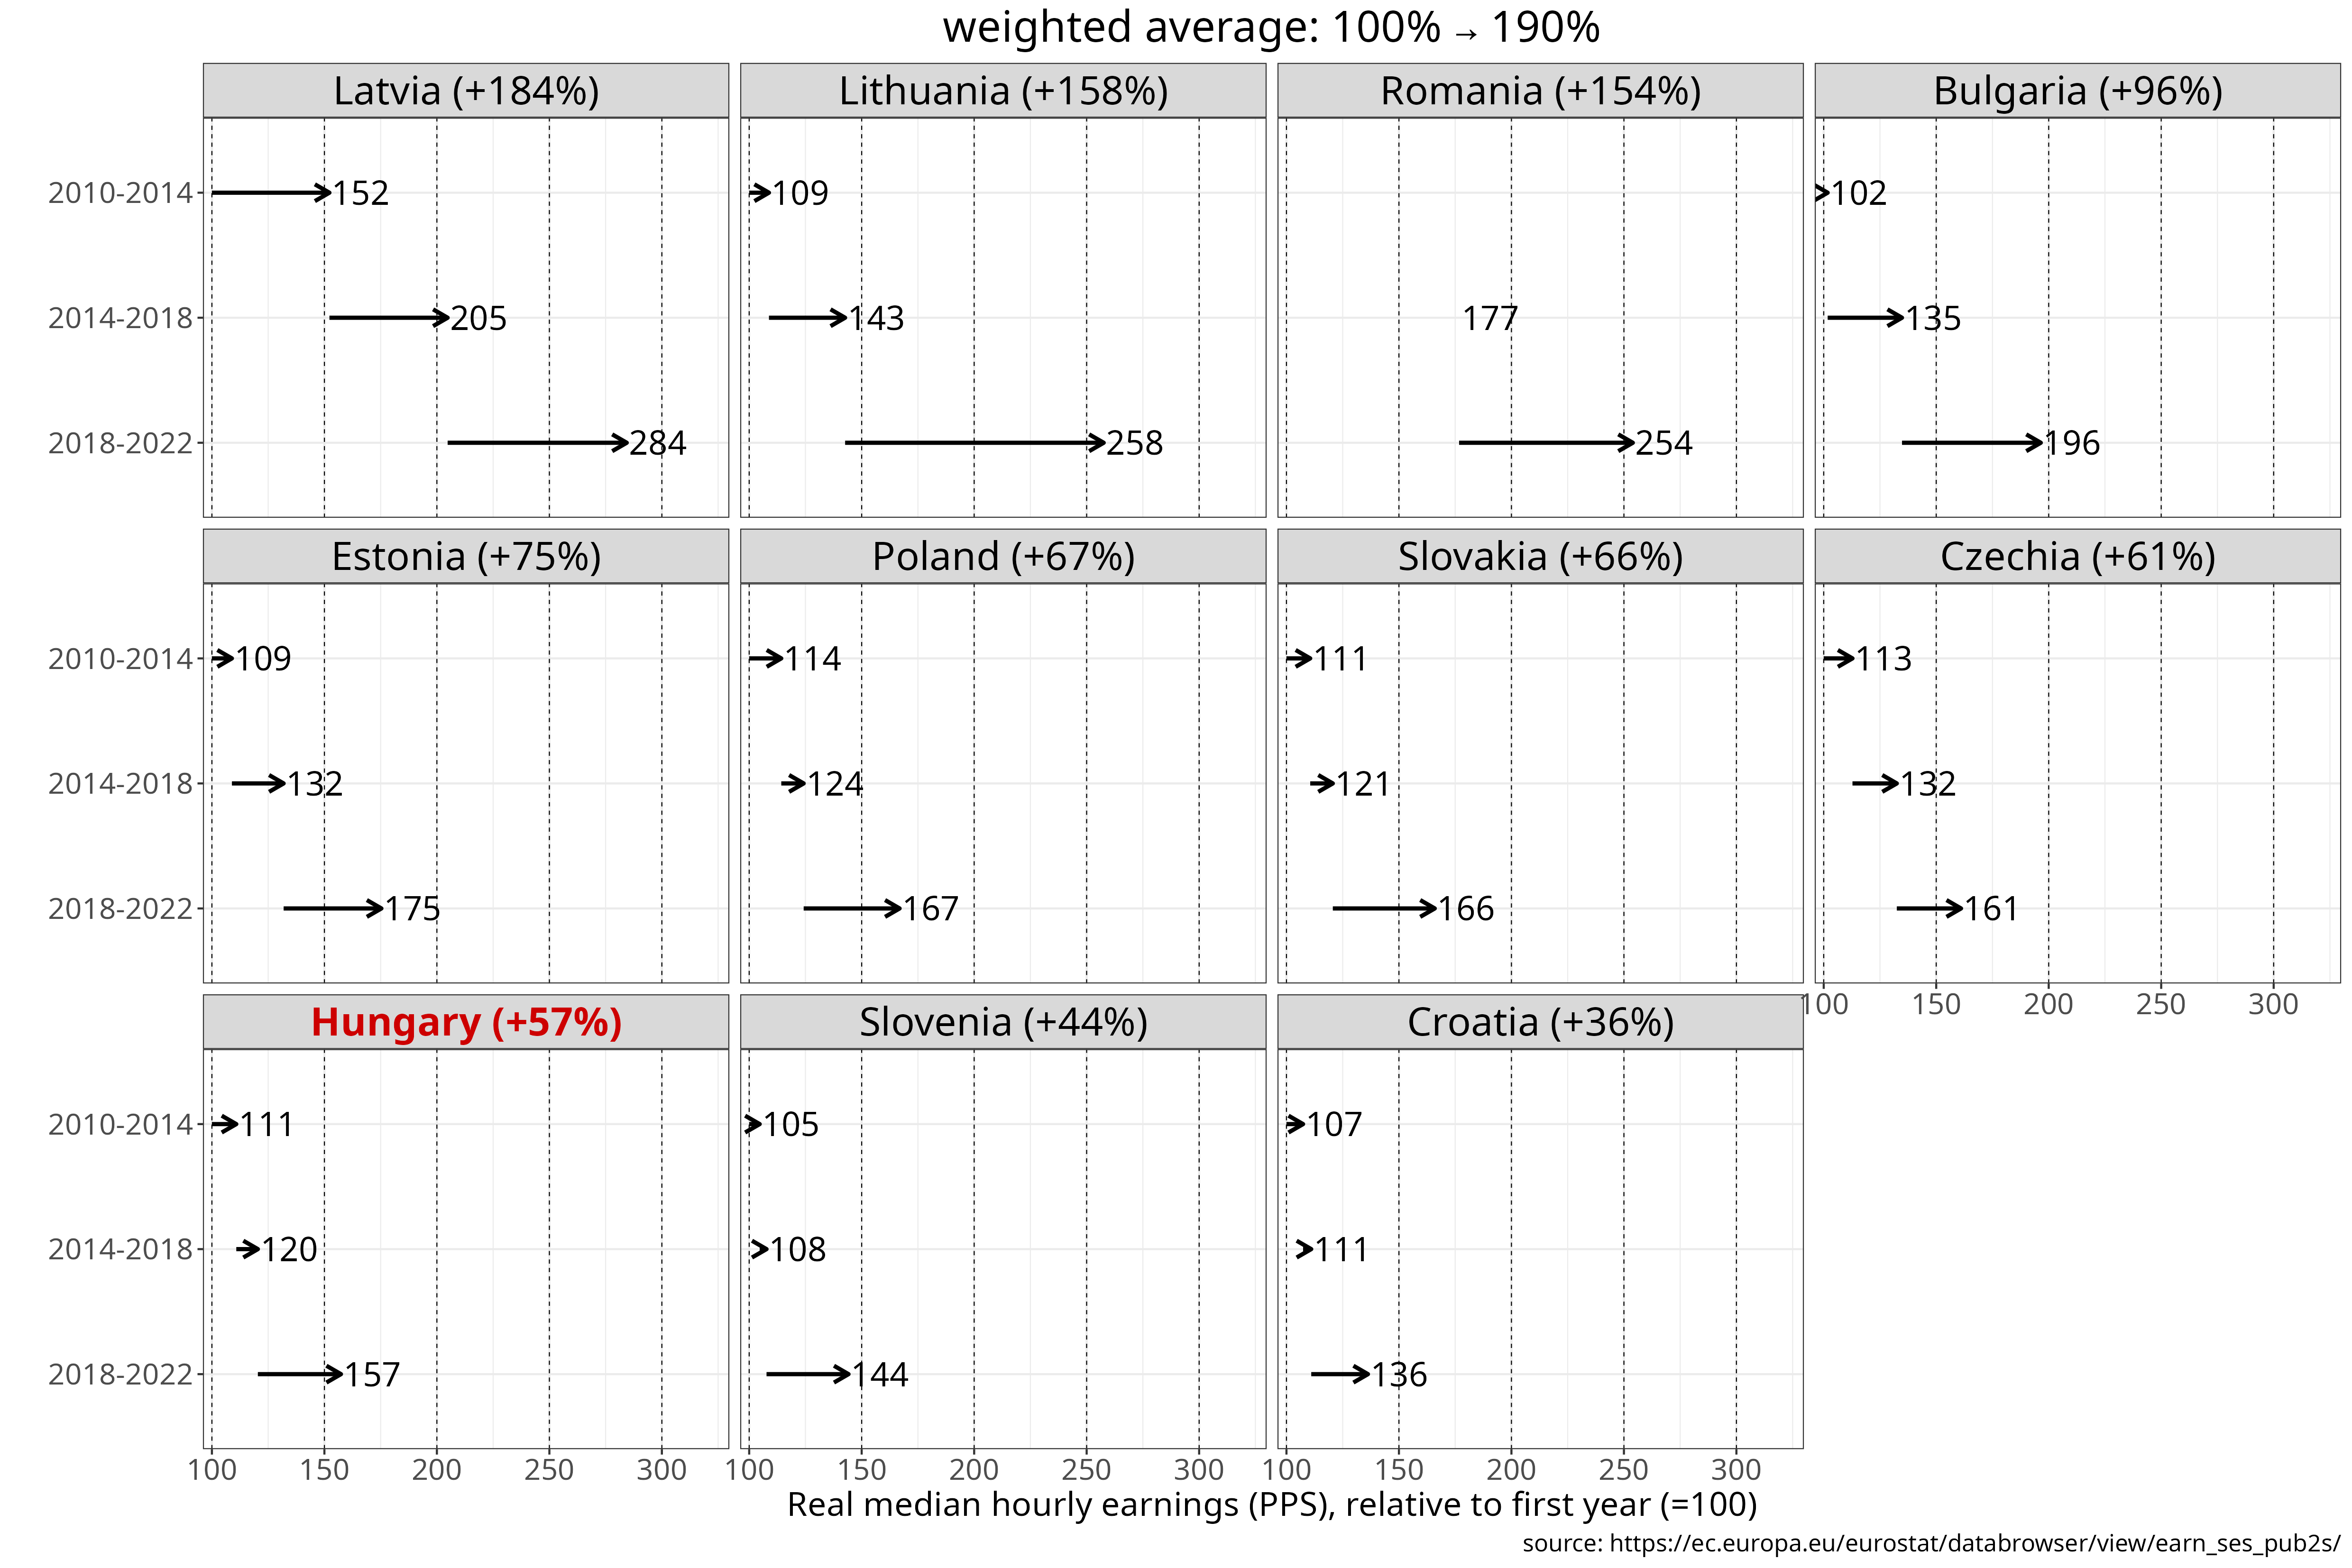
Figure 5 Median hourly earnings since 2006, measured in PPS (purchasing power standards; anchored to EU-wide price changes). The chart shows levels (PPS), indexed values relative to 2004 and 2010, and percentages of the EU8 weighted average. Countries are ranked by cumulative growth from the selected base year through 2022. [download data] [source]
Hungary once more appears towards the bottom of the regional ranking. Measured from the 2006 baseline and expressed as a percentage of the EU8 average, only Czechia and Slovenia recorded smaller convergence, but both started from, and remained at, a level 10–20% higher by the end of the period. When calculated from the 2010 baseline, Hungary still shows the third lowest convergence performance in the region; Croatia’s earnings convergence was even poorer.
| country | % of EU8 | relative to initial value (%) | absolute value (PPS) |
|---|---|---|---|
| Lithuania | +40% (30→70) | +196% | +7.8 (4→11.7) |
| Romania | +38% (21→59) | +257% | +7.2 (2.8→9.9) |
| Slovakia | +30% (28→58) | +163% | +6 (3.7→9.7) |
| Estonia | +27% (35→62) | +129% | +5.9 (4.6→10.4) |
| Latvia | +27% (26→53) | +163% | +5.5 (3.4→8.9) |
| Poland | +25% (41→67) | +107% | +5.8 (5.4→11.2) |
| Bulgaria | +24% (16→40) | +222% | +4.6 (2.1→6.7) |
| Hungary | +19% (34→53) | +100% | +4.4 (4.4→8.9) |
| Slovenia | +17% (56→73) | +68% | +5 (7.3→12.3) |
| Czechia | +16% (45→61) | +75% | +4.4 (5.8→10.2) |
| country | % of EU8 | relative to initial value (%) | absolute value (PPS) |
|---|---|---|---|
| Lithuania | +37% (33→70) | +158% | +7.2 (4.6→11.7) |
| Romania | +31% (29→59) | +154% | +6 (3.9→9.9) |
| Latvia | +30% (23→53) | +184% | +5.8 (3.1→8.9) |
| Estonia | +19% (43→62) | +75% | +4.5 (6→10.4) |
| Poland | +18% (49→67) | +67% | +4.5 (6.7→11.2) |
| Bulgaria | +15% (25→40) | +96% | +3.3 (3.4→6.7) |
| Czechia | +15% (46→61) | +61% | +3.9 (6.3→10.2) |
| Slovakia | +15% (43→58) | +66% | +3.9 (5.9→9.7) |
| Hungary | +12% (41→53) | +57% | +3.2 (5.6→8.9) |
| Slovenia | +11% (62→73) | +44% | +3.8 (8.6→12.3) |
| Croatia | +5.7% (50→56) | +36% | +2.5 (6.9→9.4) |
Table 5: Cumulative change in median hourly earnings from 2006 or 2010 to 2022, shown as a percentage of the EU8 weighted average, relative to the initial year, and in absolute terms (purchasing power standards, PPS). Countries are ranked by the EU8-relative measure.
Minimum wage
Minimum wages set an important floor under pay levels, especially for low-wage workers. The OECD provides an international minimum wage database in constant 2021 USD (PPP), which allows for cross-country comparisons in real (inflation-adjusted) terms. Several EU8 countries do not have a statutory national minimum wage, relying instead on sectoral bargaining. As a result, the Western European benchmark used here is the population-weighted average of three countries (EU3: Belgium, France and the Netherlands).
Expressed as a share of the EU3 benchmark, the average minimum wage across the CEE region more than doubled, rising from 28% to 63%. Romania, Poland, Bulgaria and the Baltic countries again lead the region in terms of convergence. In Romania, the minimum wage quadrupled relative to the EU3 level, while it nearly tripled in Bulgaria and more than doubled in Poland and Lithuania.
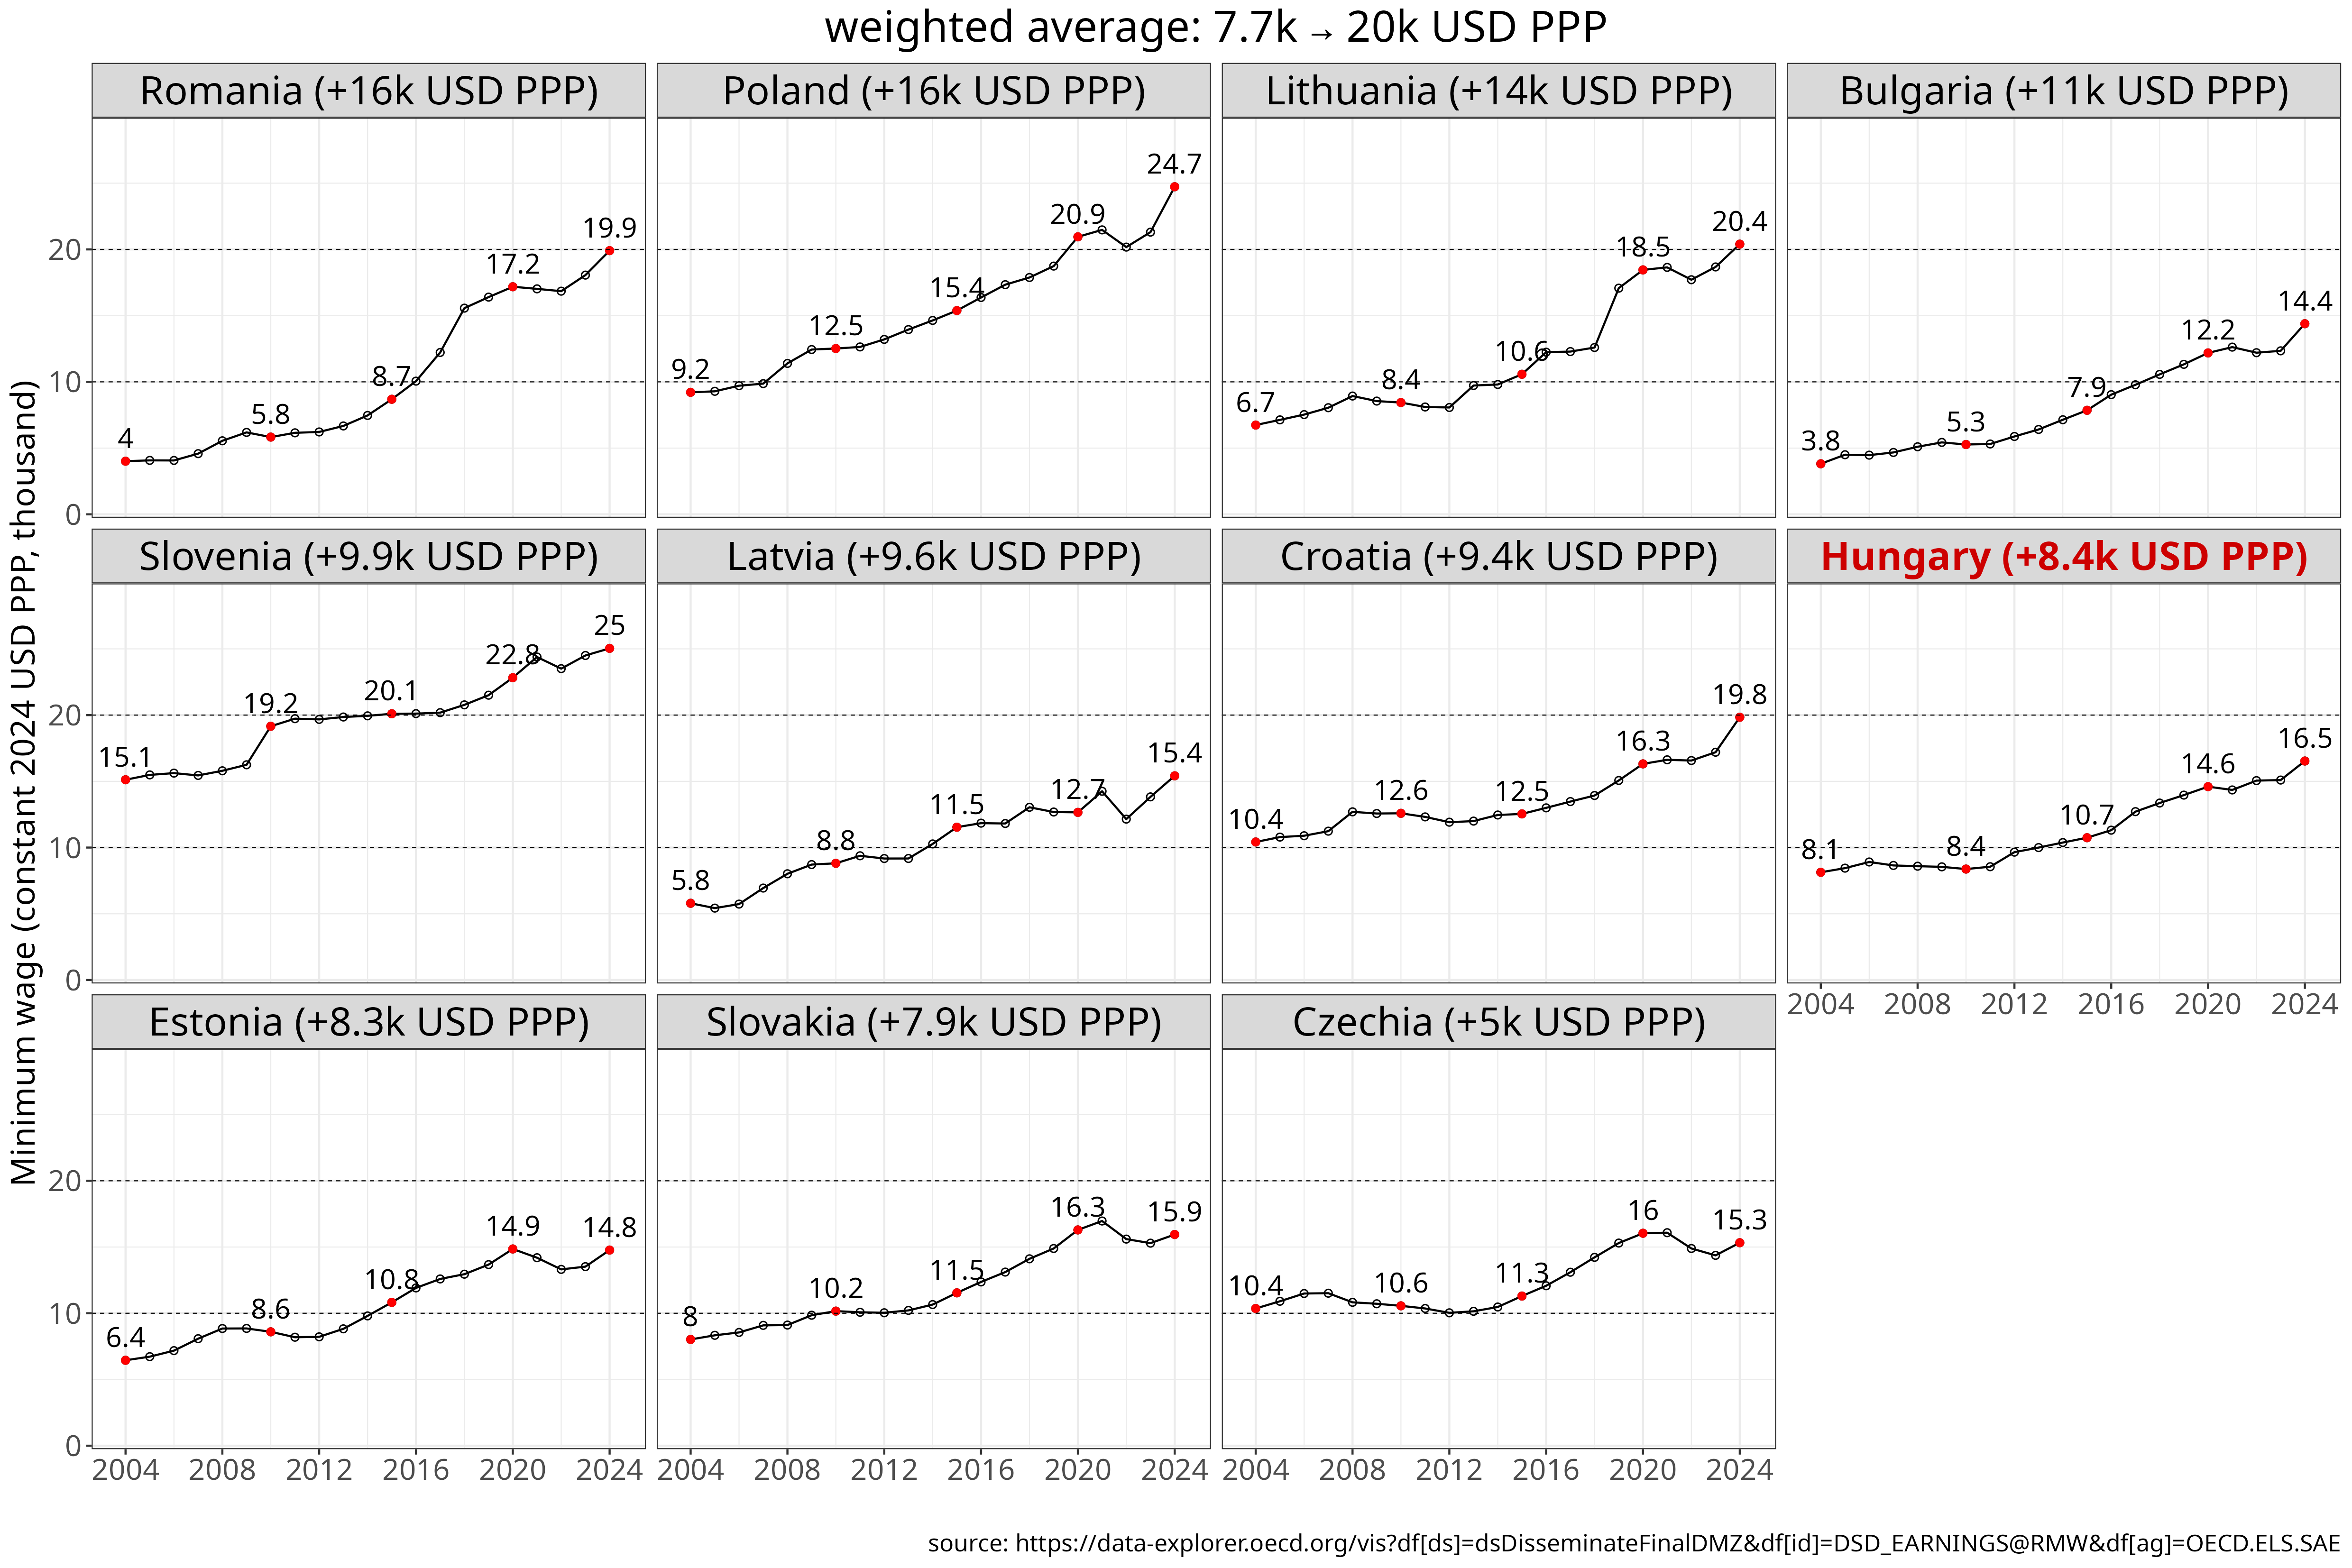
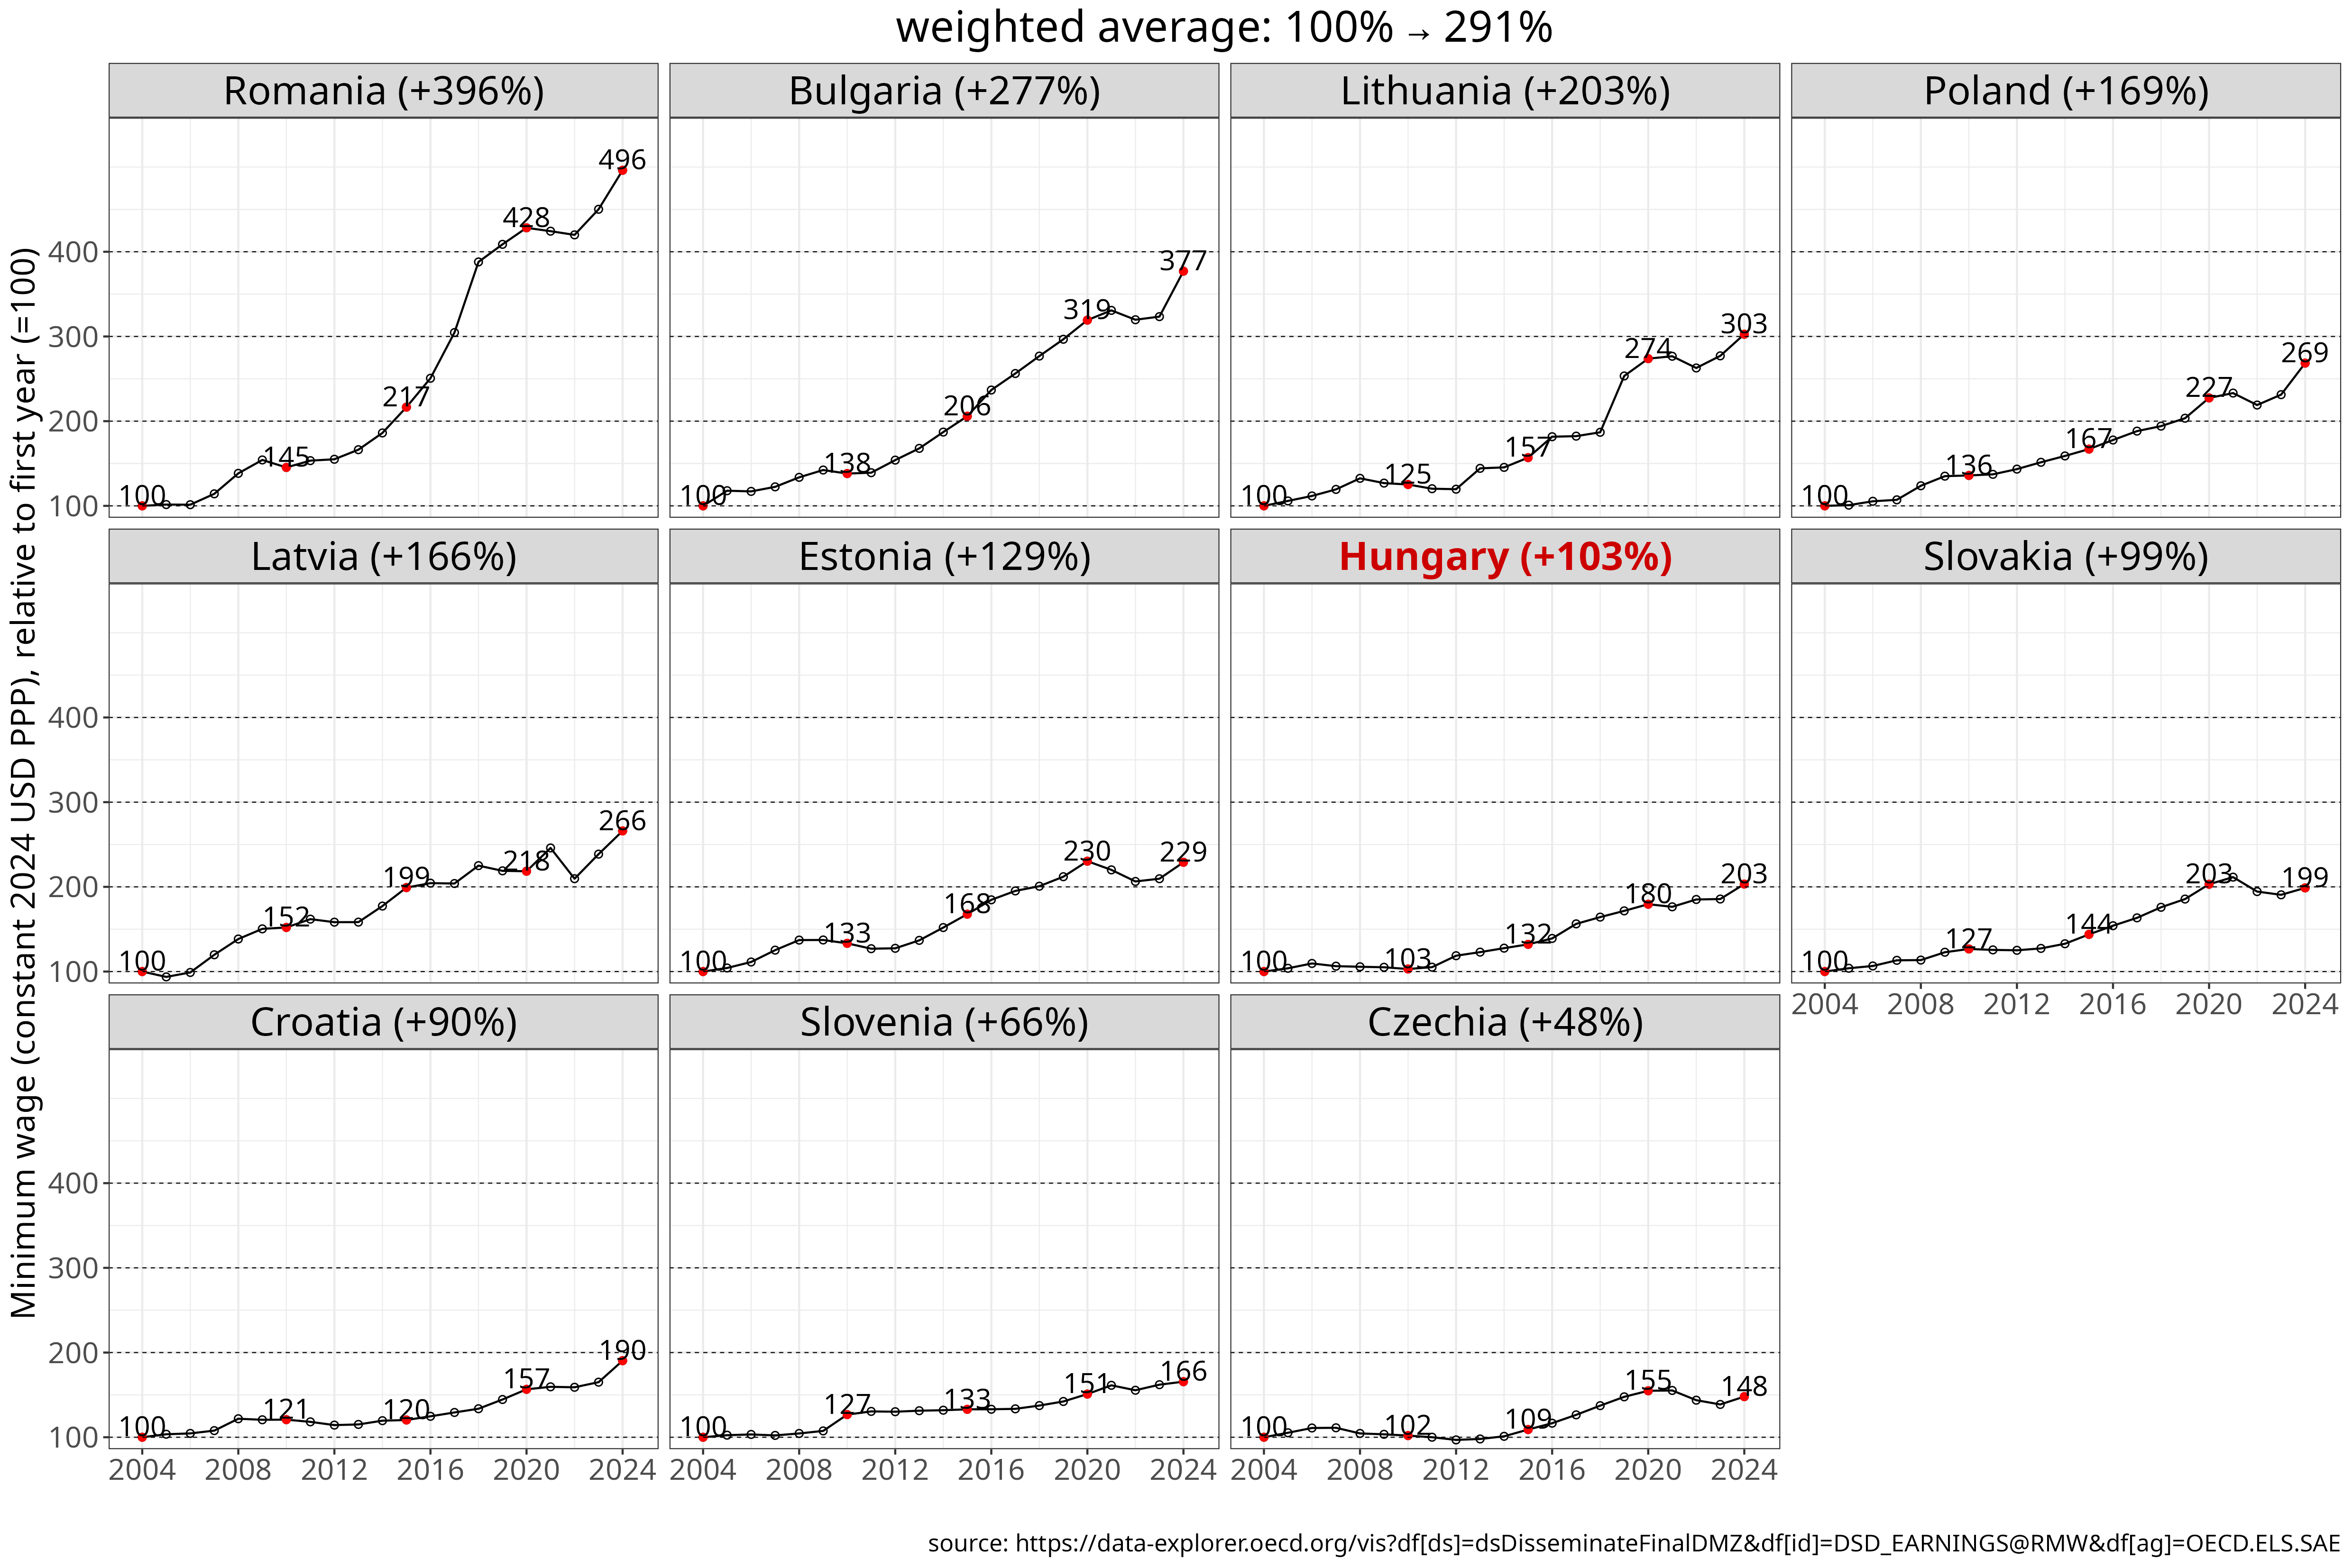
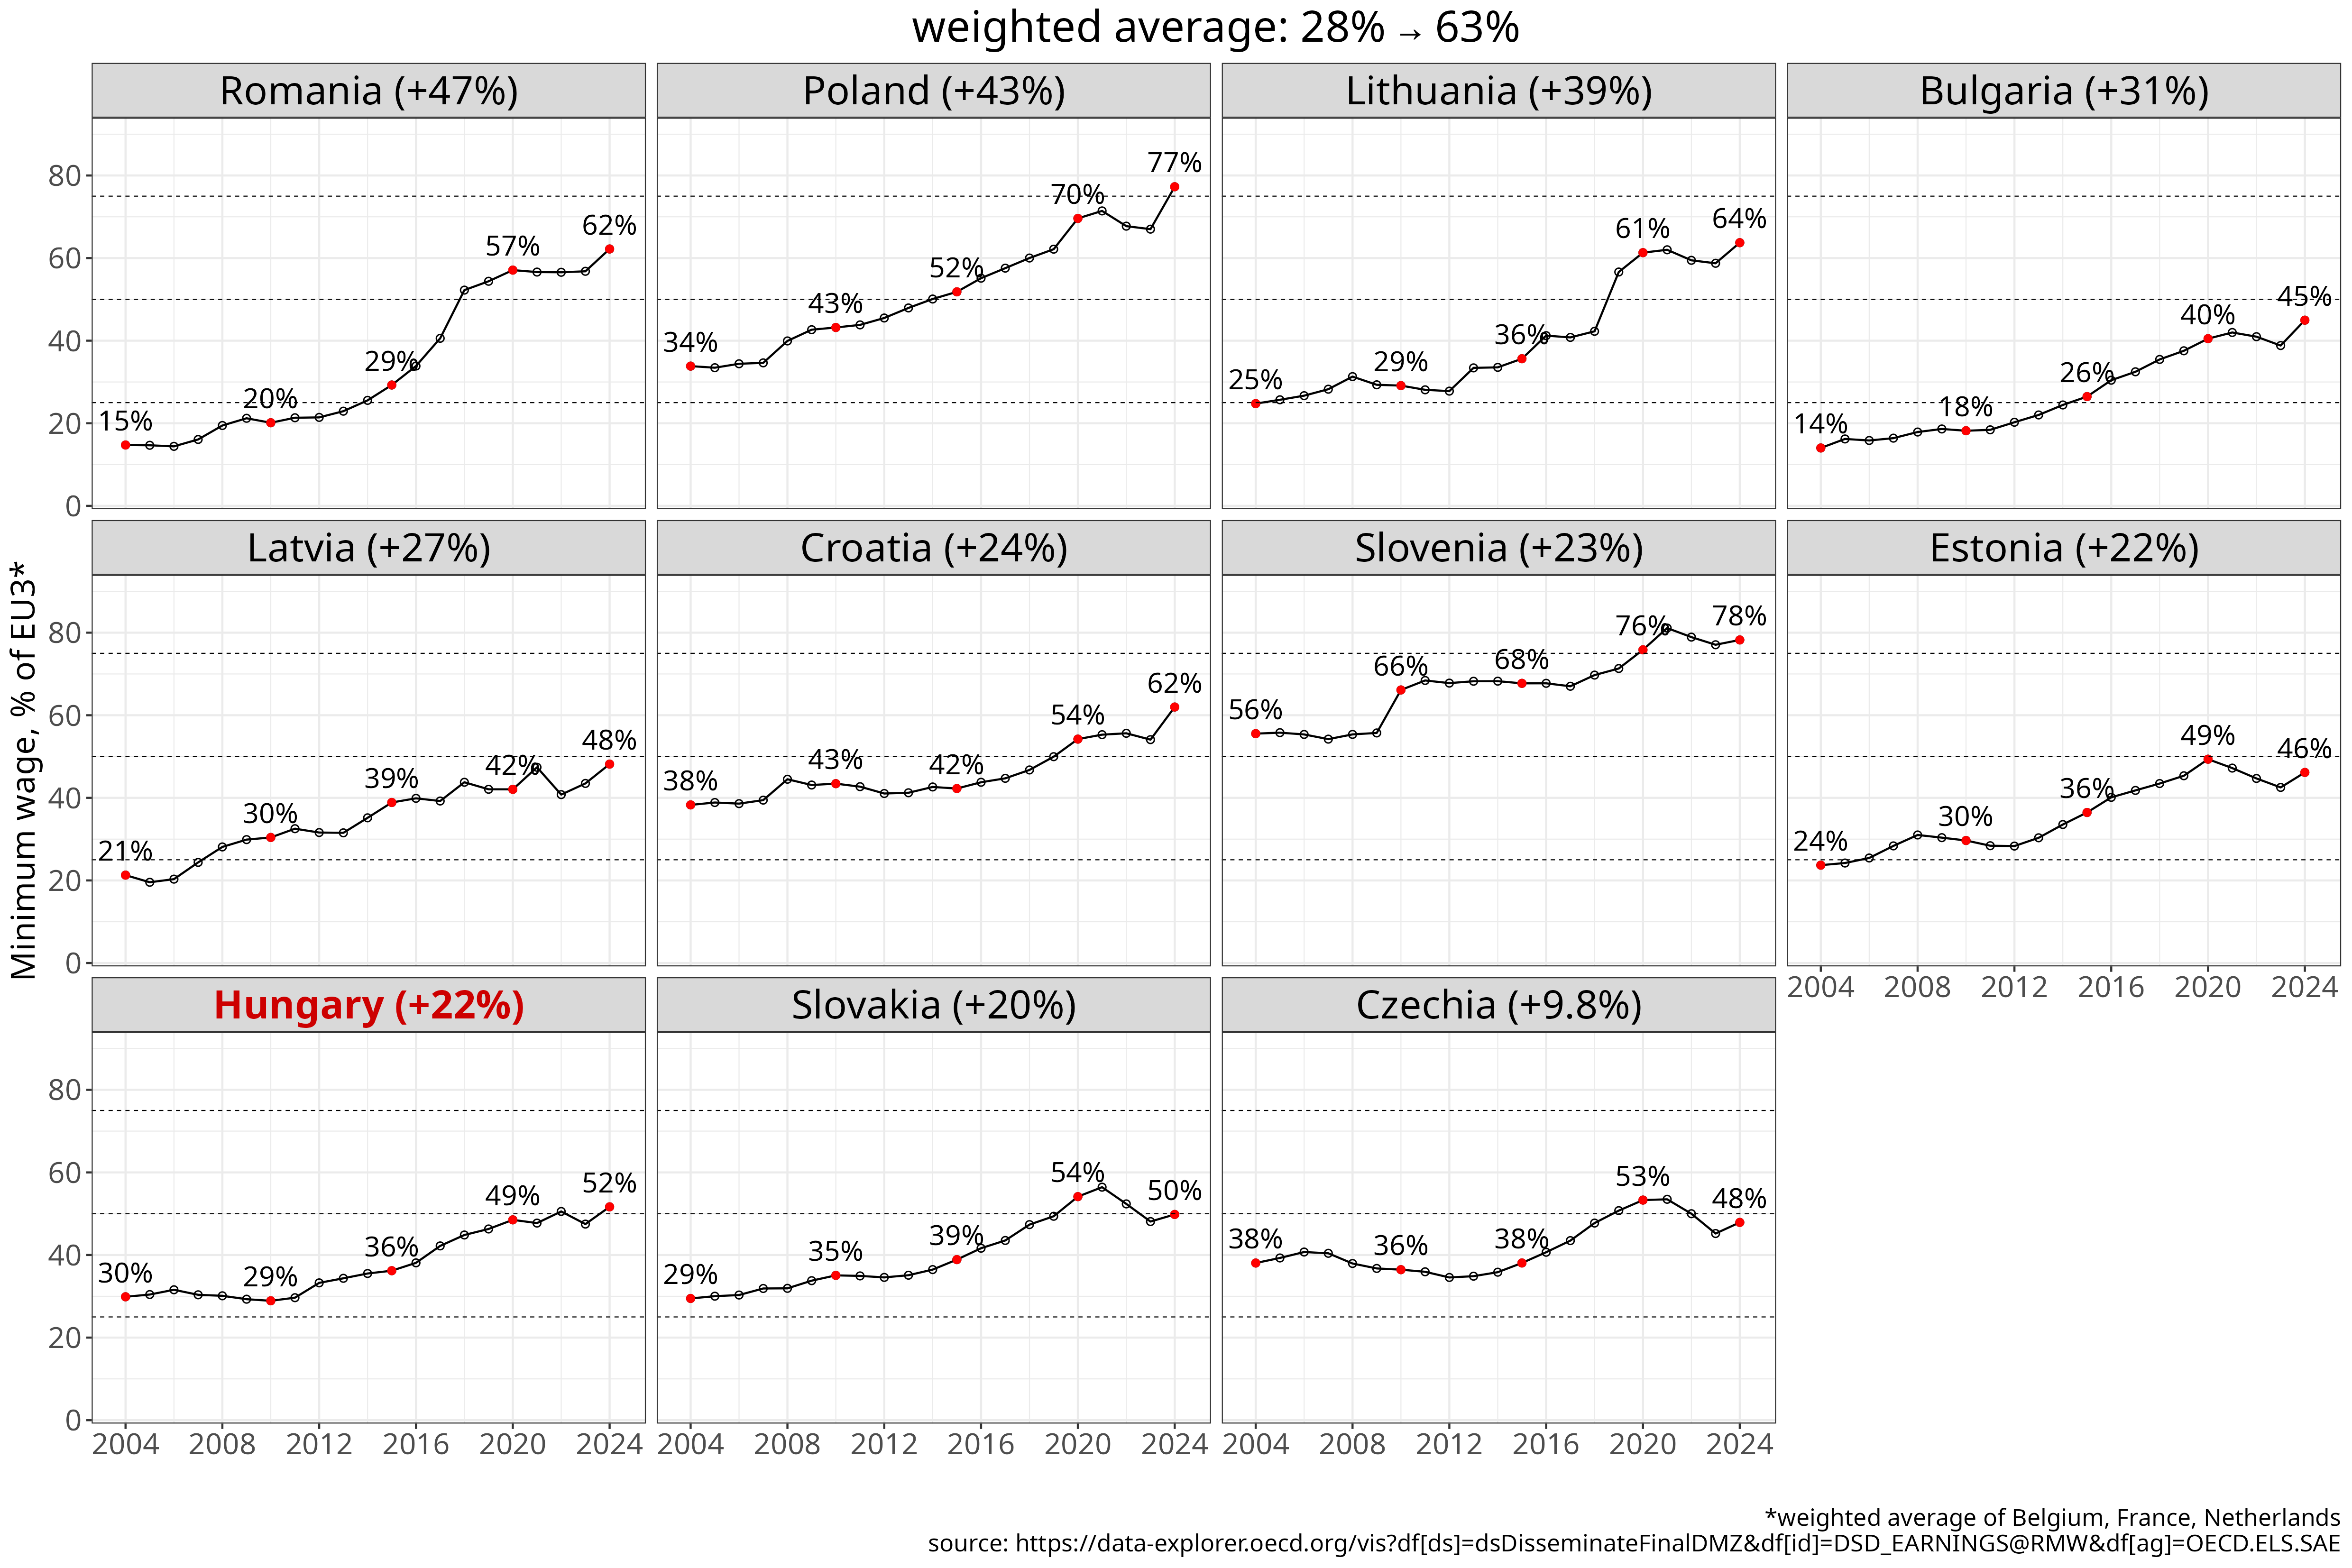
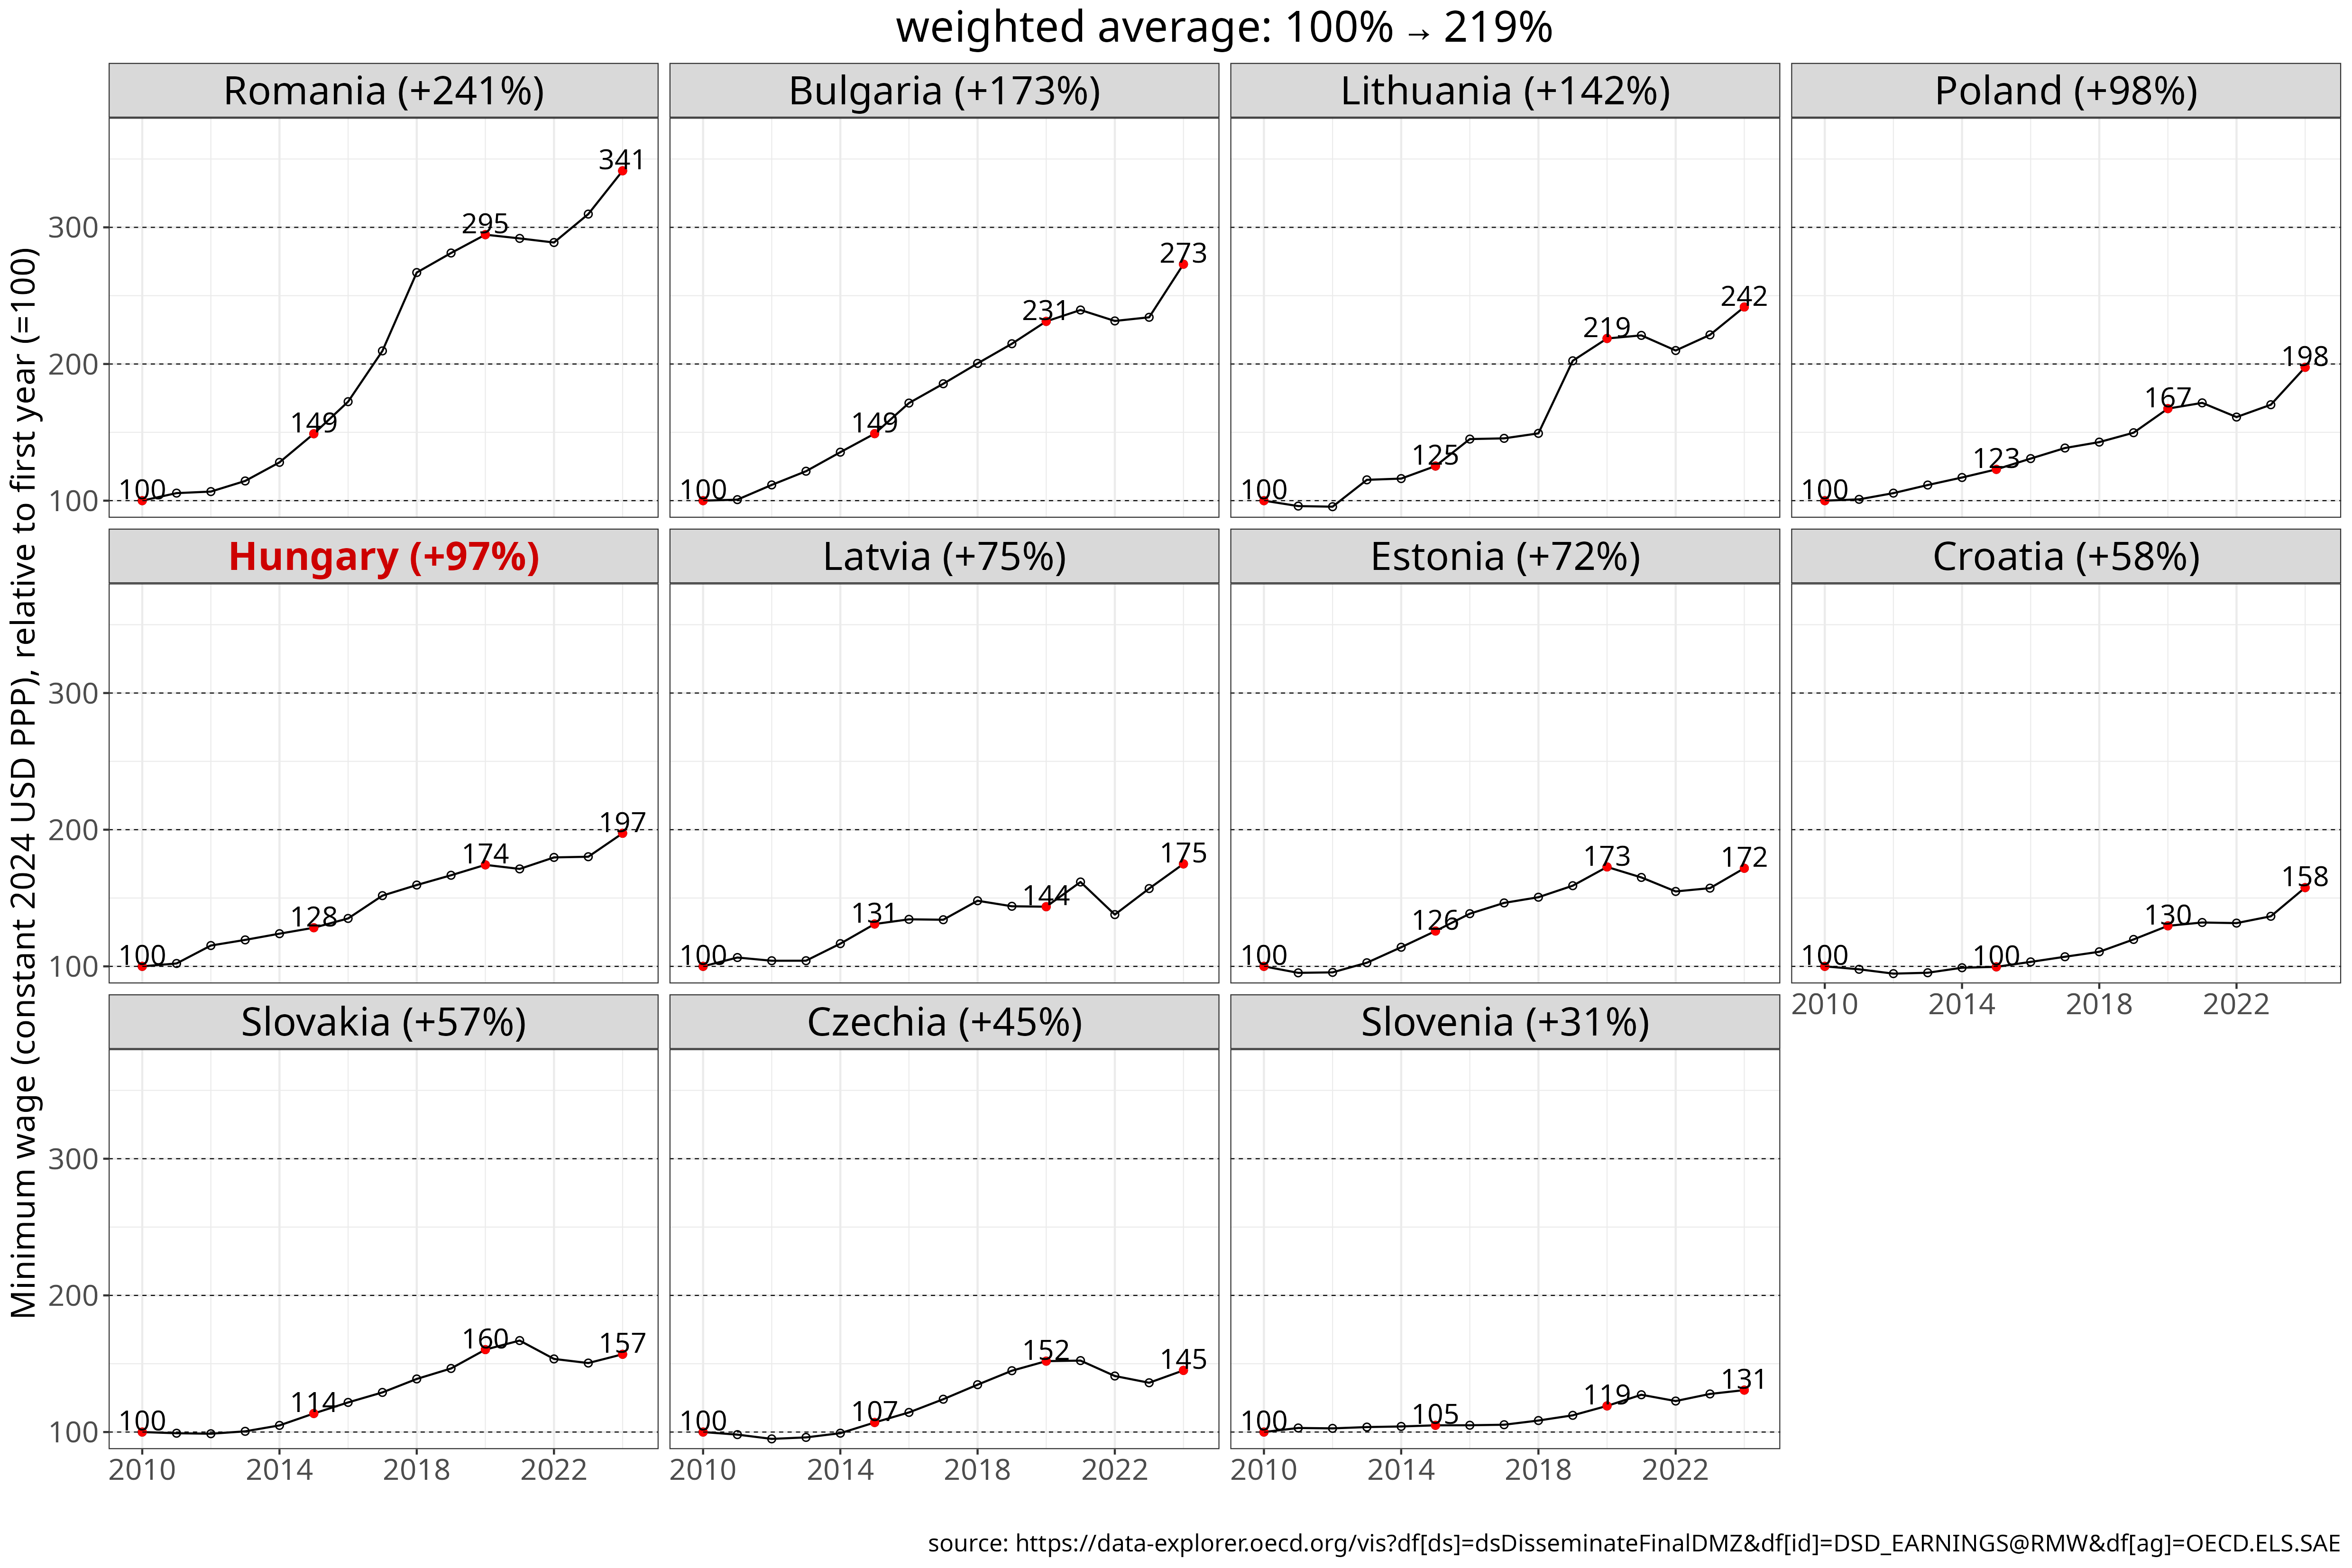
Figure 6 Minimum wages since 2004, measured in constant 2024 international dollars (PPP). The chart shows levels (const. USD PPP), indexed values relative to 2004 and 2010, and percentages of the EU8 weighted average. Countries are ranked by cumulative growth from the selected base year through 2024. [download data] [source]
Calculated from the 2004 baseline, Hungary ranks third from the bottom (+22% expressed as a share of the EU3 benchmark), with only Slovakia and Czechia showing weaker convergence. However, minimum wage increases accelerated in Hungary after 2010, and measured from this baseline its convergence is in the middle of the pack.
| country | % of EU8 | relative to initial value (%) | absolute value (thousand USD PPP) |
|---|---|---|---|
| Romania | +47% (15→62) | +396% | +15.9k (4→19.9) |
| Poland | +43% (34→77) | +169% | +15.5k (9.2→24.7) |
| Lithuania | +39% (25→64) | +203% | +13.7k (6.7→20.4) |
| Bulgaria | +31% (14→45) | +277% | +10.6k (3.8→14.4) |
| Latvia | +27% (21→48) | +166% | +9.6k (5.8→15.4) |
| Croatia | +24% (38→62) | +90% | +9.4k (10.4→19.8) |
| Slovenia | +23% (56→78) | +66% | +9.9k (15.1→25) |
| Estonia | +22% (24→46) | +129% | +8.3k (6.4→14.8) |
| Hungary | +22% (30→52) | +103% | +8.4k (8.1→16.5) |
| Slovakia | +20% (29→50) | +99% | +7.9k (8→15.9) |
| Czechia | +9.8% (38→48) | +48% | +5k (10.4→15.3) |
| country | % of EU8 | relative to initial value (%) | absolute value (thousand USD PPP) |
|---|---|---|---|
| Romania | +42% (20→62) | +241% | +14.1k (5.8→19.9) |
| Lithuania | +35% (29→64) | +142% | +12k (8.4→20.4) |
| Poland | +34% (43→77) | +98% | +12.2k (12.5→24.7) |
| Bulgaria | +27% (18→45) | +173% | +9.1k (5.3→14.4) |
| Hungary | +23% (29→52) | +97% | +8.2k (8.4→16.5) |
| Croatia | +19% (43→62) | +58% | +7.3k (12.6→19.8) |
| Latvia | +18% (30→48) | +75% | +6.6k (8.8→15.4) |
| Estonia | +16% (30→46) | +72% | +6.2k (8.6→14.8) |
| Slovakia | +15% (35→50) | +57% | +5.8k (10.2→15.9) |
| Slovenia | +12% (66→78) | +31% | +5.9k (19.2→25) |
| Czechia | +11% (36→48) | +45% | +4.8k (10.6→15.3) |
Table 6: Cumulative change in minimum wages from 2004 or 2010 to 2024, shown as a percentage of the EU8 weighted average, relative to the initial year, and in absolute terms (constant 2024 international dollars (PPP)). Countries are ranked by the EU8-relative measure.
Median equivalised net income
Wages are not the only source of income for individuals and households, and some households rely partly or entirely on other income streams, such as pensions or social benefits. Eurostat provides a series on median equivalised net income, a broader measure than median earnings that covers the entire population and includes all sources of household disposable income after taxes and transfers. The indicator is expressed on a per-person basis and adjusted for household size and composition.
Over the 2005-2024 period, the CEE region as a whole has seen substantial convergence, with median equivalised net income rising from 31 to 62% of the EU8 average. Poland, Romania and the Baltic countries recorded the largest gains, with Poland reaching 73% of the Western European benchmark. Slovenia, the most advanced country in the region, reached 87% of the EU8 level in 2024, coming close to Western European household income levels in purchasing power terms.
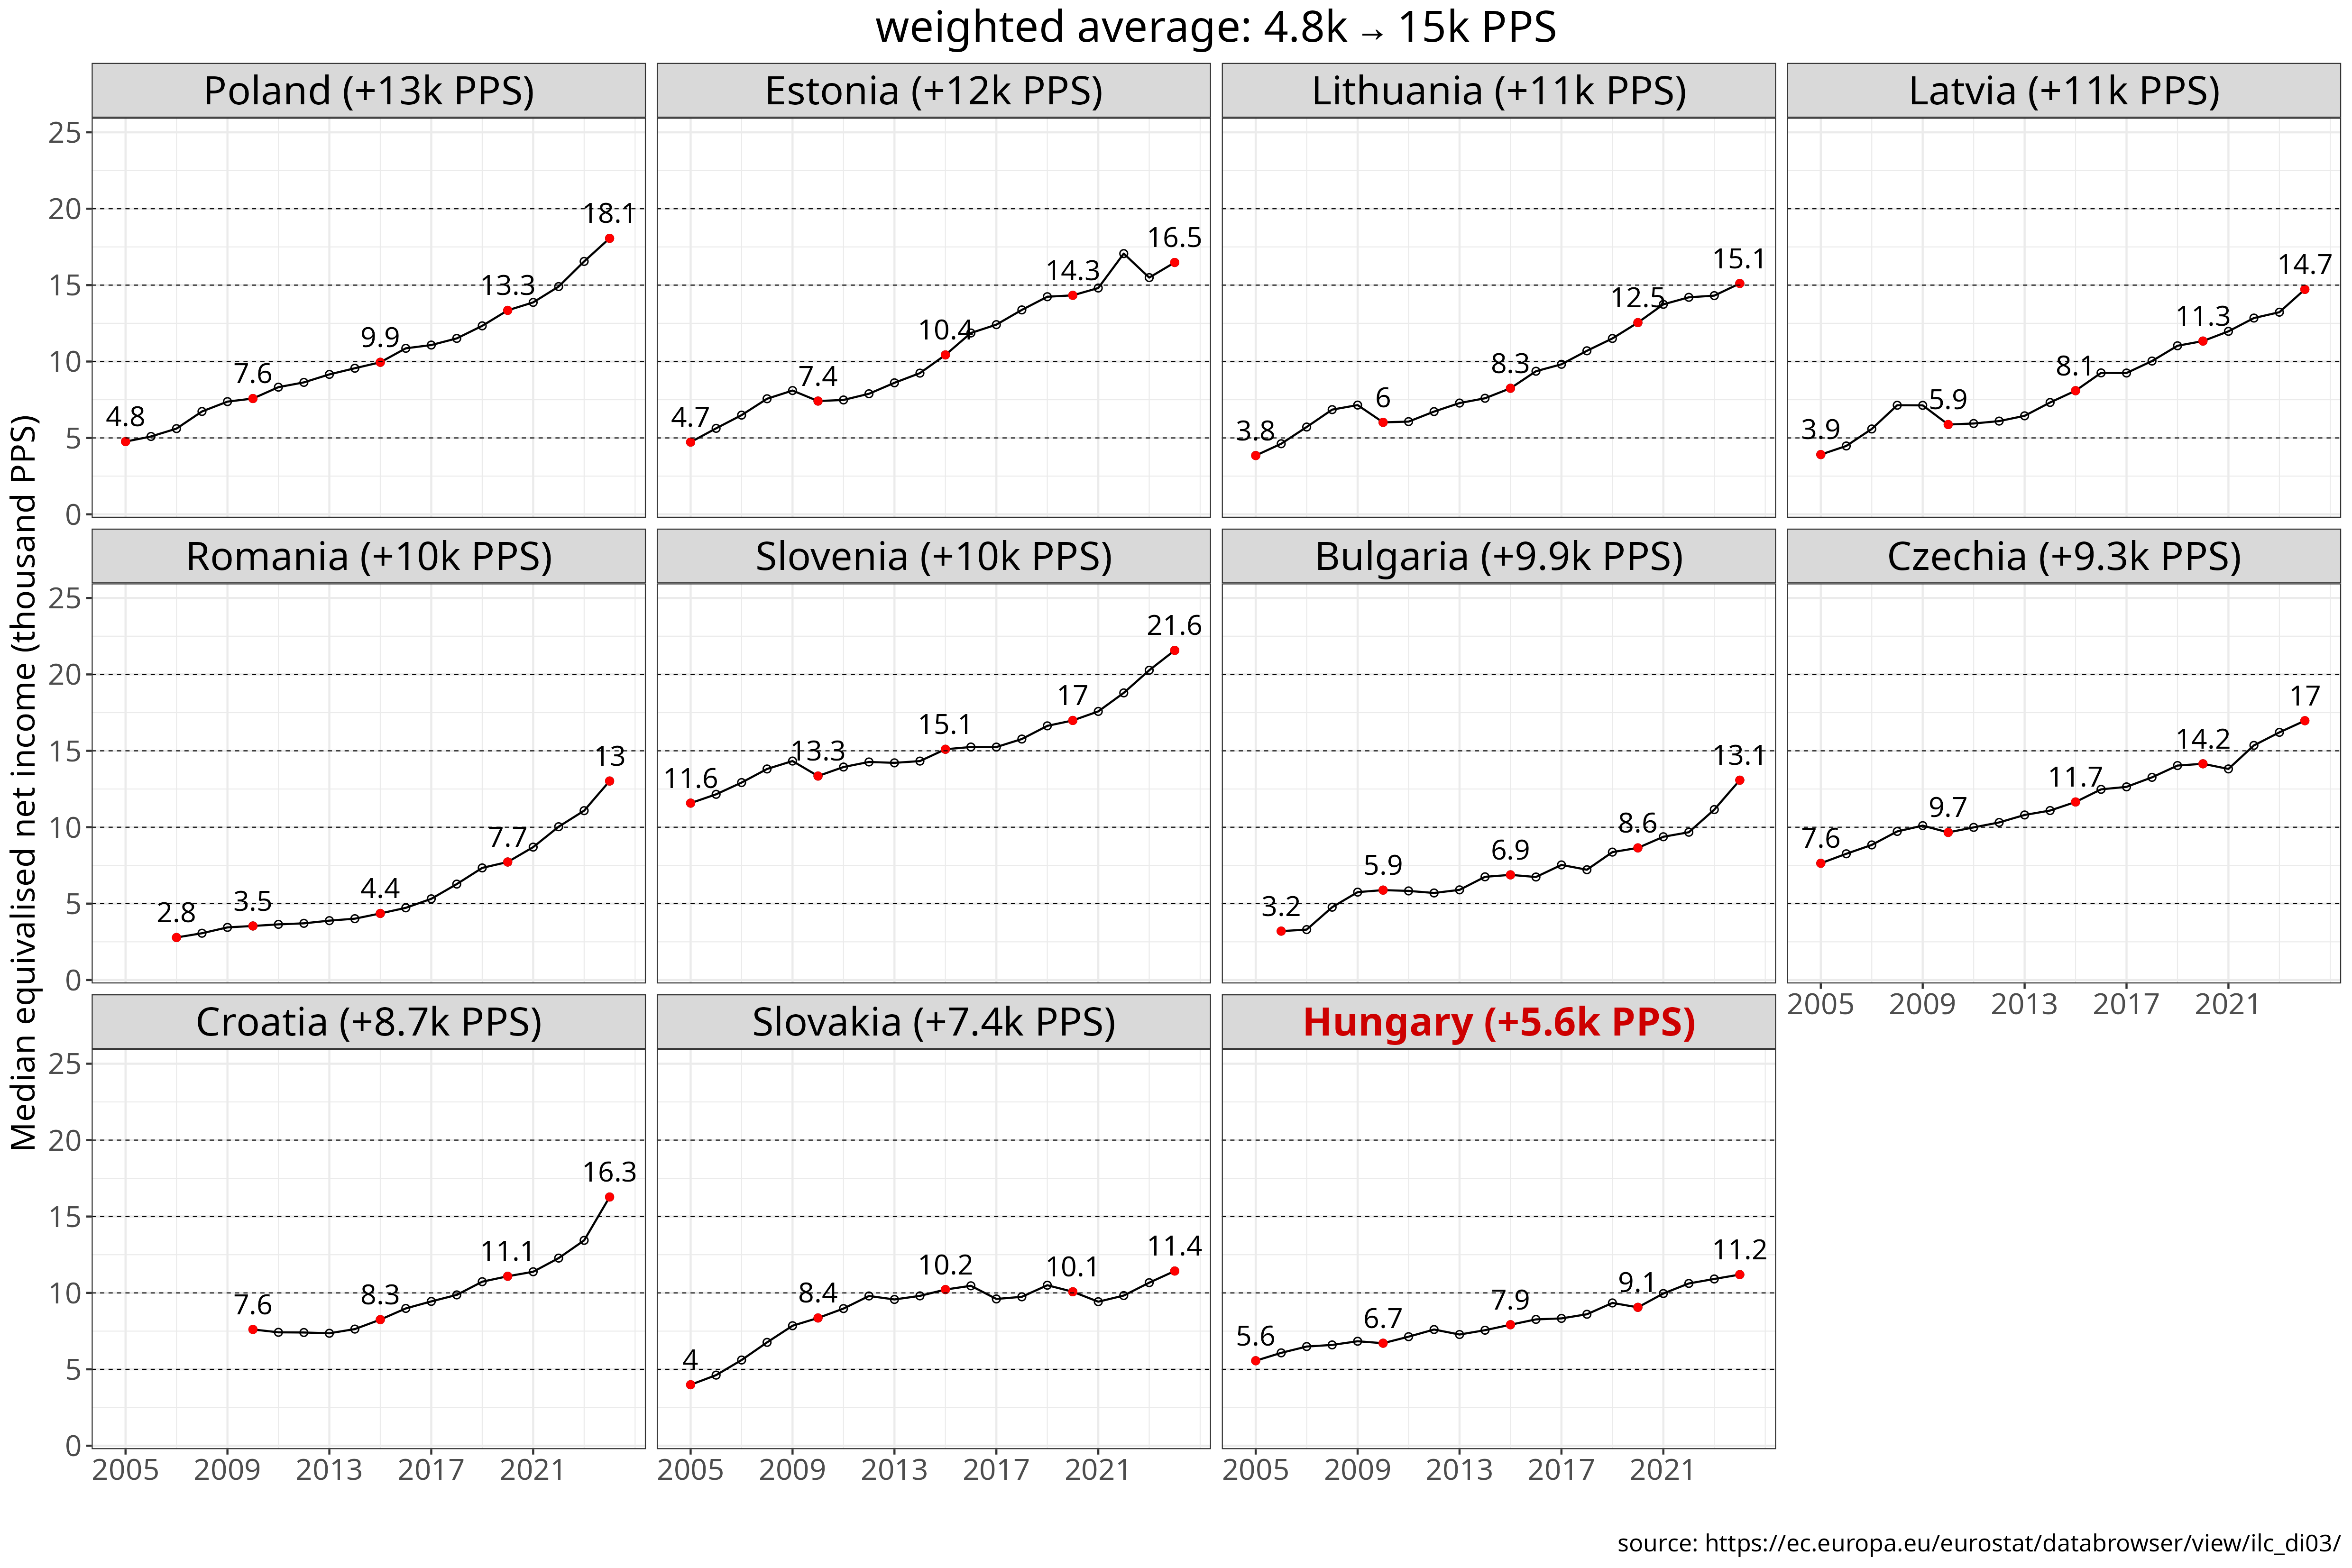
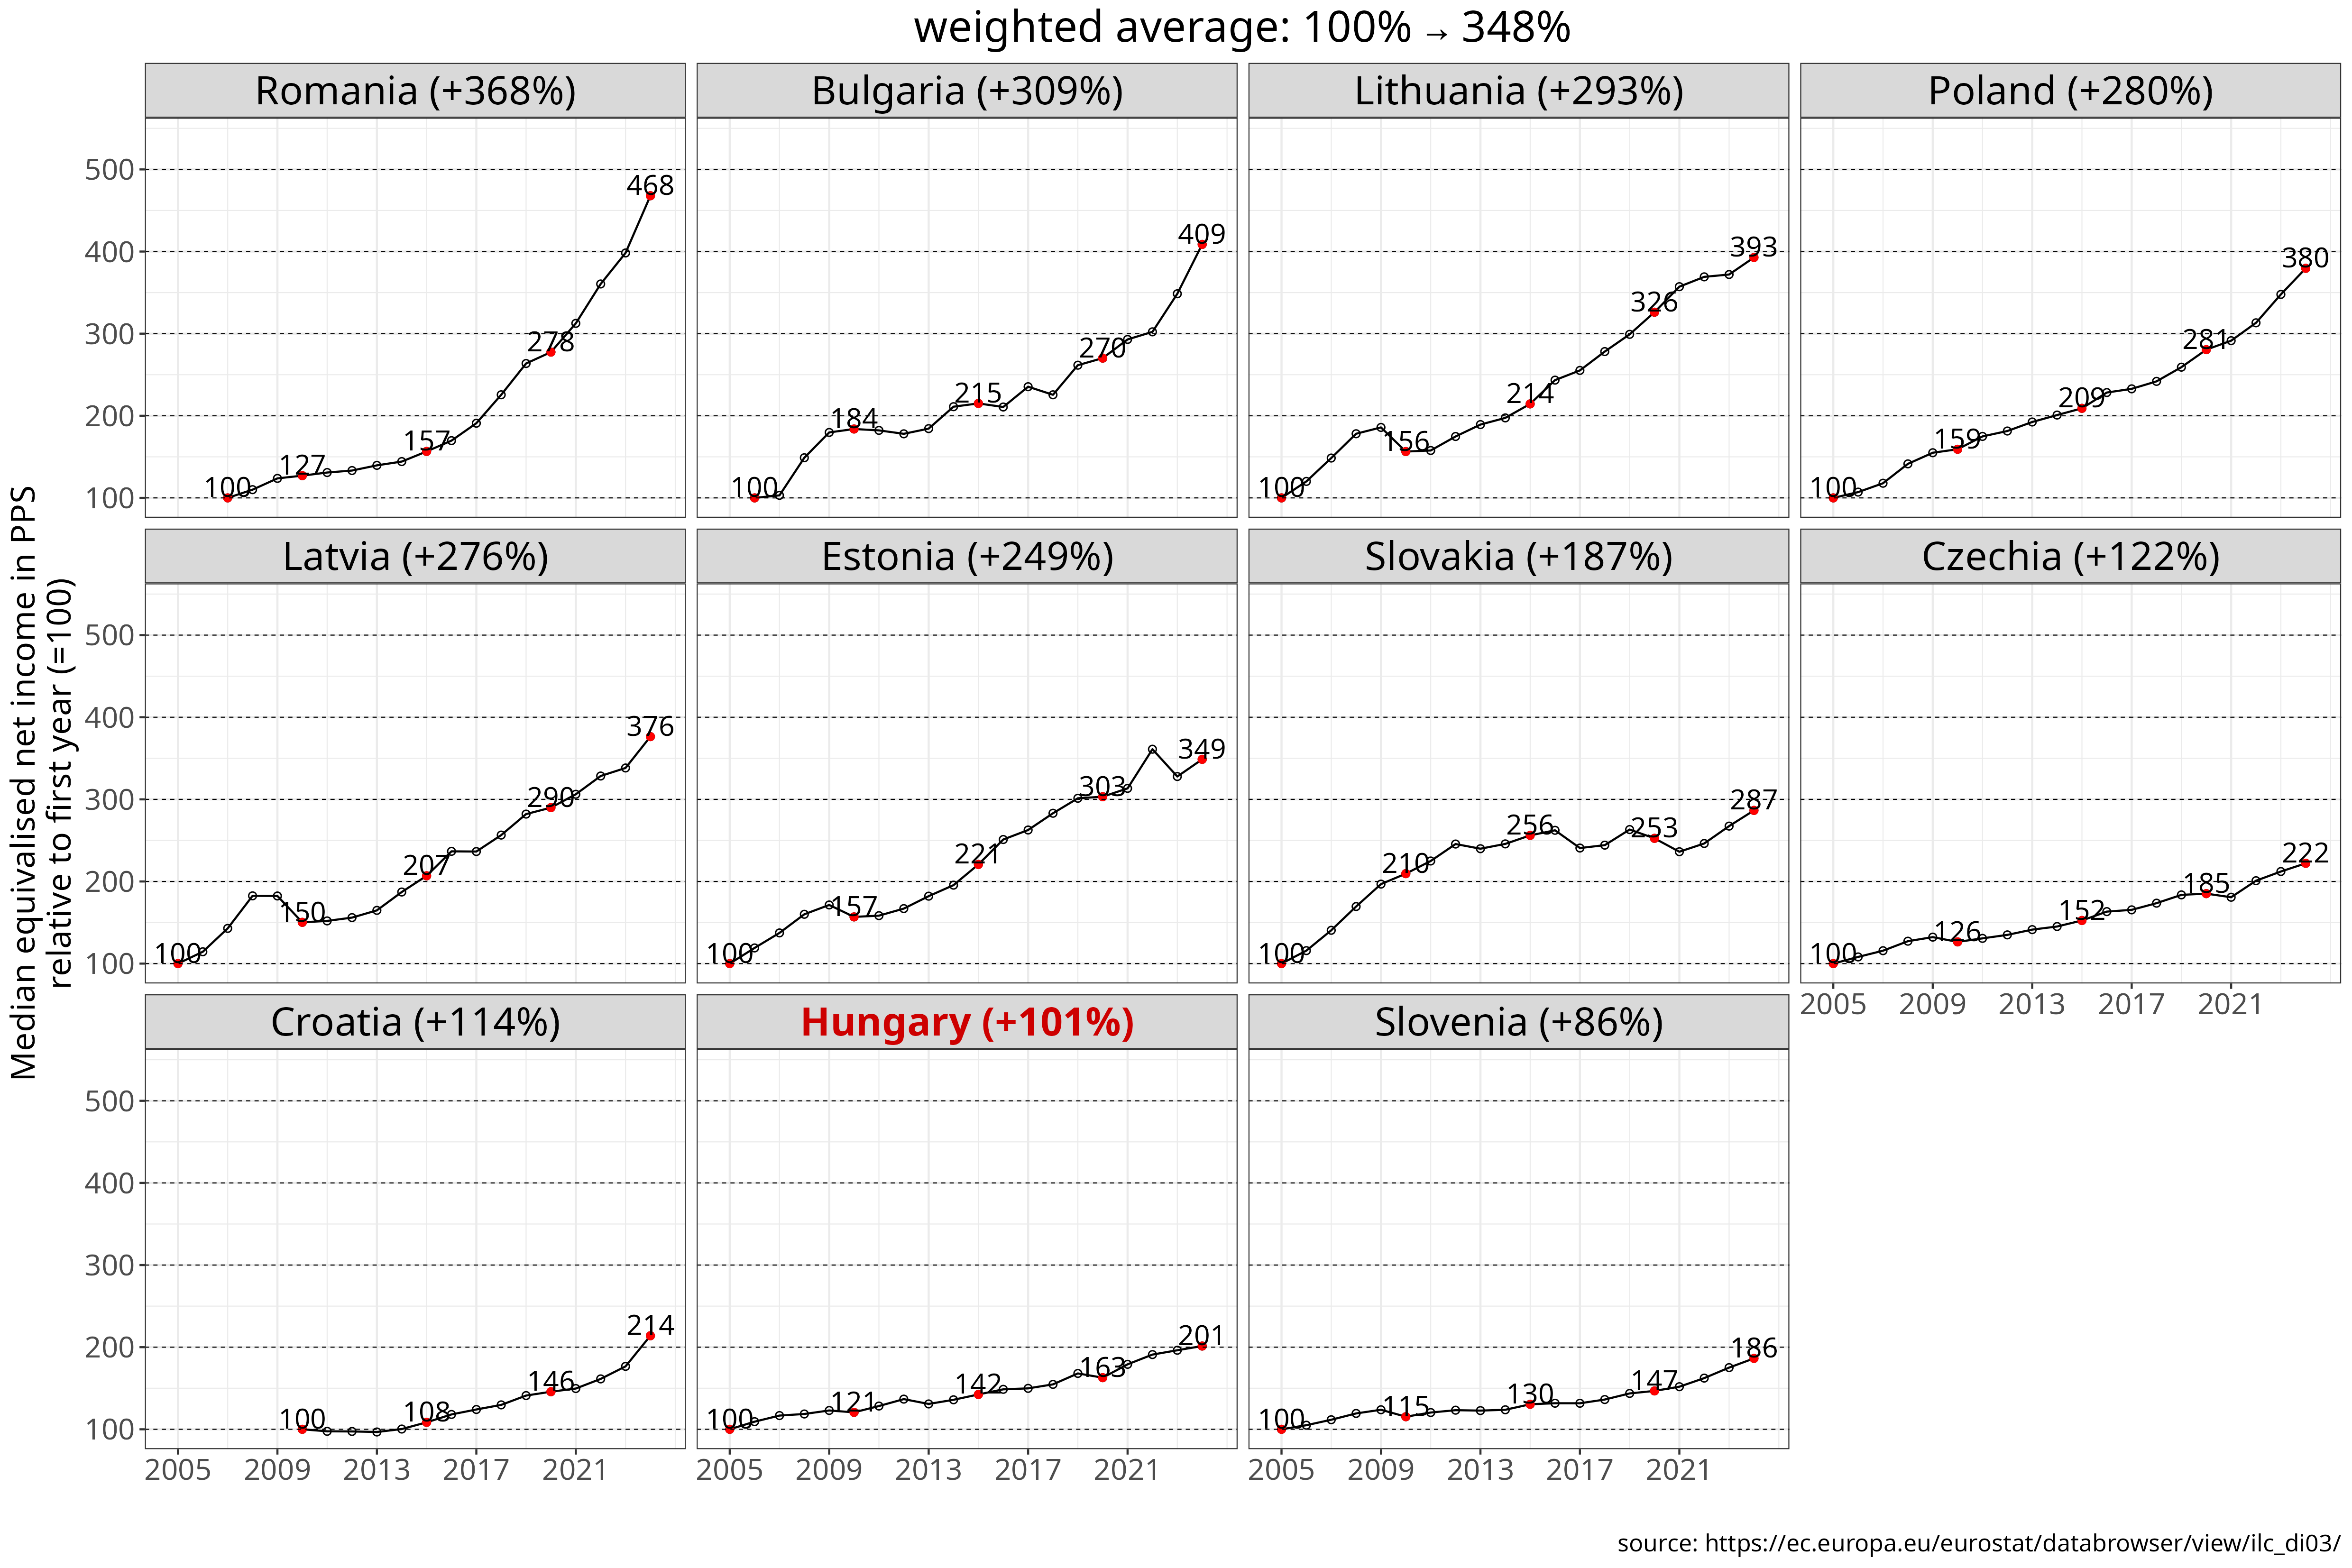
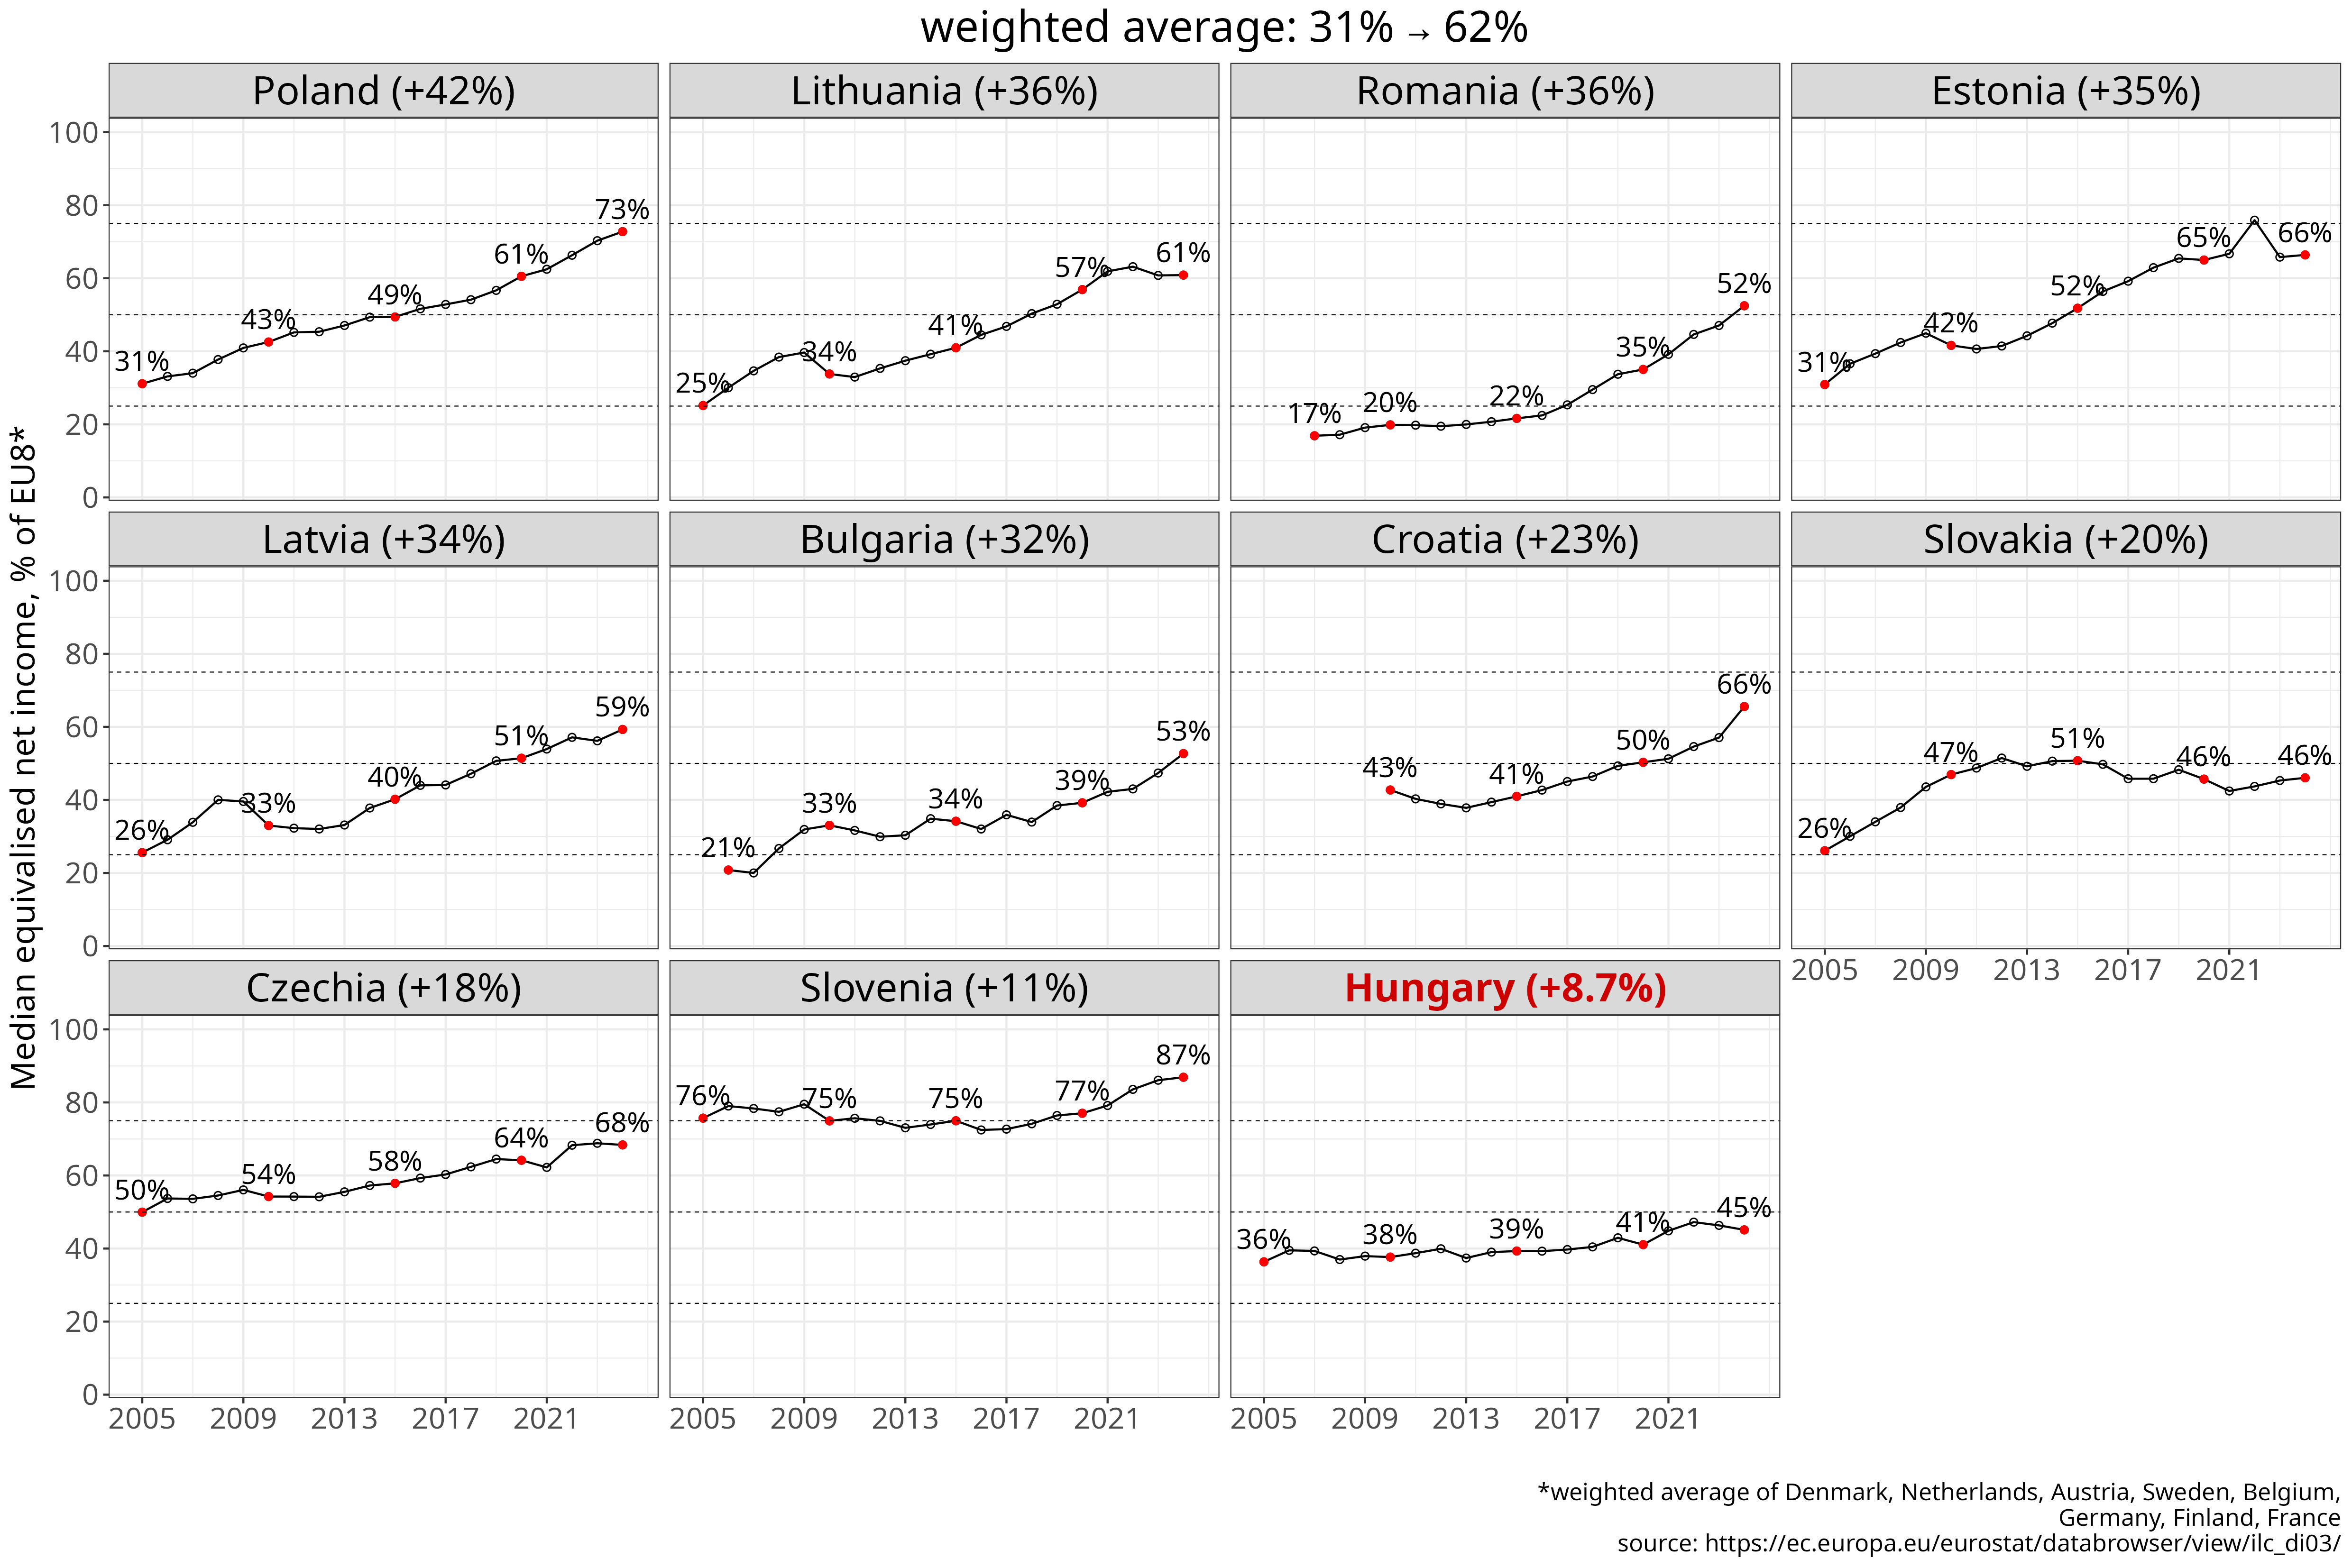
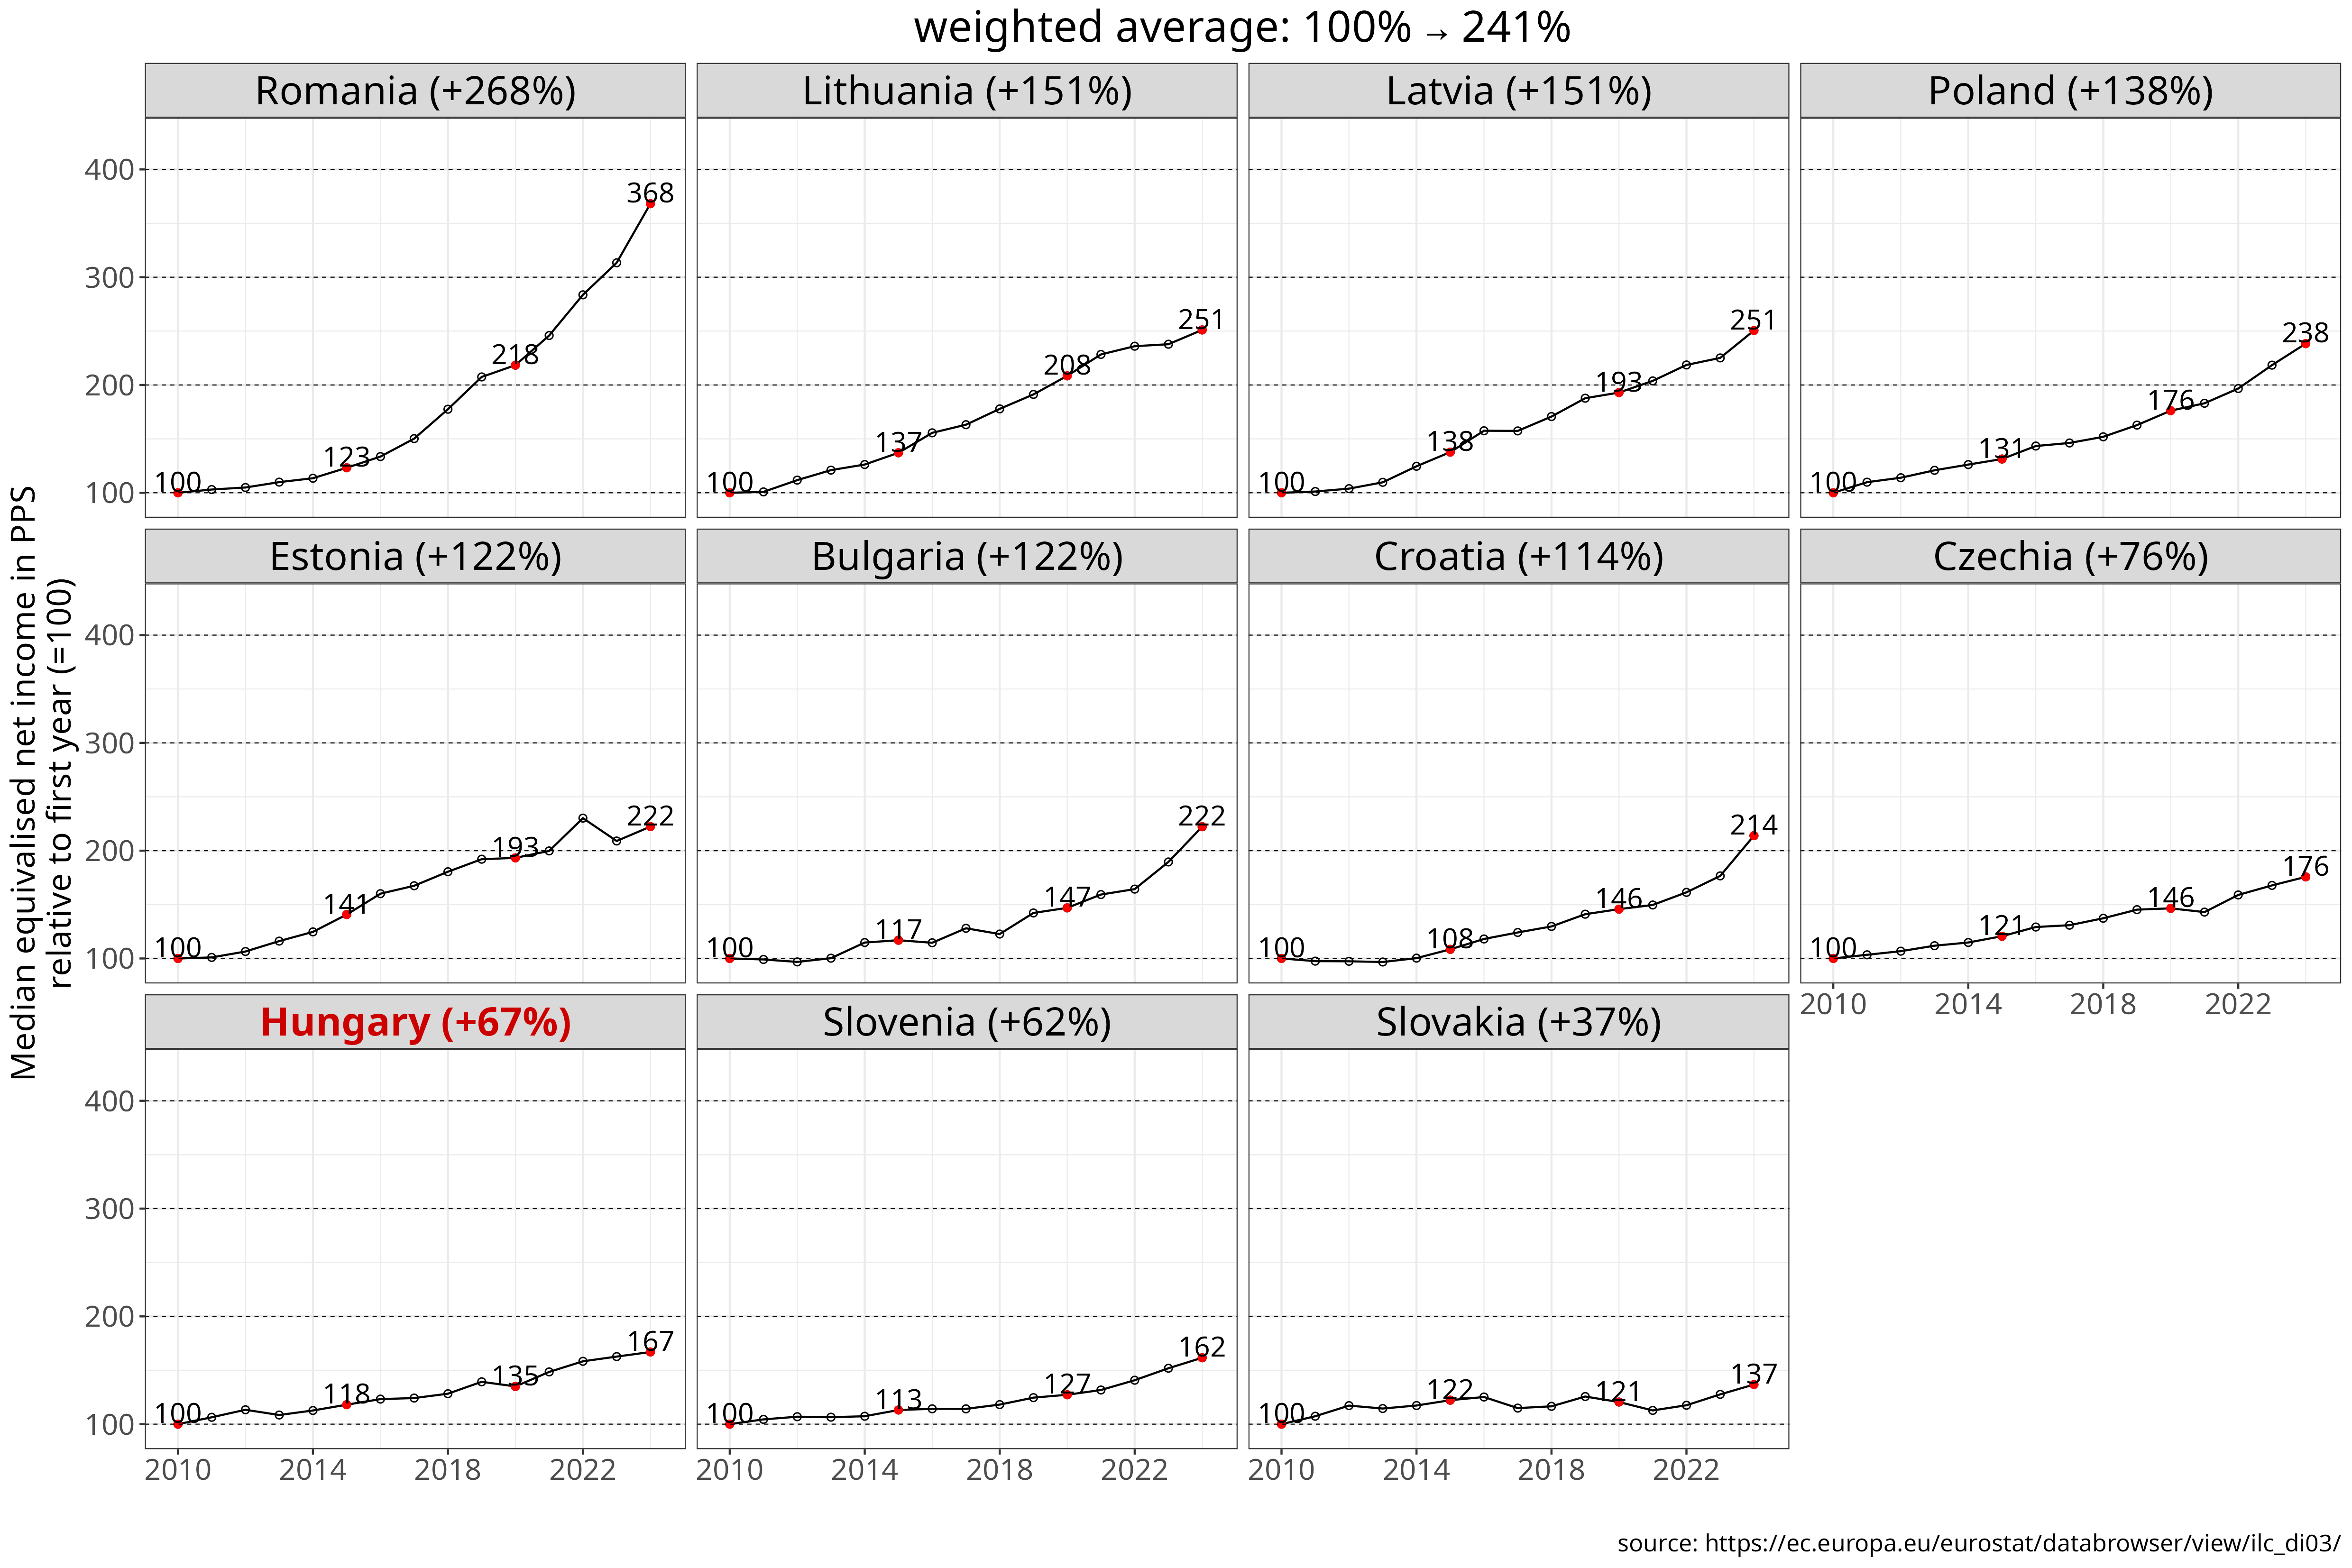
Figure 7 Median equivalised net income since 2005, measured in PPS (purchasing power standards anchored to EU-wide price changes). The chart shows levels (PPS), indexed values relative to 2005 and 2010, and percentages of the EU8 weighted average. Countries are ranked by cumulative growth from the selected base year through 2024. [download data] [source]
Hungary has seen the weakest convergence from the 2005 baseline, with household income rising by only 9 percentage points relative to the EU8 average over two decades. This is the poorest performance in the region and has resulted in Hungary also having the lowest level of household income in 2024. Measured from the 2010 baseline, Slovakia’s convergence has been even weaker. As a result, household income levels in the two countries are now roughly identical and below two-thirds of Poland’s level, although Hungary started from a higher level than Poland in 2005.
| country | % of EU8 | relative to initial value (%) | absolute value (thousand PPS) |
|---|---|---|---|
| Poland | +39% (34→73) | +222% | +12.5k (5.6→18.1) |
| Romania | +36% (17→52) | +368% | +10.2k (2.8→13) |
| Bulgaria | +33% (20→53) | +296% | +9.8k (3.3→13.1) |
| Estonia | +27% (39→66) | +154% | +10k (6.5→16.5) |
| Lithuania | +26% (35→61) | +164% | +9.4k (5.7→15.1) |
| Latvia | +25% (34→59) | +163% | +9.1k (5.6→14.7) |
| Czechia | +15% (54→68) | +92% | +8.1k (8.8→17) |
| Slovakia | +12% (34→46) | +104% | +5.8k (5.6→11.4) |
| Slovenia | +8.5% (78→87) | +67% | +8.6k (12.9→21.6) |
| Hungary | +5.8% (39→45) | +73% | +4.7k (6.5→11.2) |
| country | % of EU8 | relative to initial value (%) | absolute value (thousand PPS) |
|---|---|---|---|
| Romania | +33% (20→52) | +268% | +9.5k (3.5→13) |
| Poland | +30% (43→73) | +138% | +10.5k (7.6→18.1) |
| Lithuania | +27% (34→61) | +151% | +9.1k (6→15.1) |
| Latvia | +26% (33→59) | +151% | +8.8k (5.9→14.7) |
| Estonia | +25% (42→66) | +122% | +9.1k (7.4→16.5) |
| Croatia | +23% (43→66) | +114% | +8.7k (7.6→16.3) |
| Bulgaria | +20% (33→53) | +122% | +7.2k (5.9→13.1) |
| Czechia | +14% (54→68) | +76% | +7.3k (9.7→17) |
| Slovenia | +12% (75→87) | +62% | +8.2k (13.3→21.6) |
| Hungary | +7.4% (38→45) | +67% | +4.5k (6.7→11.2) |
| Slovakia | -0.88% (47→46) | +37% | +3.1k (8.4→11.4) |
Table 7: Cumulative change in median equivalised net income from 2005 or 2010 to 2024, shown as a percentage of the EU8 weighted average, relative to the initial year, and in absolute terms (purchasing power standards,PPP). Countries are ranked by the EU8-relative measure.
Actual individual consumption
Median net household income provides a broad picture of household finances, but it does not fully capture living standards, since consumption patterns can differ across countries. Savings rates also vary - for example, due to differences in pension systems - which affects how much income is available for current consumption.
To address these differences, Eurostat uses a per capita consumption measure known as actual individual consumption (AIC). AIC reflects total household consumption per person, regardless of who pays for it. AIC includes goods and services consumed by households but paid for by governments or non-profit institutions, even when households do not incur these costs directly. The indicator is expressed in purchasing power standards (PPS; see the Methods section for details).
Figure 8 shows that the convergence in consumption level to the EU8 average has been similar to that of household income, with a 27% rise from 2004 to 2024. Romania, Bulgaria, Poland and the Baltic states again recorded the largest gains.
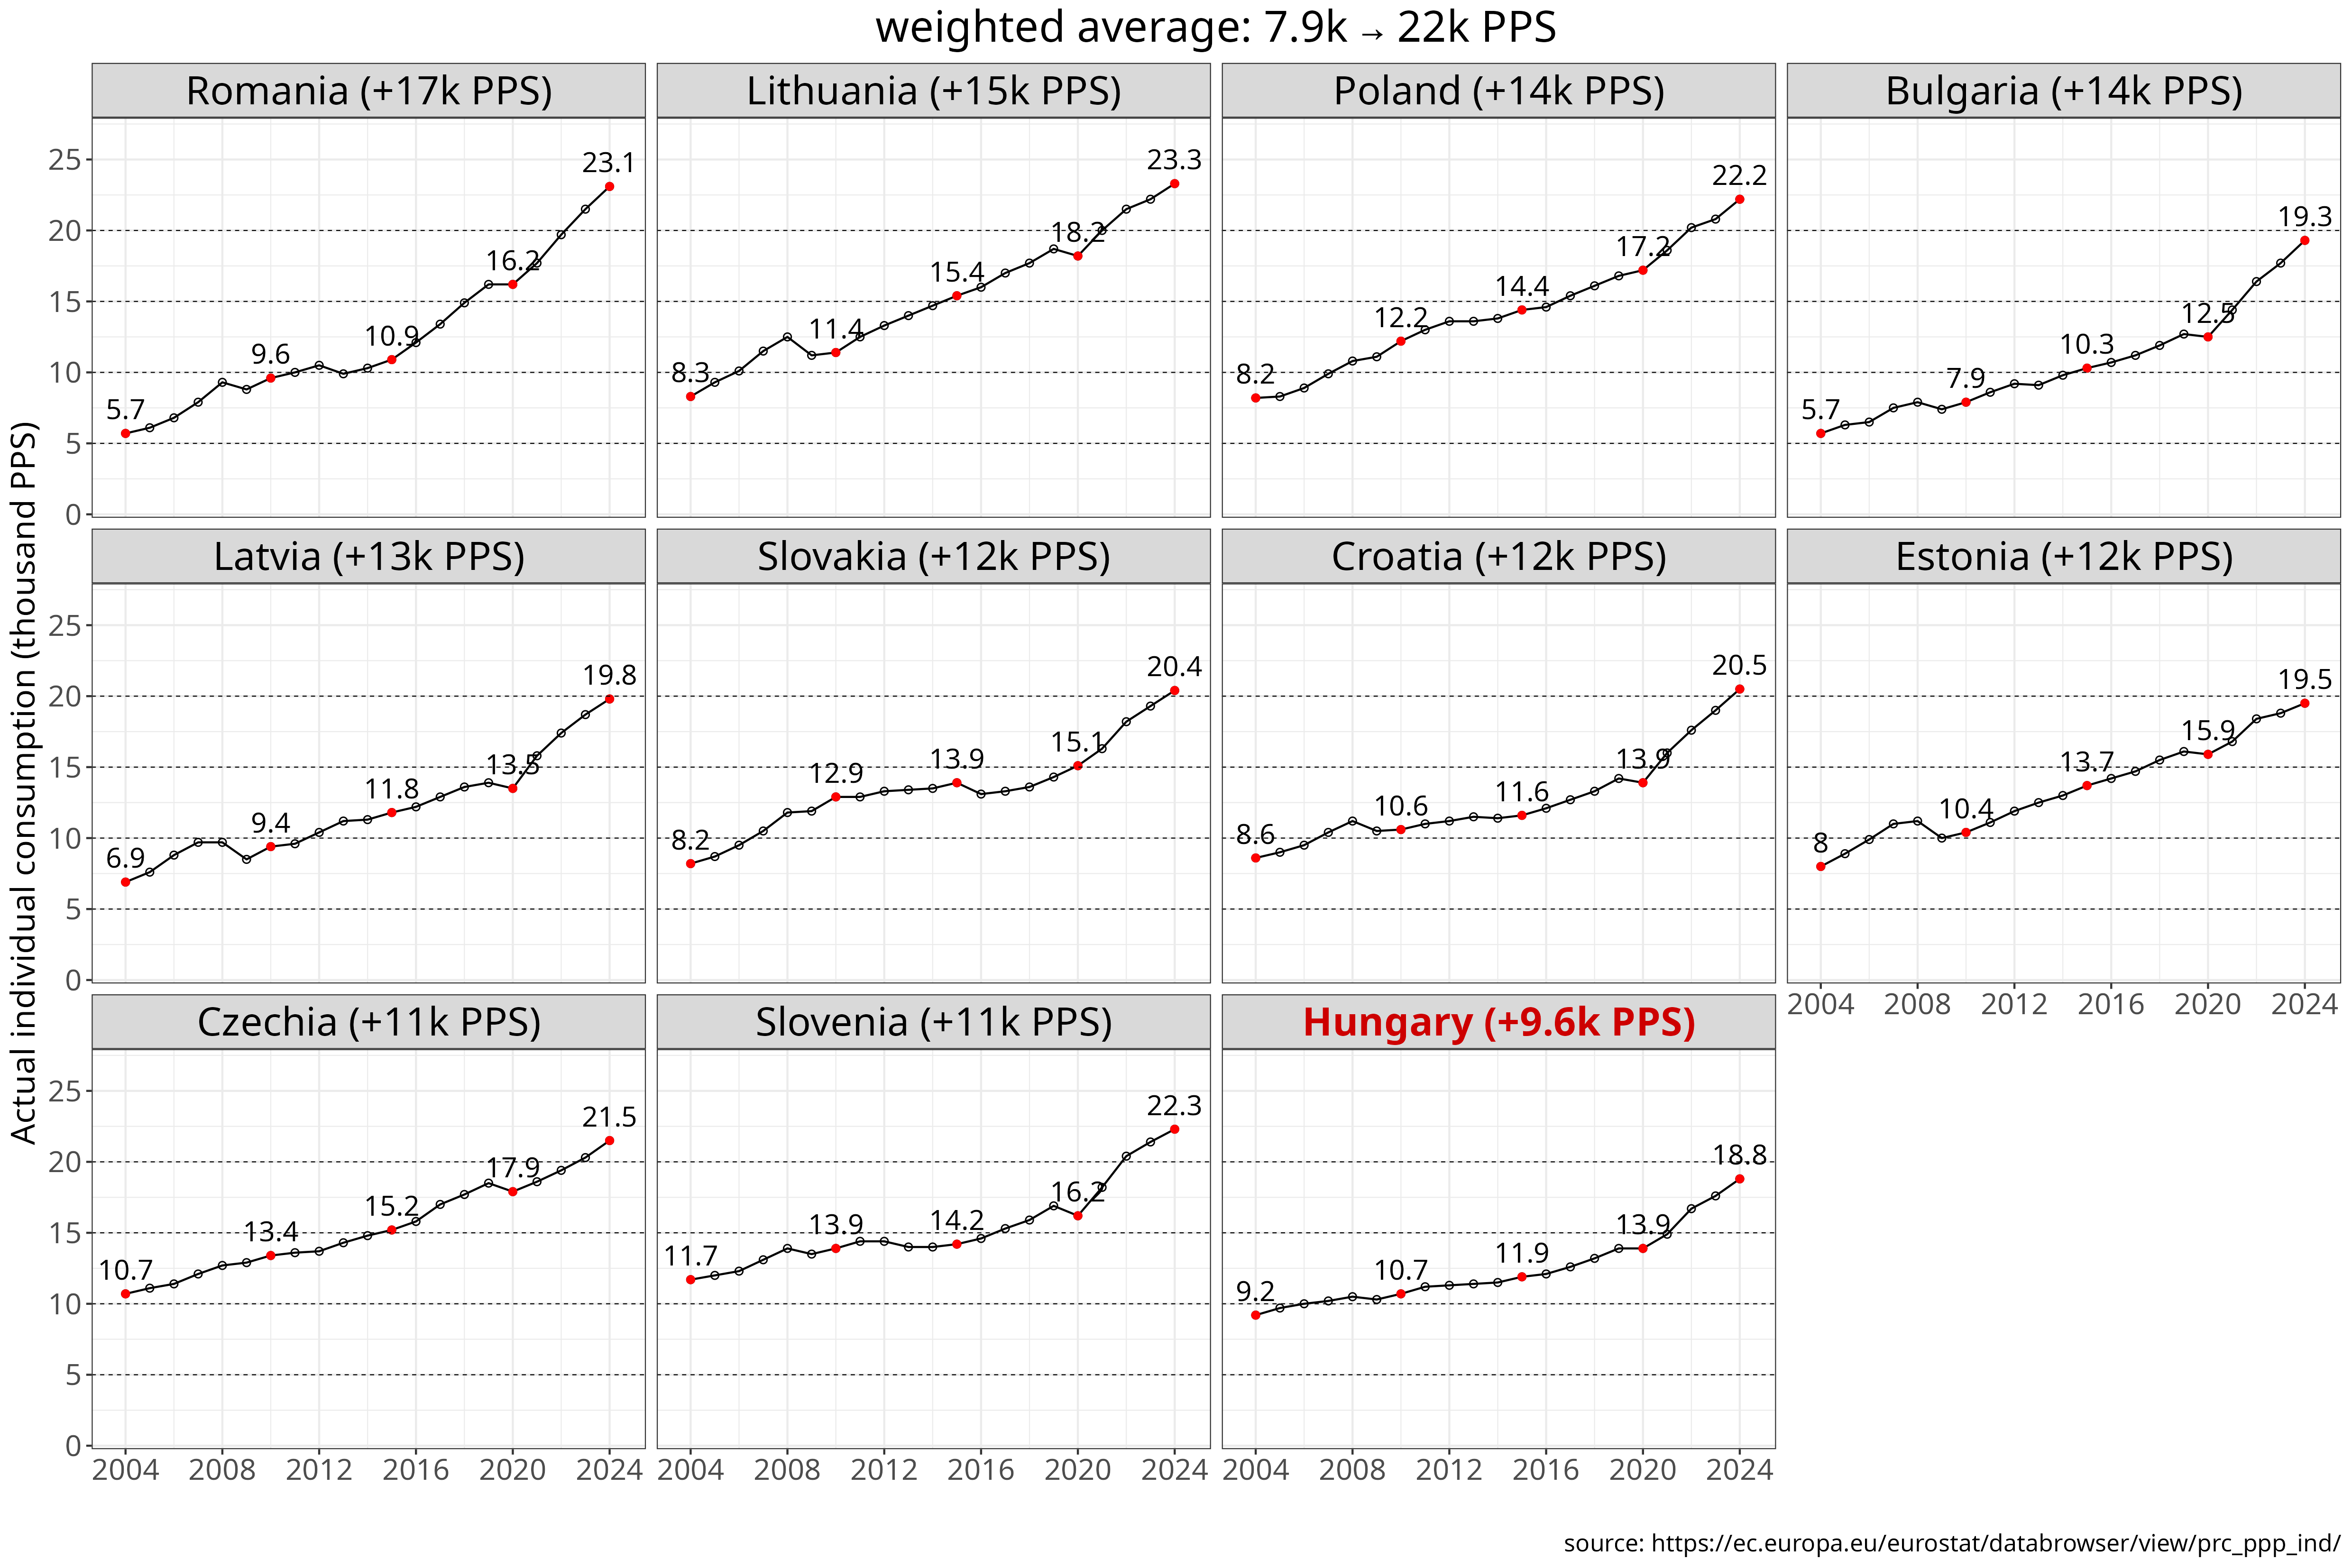
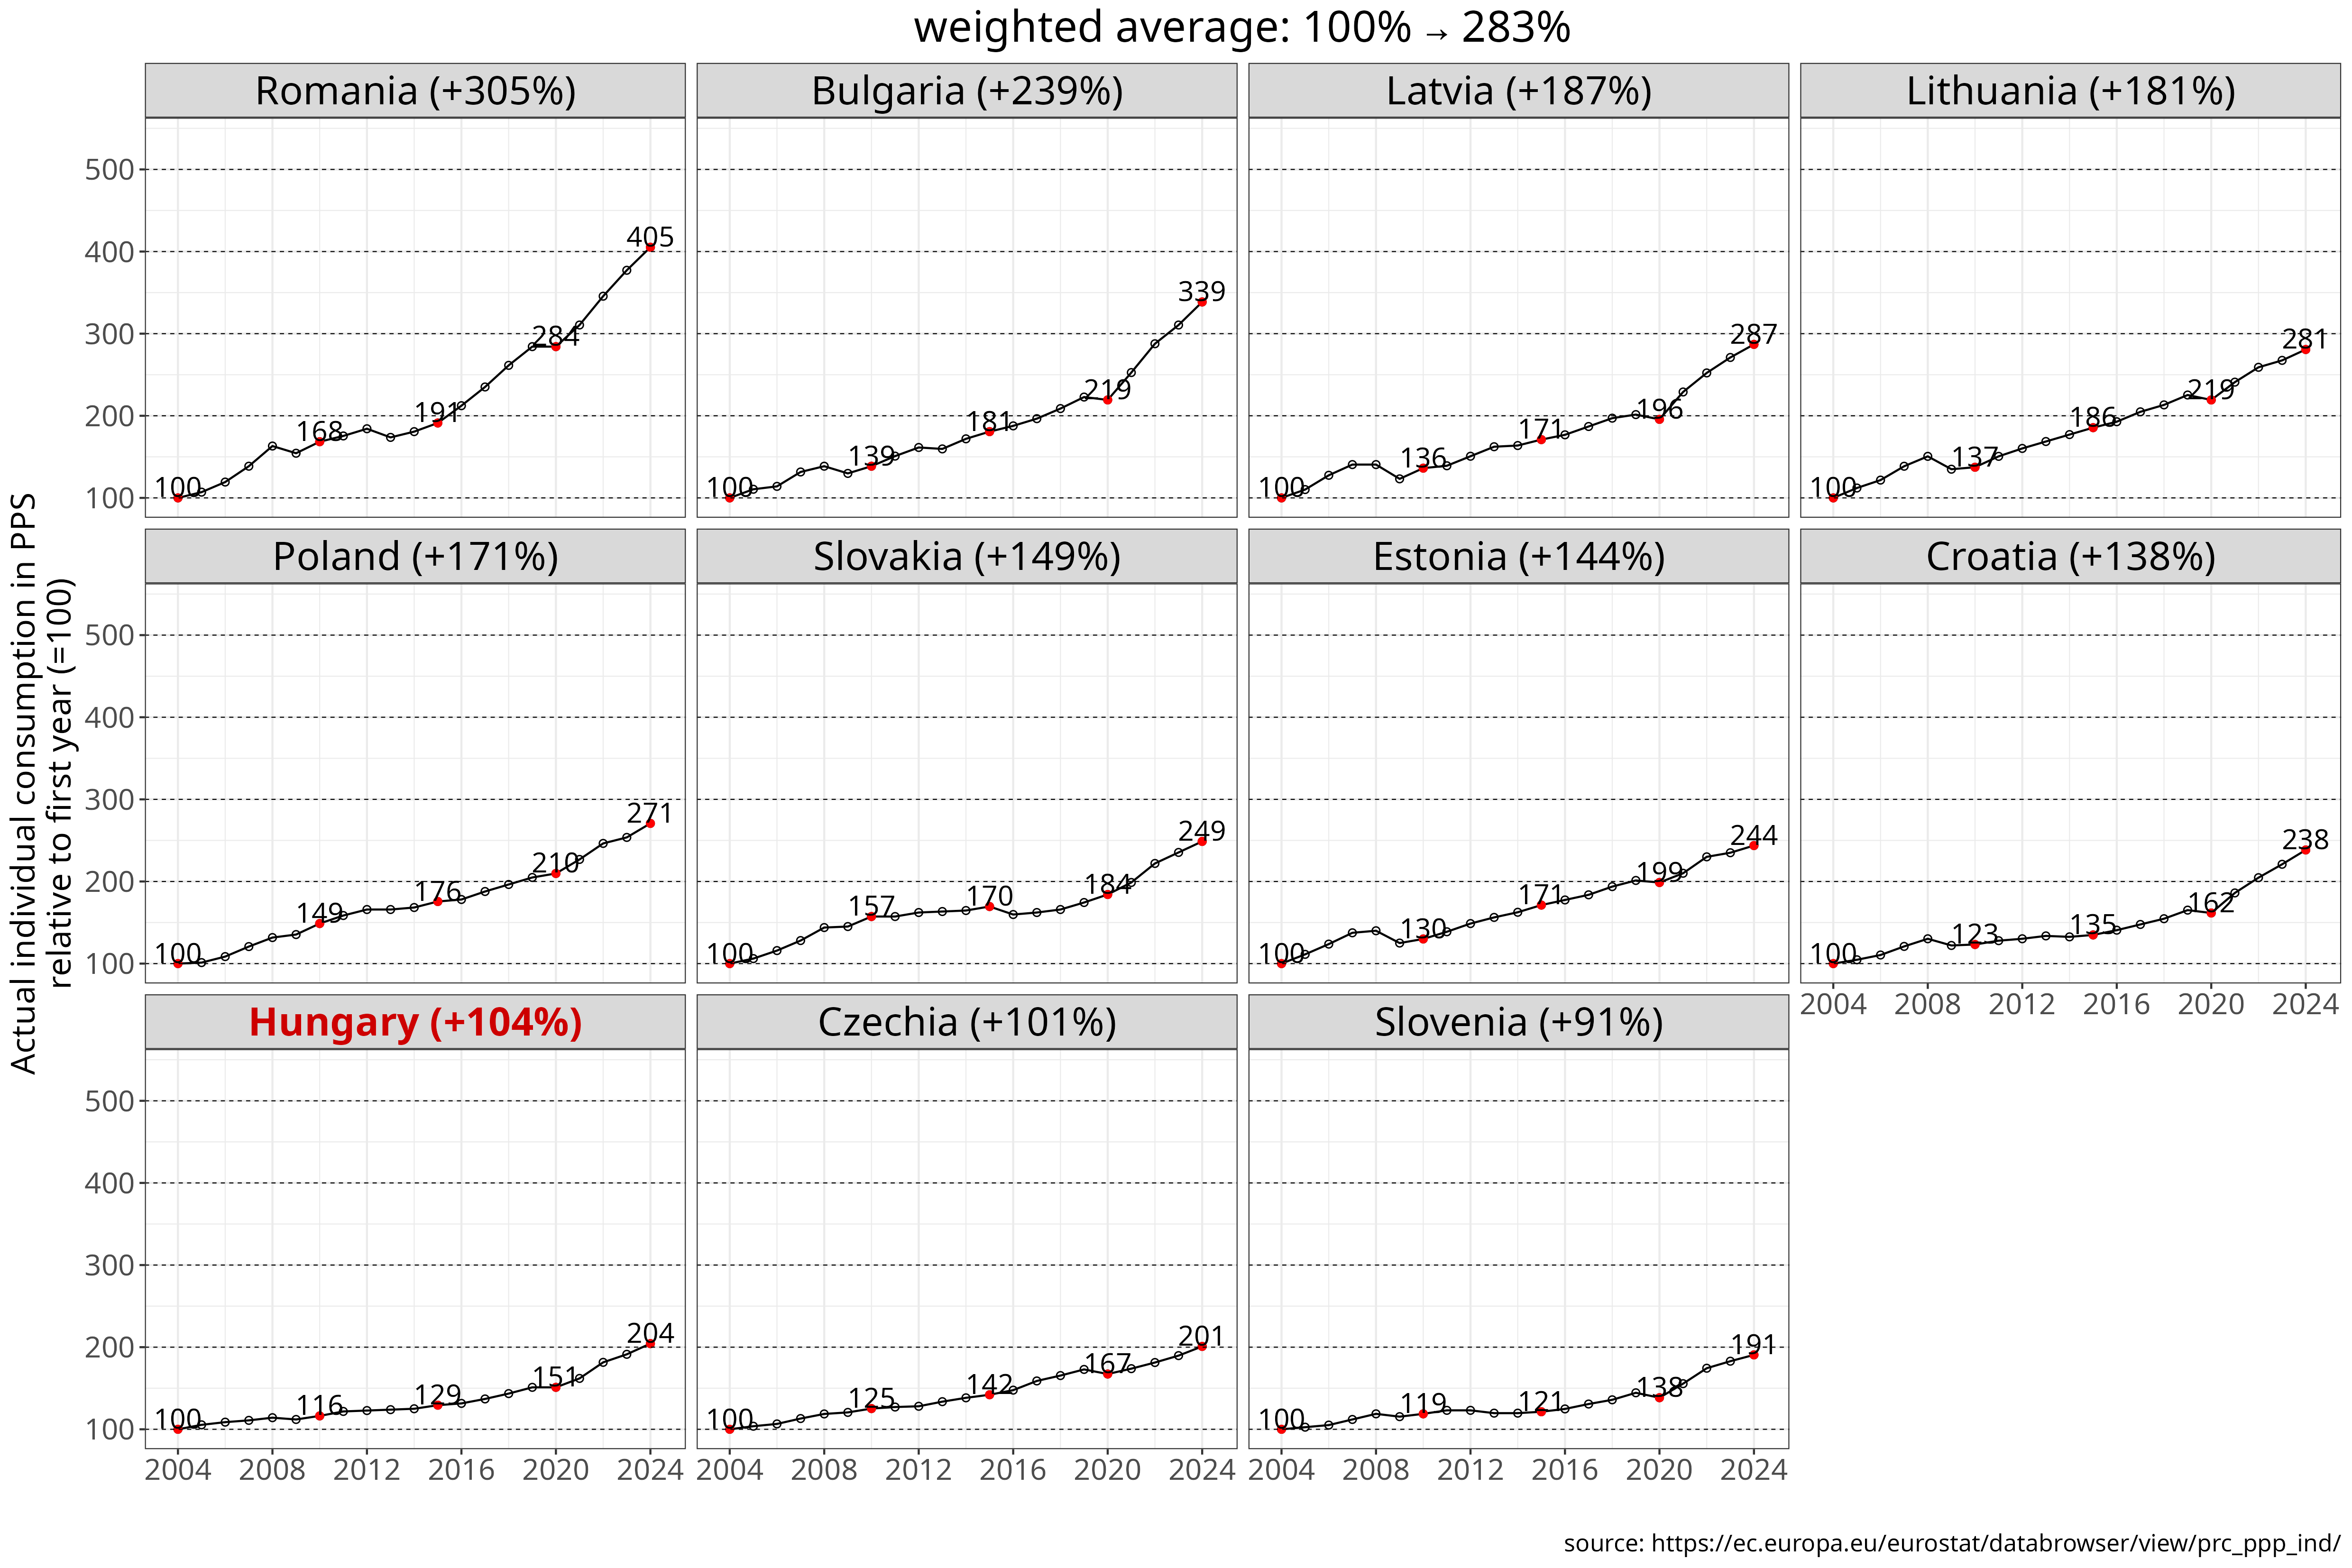
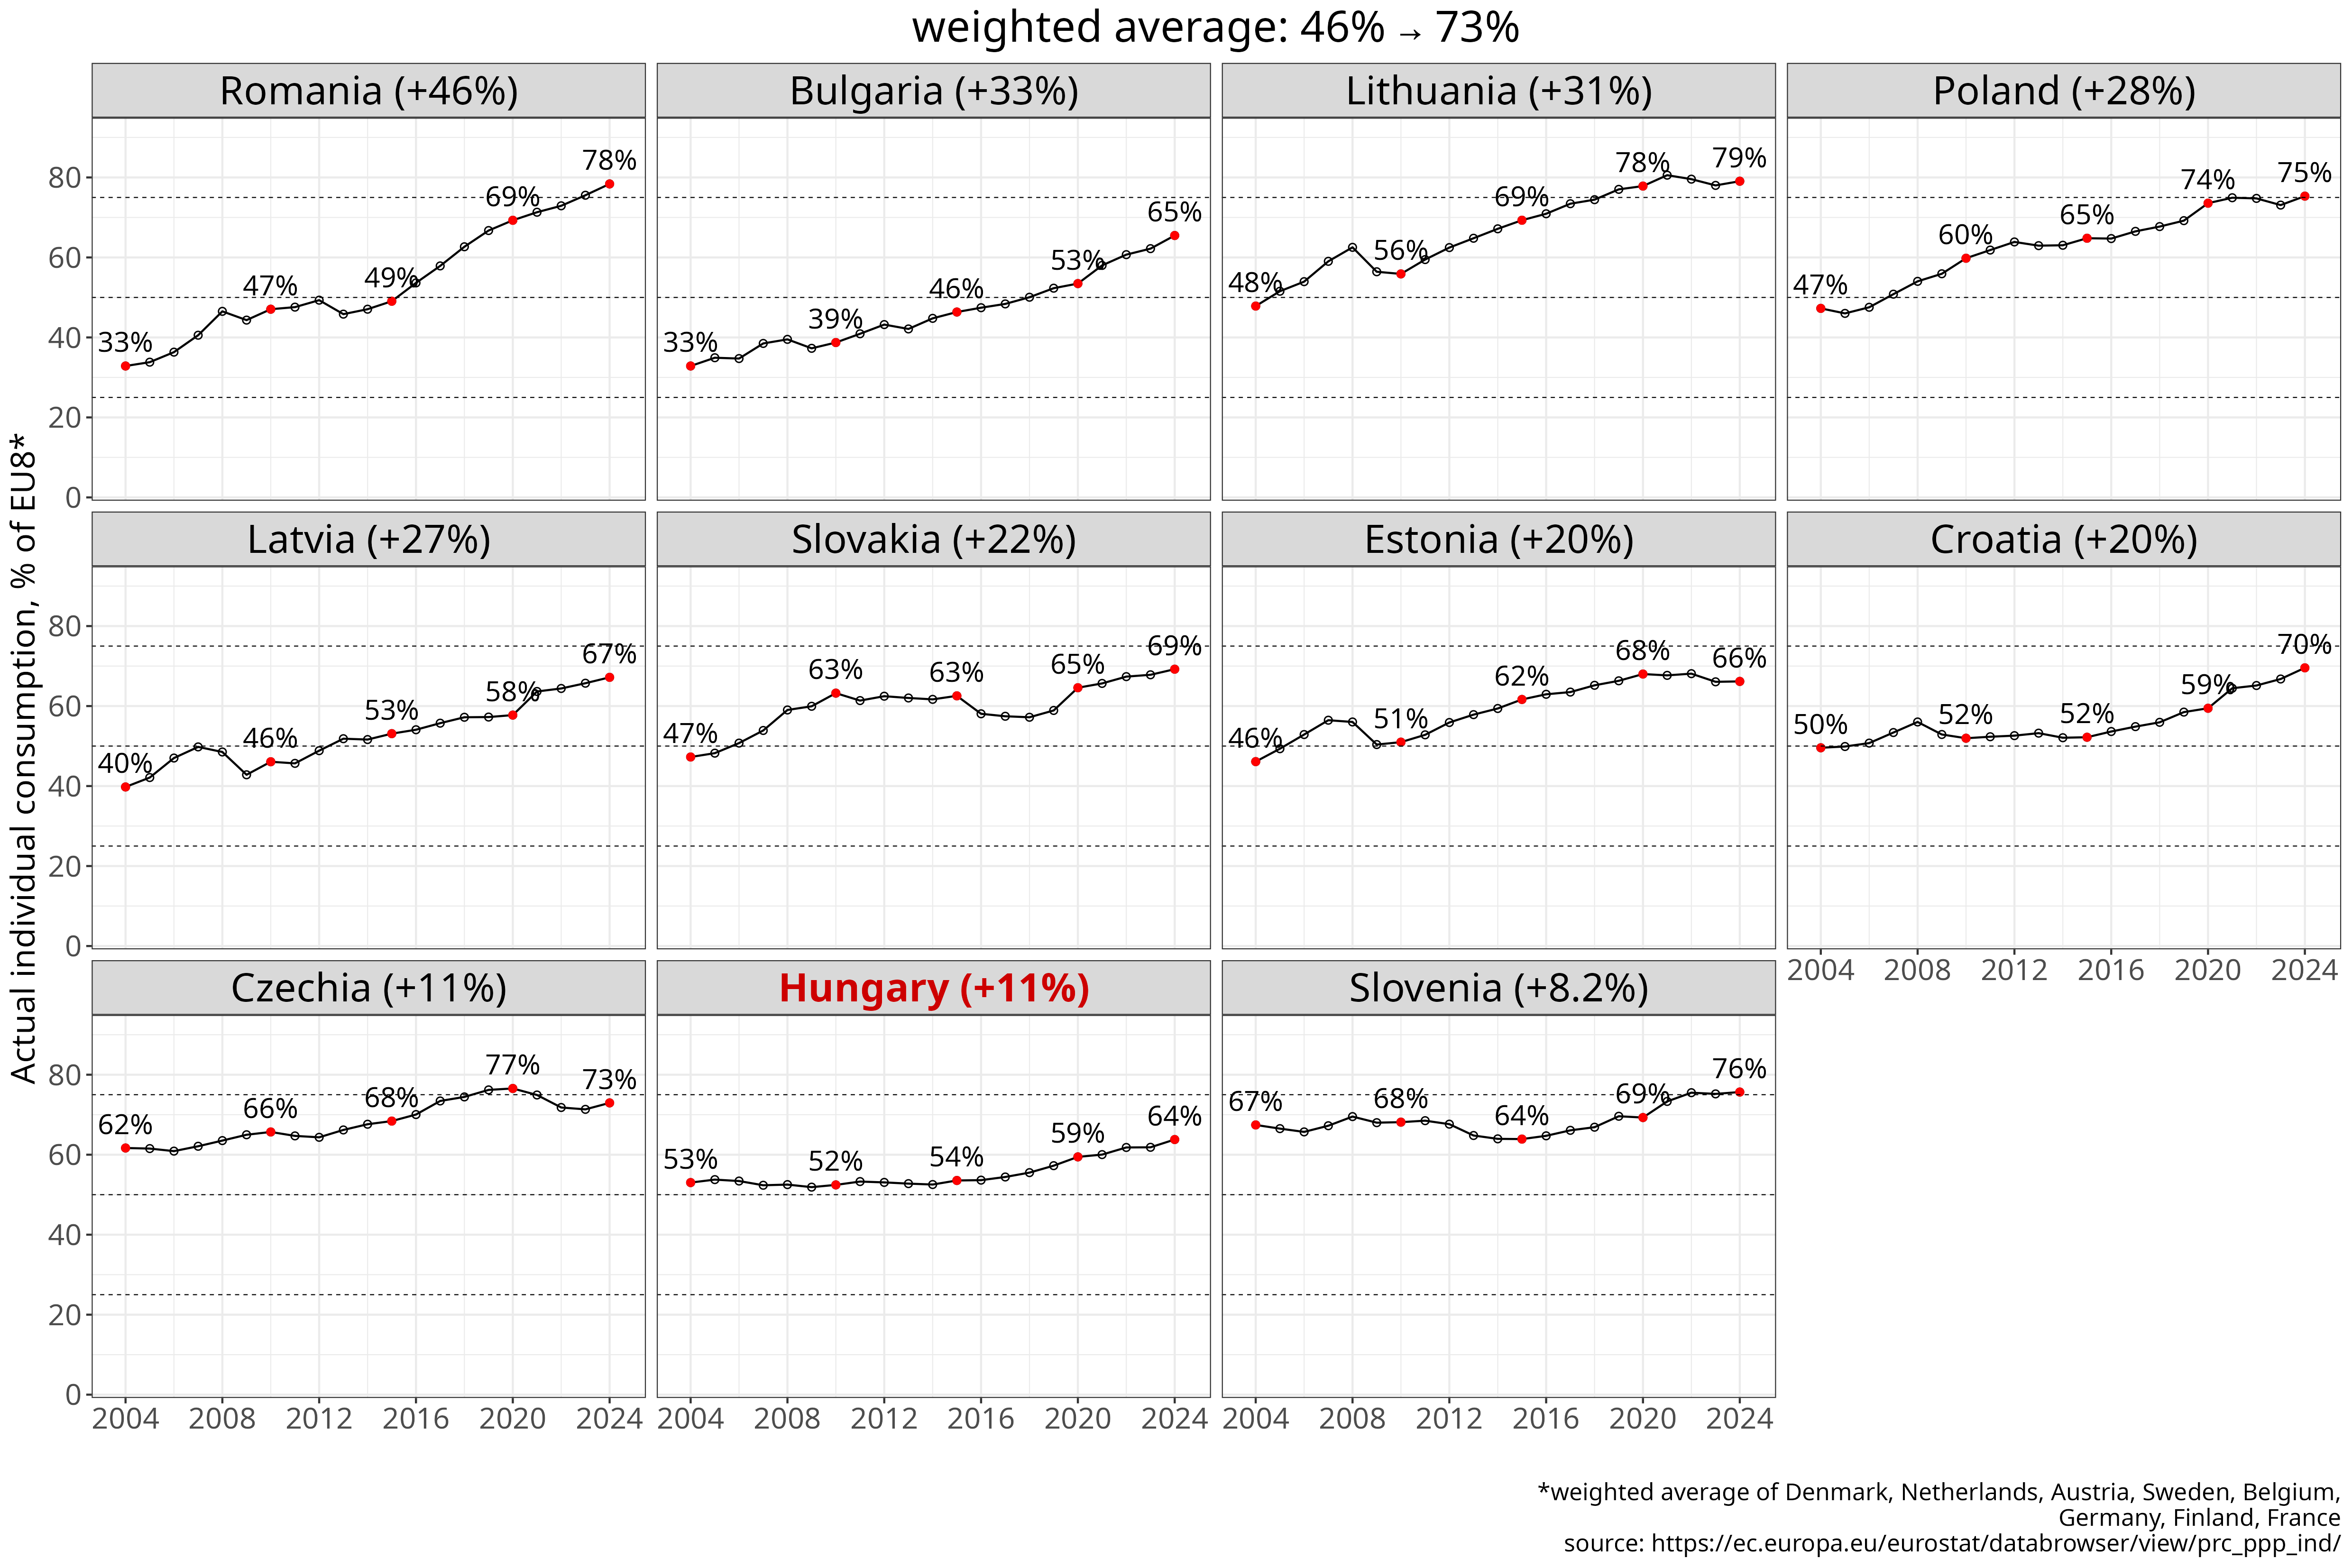
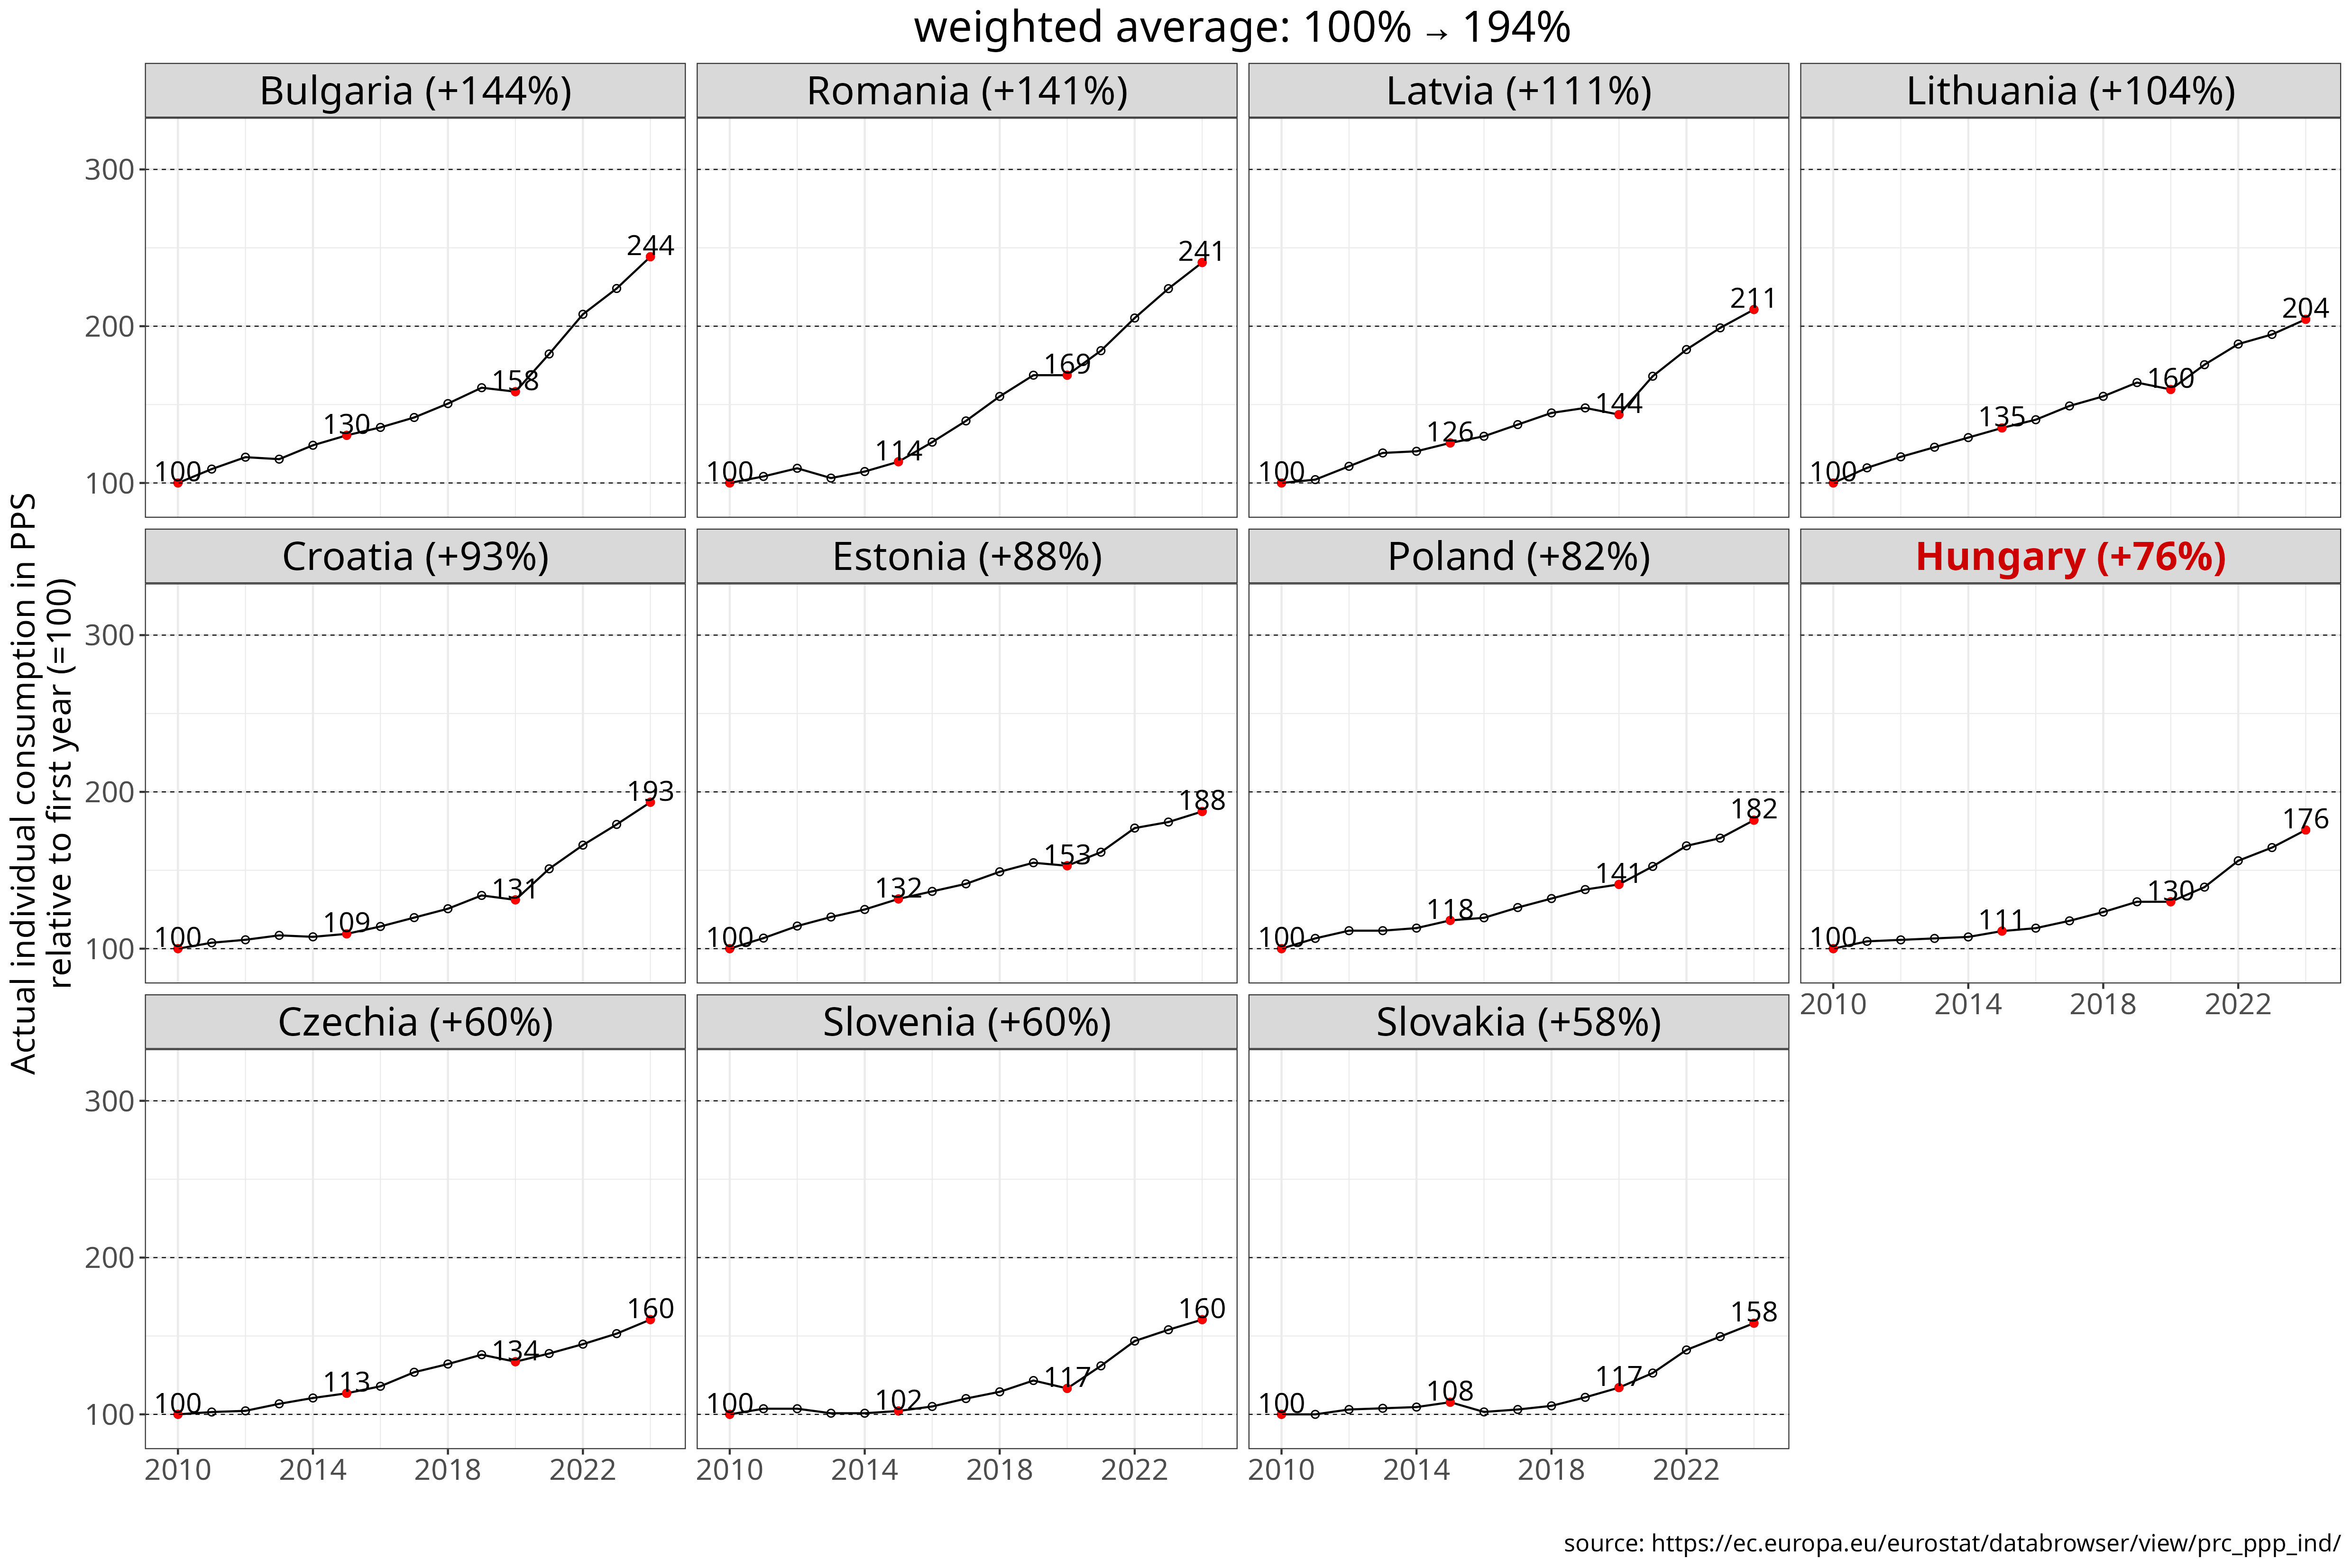
Figure 8 Actual individual consumption since 2004, measured in PPS (purchasing power standards anchored to EU-wide price changes). The chart shows levels (PPS), indexed values relative to 2004 and 2010, and percentages of the EU8 weighted average. Countries are ranked by cumulative growth from the selected base year through 2024. [download data] [source]
Hungary has experienced the second-weakest convergence in consumption levels since 2004, with AIC rising by only 9% relative to the EU-8 average over two decades. In 2024, Hungary had the lowest level of AIC in the region, at 64% of the EU-8 average. The only country with weaker convergence is Slovenia, which started from a higher baseline (67% of the EU8 average) - a level Hungary had still not reached by 2024.
In a familiar pattern, measured from a 2010 baseline, Slovakia’s convergence appears even weaker. Even from this later starting point, Hungary’s gains lagged behind all other countries except Slovakia and the two higher-baseline cases, Czechia and Slovenia.
| country | % of EU8 | relative to initial value (%) | absolute value (thousand PPS) |
|---|---|---|---|
| Romania | +46% (33→78) | +305% | +17.4k (5.7→23.1) |
| Bulgaria | +33% (33→65) | +239% | +13.6k (5.7→19.3) |
| Lithuania | +31% (48→79) | +181% | +15k (8.3→23.3) |
| Poland | +28% (47→75) | +171% | +14k (8.2→22.2) |
| Latvia | +27% (40→67) | +187% | +12.9k (6.9→19.8) |
| Slovakia | +22% (47→69) | +149% | +12.2k (8.2→20.4) |
| Croatia | +20% (50→70) | +138% | +11.9k (8.6→20.5) |
| Estonia | +20% (46→66) | +144% | +11.5k (8→19.5) |
| Czechia | +11% (62→73) | +101% | +10.8k (10.7→21.5) |
| Hungary | +11% (53→64) | +104% | +9.6k (9.2→18.8) |
| Slovenia | +8.2% (67→76) | +91% | +10.6k (11.7→22.3) |
| country | % of EU8 | relative to initial value (%) | absolute value (thousand PPS) |
|---|---|---|---|
| Romania | +31% (47→78) | +141% | +13.5k (9.6→23.1) |
| Bulgaria | +27% (39→65) | +144% | +11.4k (7.9→19.3) |
| Lithuania | +23% (56→79) | +104% | +11.9k (11.4→23.3) |
| Latvia | +21% (46→67) | +111% | +10.4k (9.4→19.8) |
| Croatia | +18% (52→70) | +93% | +9.9k (10.6→20.5) |
| Poland | +16% (60→75) | +82% | +10k (12.2→22.2) |
| Estonia | +15% (51→66) | +87% | +9.1k (10.4→19.5) |
| Hungary | +11% (52→64) | +76% | +8.1k (10.7→18.8) |
| Czechia | +7.3% (66→73) | +60% | +8.1k (13.4→21.5) |
| Slovenia | +7.5% (68→76) | +60% | +8.4k (13.9→22.3) |
| Slovakia | +6% (63→69) | +58% | +7.5k (12.9→20.4) |
Table 8: Cumulative change in actual individual consumption from 2004 or 2010 to 2024, shown as a percentage of the EU8 weighted average, relative to the initial year, and in absolute terms (purchasing power standards,PPP). Countries are ranked by the EU8-relative measure.
Employment ratio
The employment-to-population ratio measures the share of the population aged 15 and over that is in employment. Among countries with broadly similar age structures, as is the case in the CEE region, a low employment ratio can be a sign of structural unemployment (or underemployment) that is not fully captured by official unemployment statistics. It should also be noted that in countries with high emigration rates there is considerable uncertainty about the number of workers actually residing in the country, and therefore about both the numerator and denominator of the employment ratio. For this reason, these figures should not be interpreted as exact.
In the mid-2000s, many CEE countries had a relatively low employment ratio compared with Western Europe, in particular with the most advanced EU8 countries such as Germany, Austria and the Nordic states. This was likely a legacy of the transition crisis of the 1990s, which led to the closure of uncompetitive industries and the permanent exit of large segments of the labour force from employment. Many of these workers did not appear in unemployment statistics, for example because they entered early retirement schemes, or other forms of labour market exit (which probably included informal employment too) as a way of coping with long-term joblessness.
In 2004, the average employment ratio across the CEE region was around 45%, compared with roughly 55-60% in the EU8. As Figure 8 shows, this gap was closed over the following decade and a half. By the late 2010s, most CEE countries had reached employment ratios comparable to the EU8 average, with the exceptions of Croatia and Romania. Overall, employment ratios in the region rose into the 55-60% range of the 15+ population, broadly in line with Western European levels.
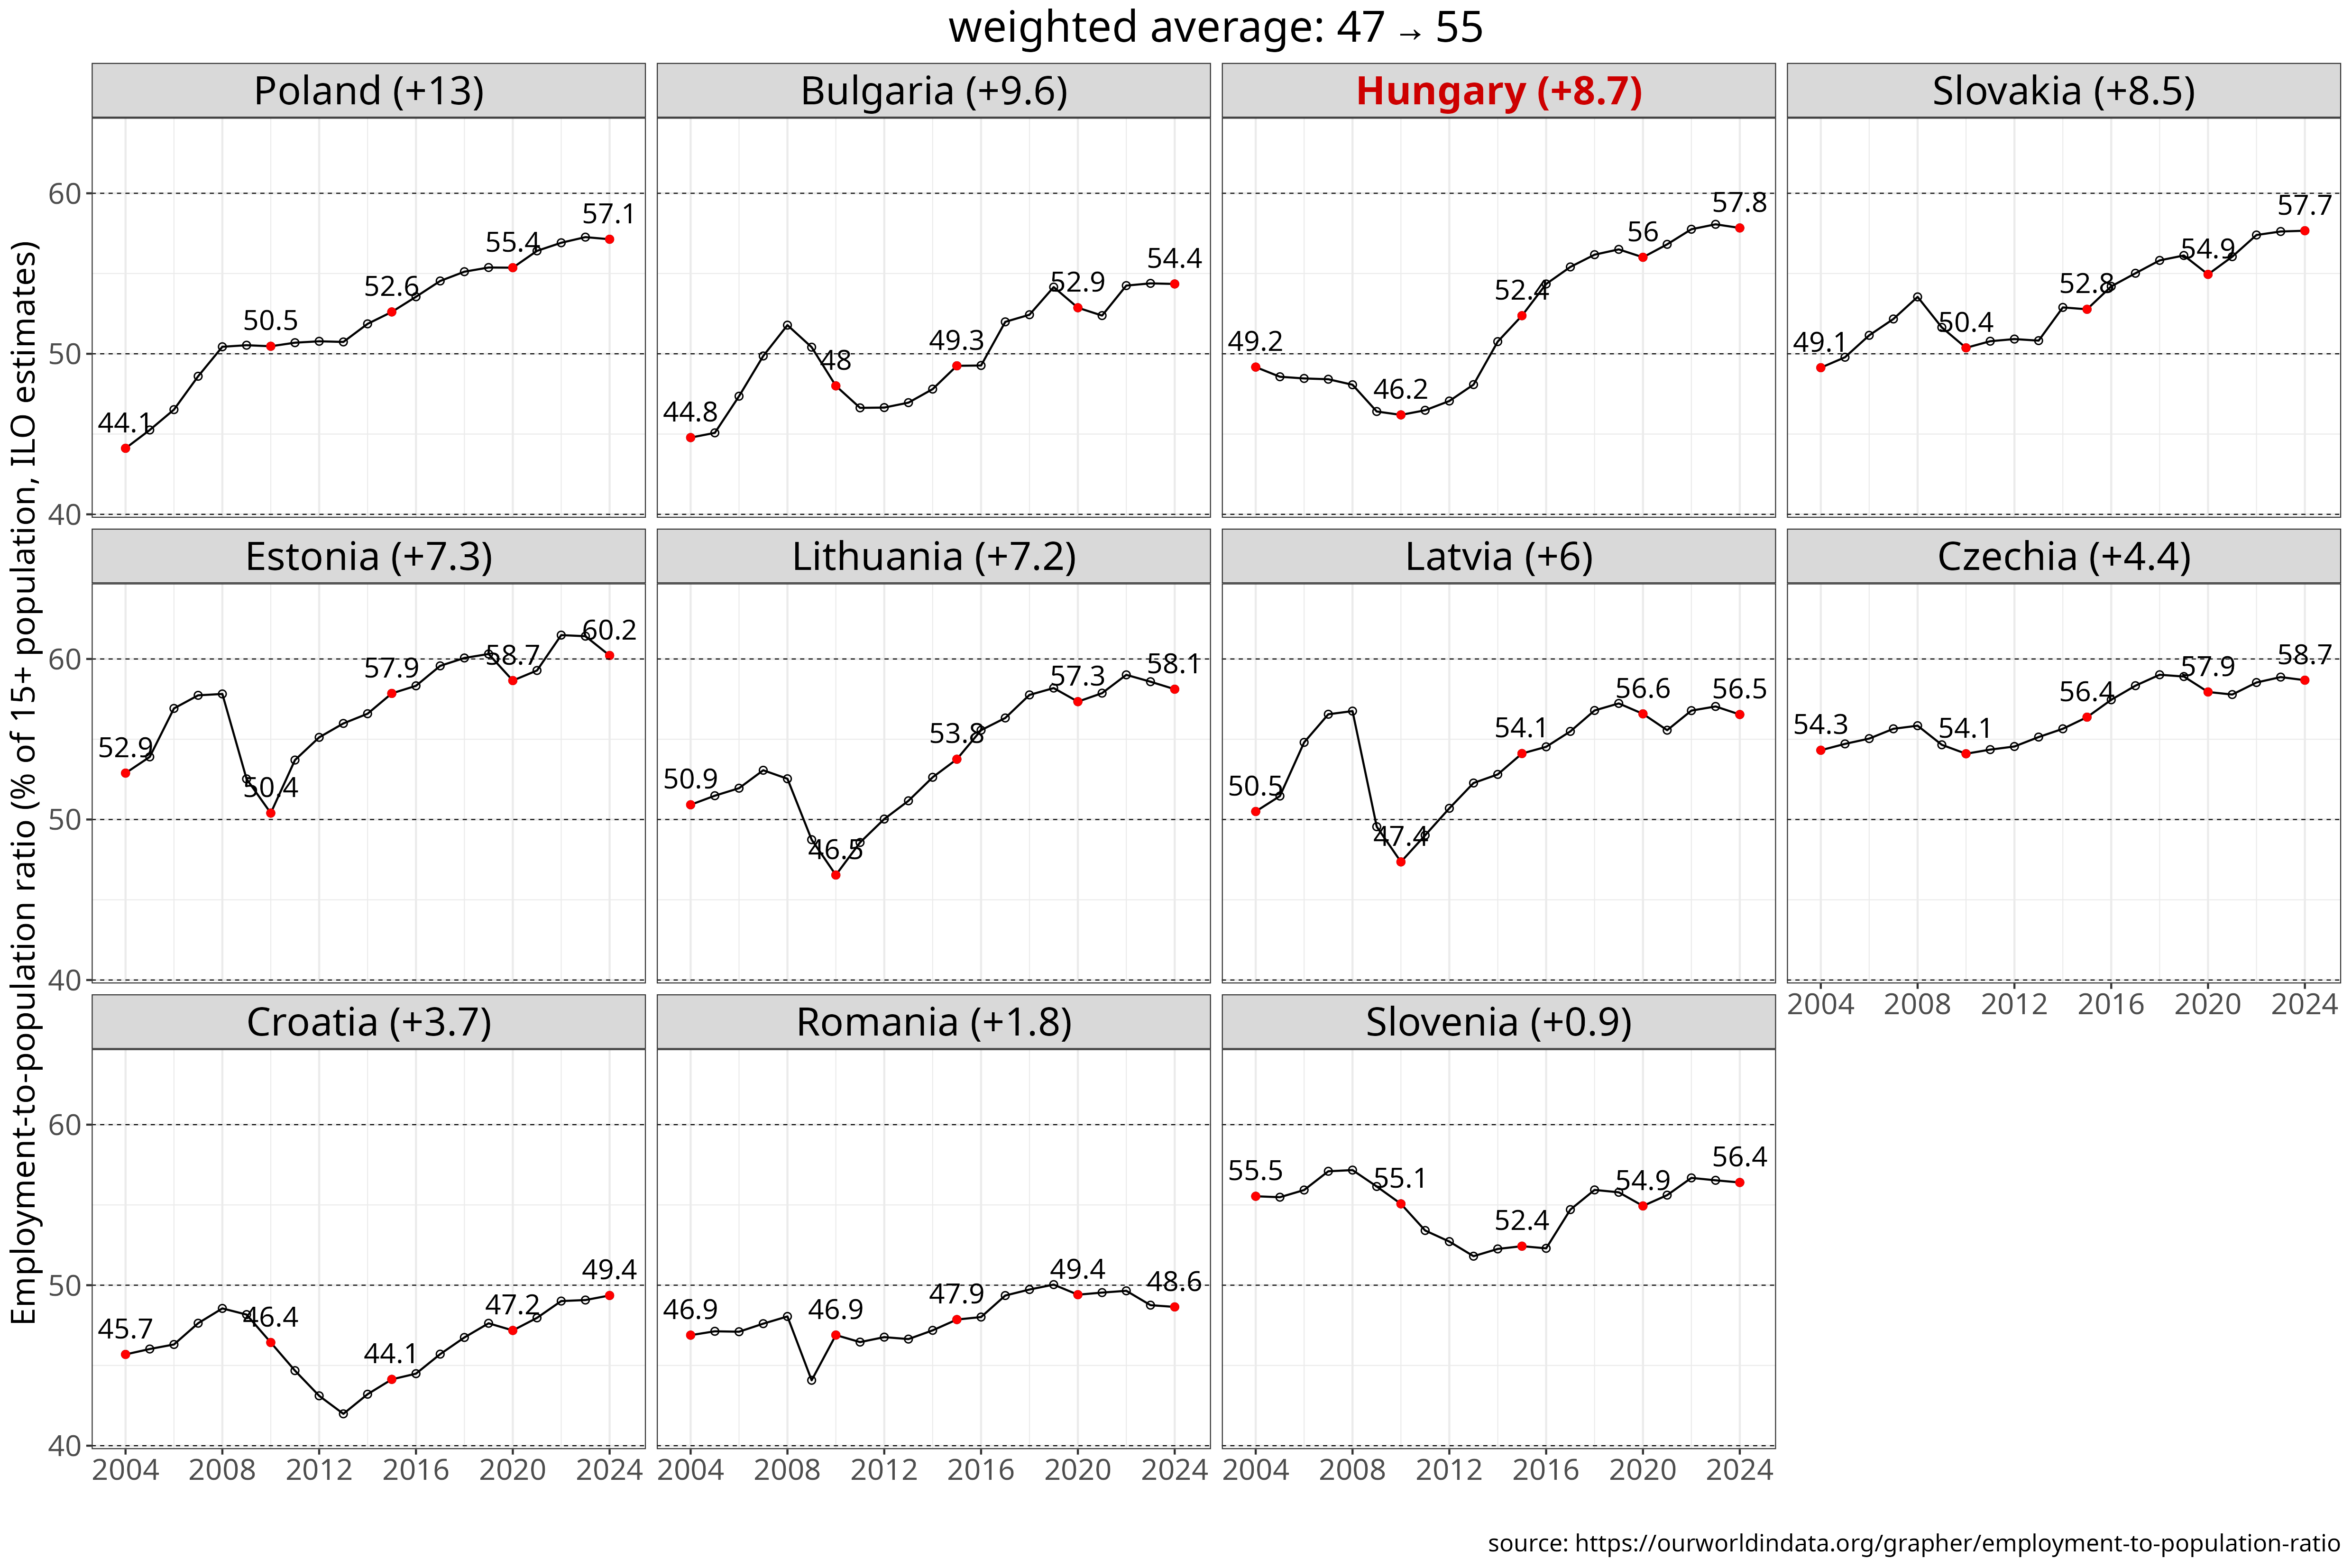
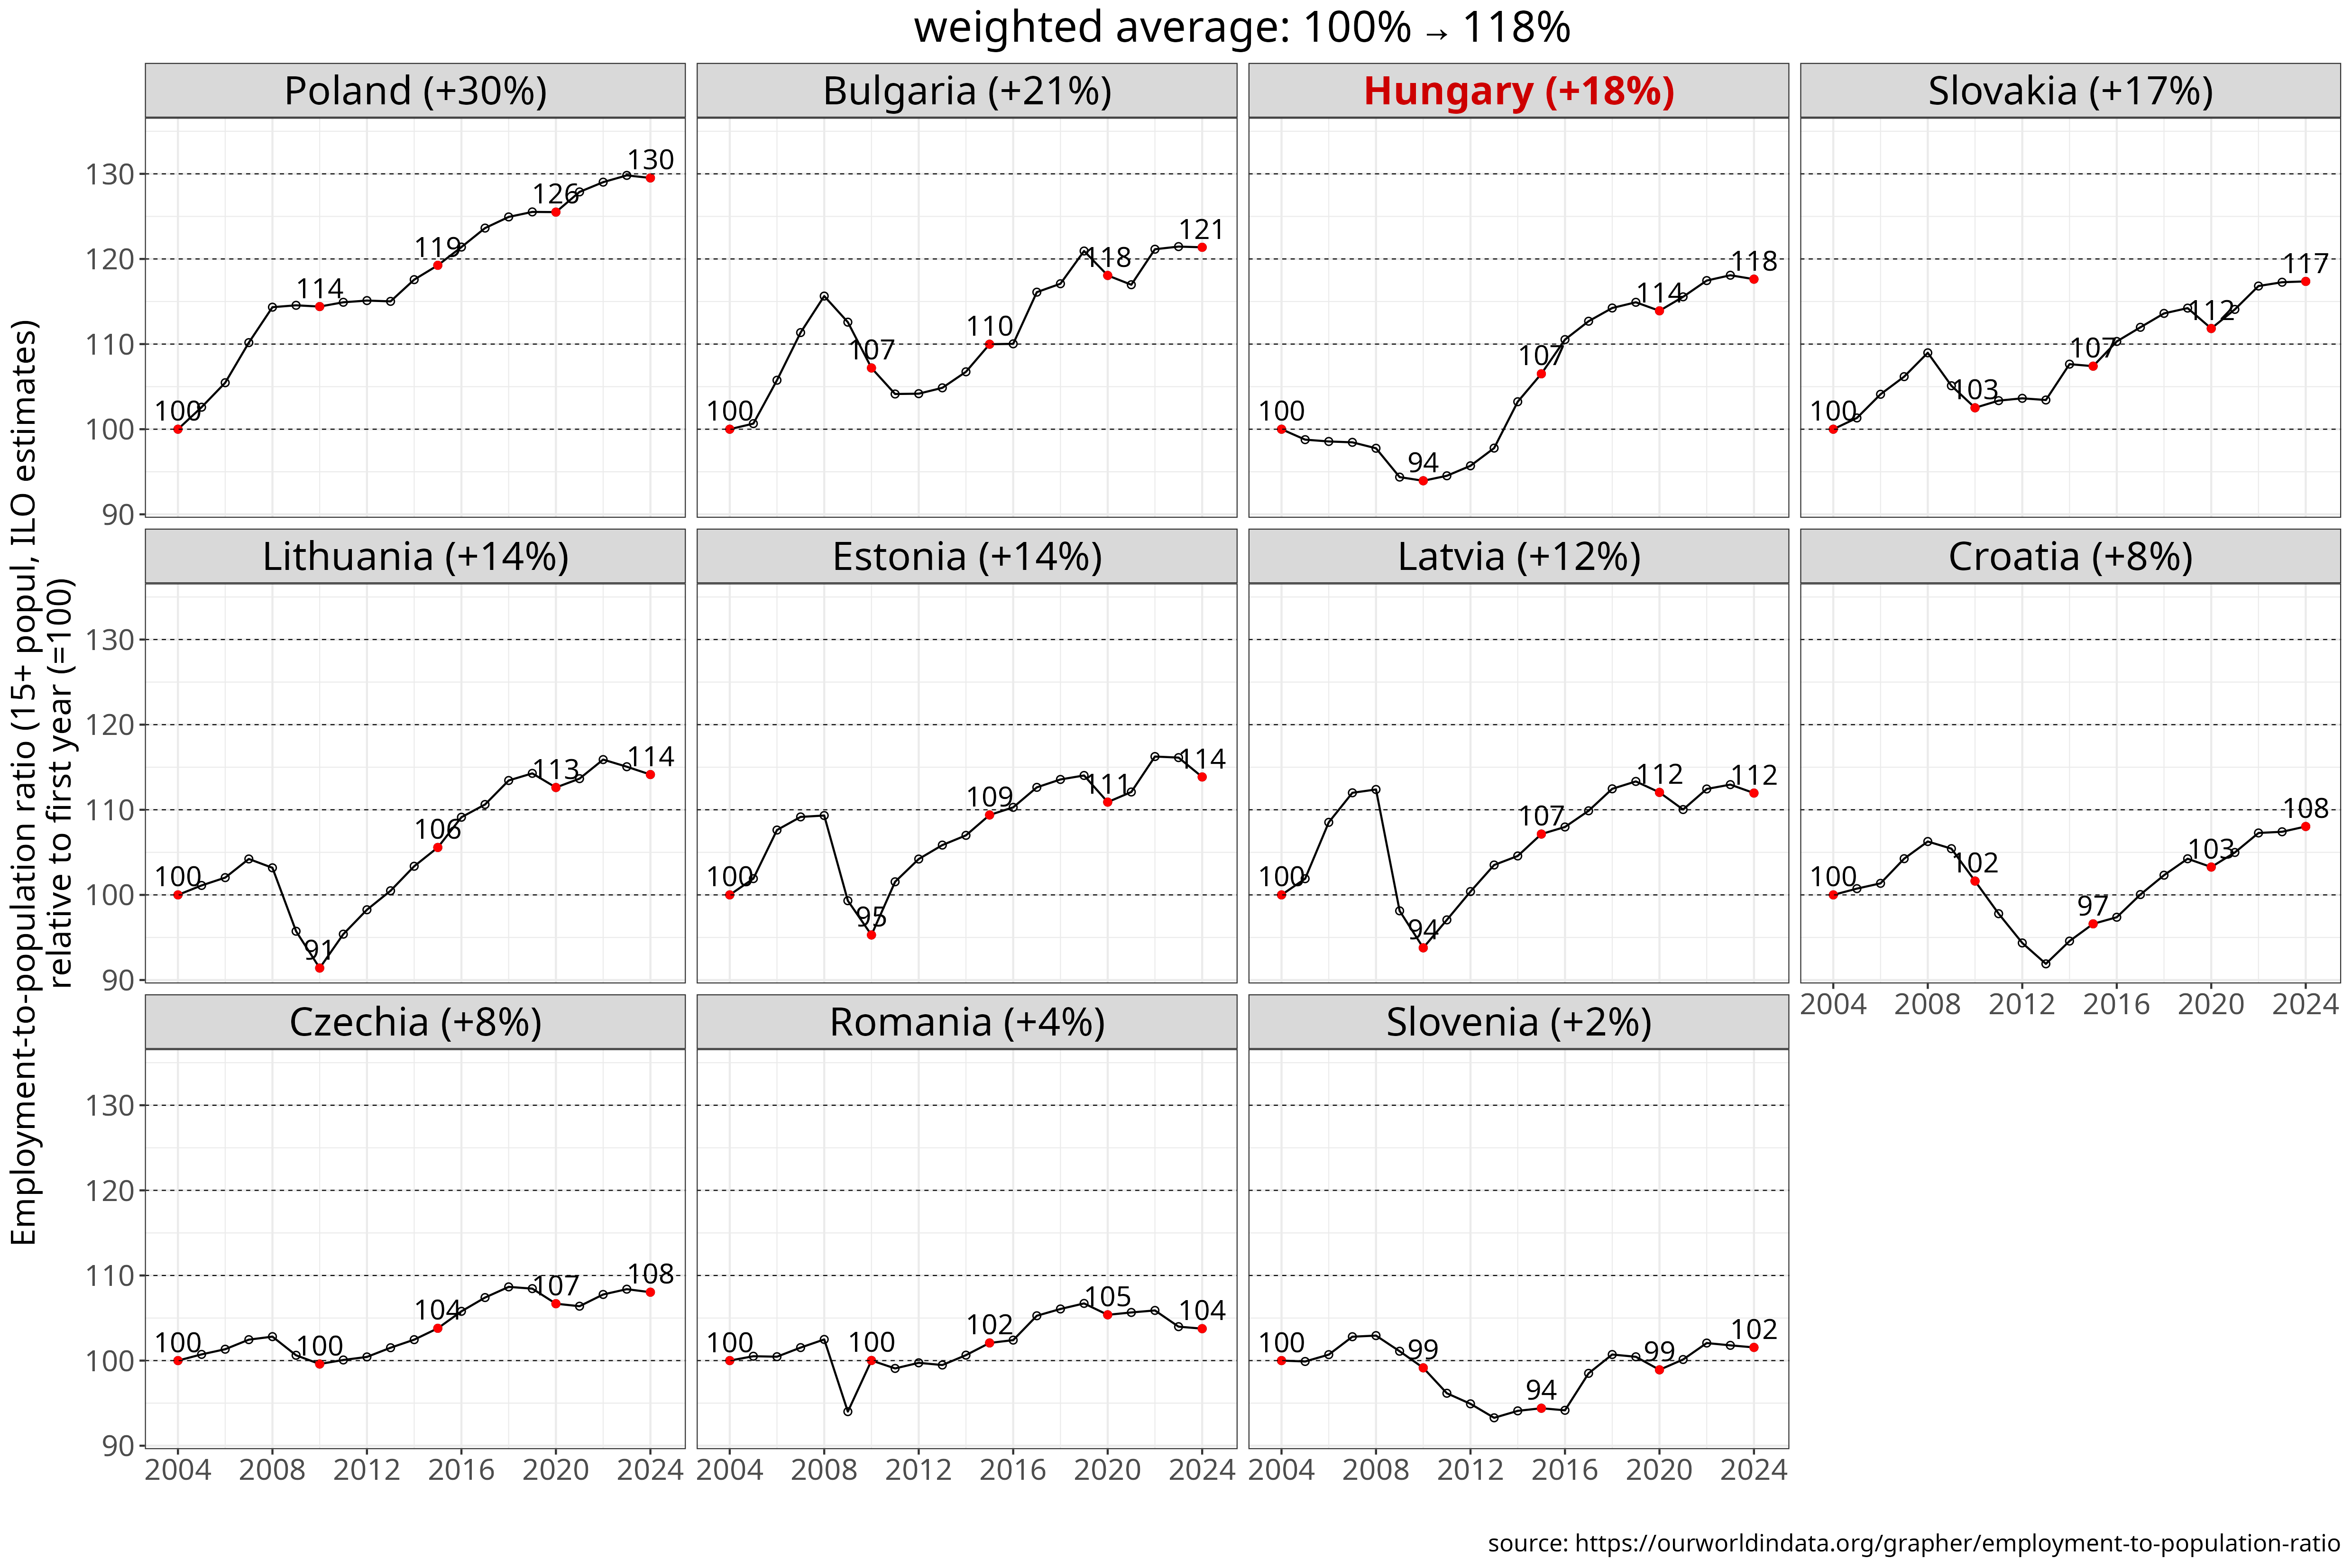
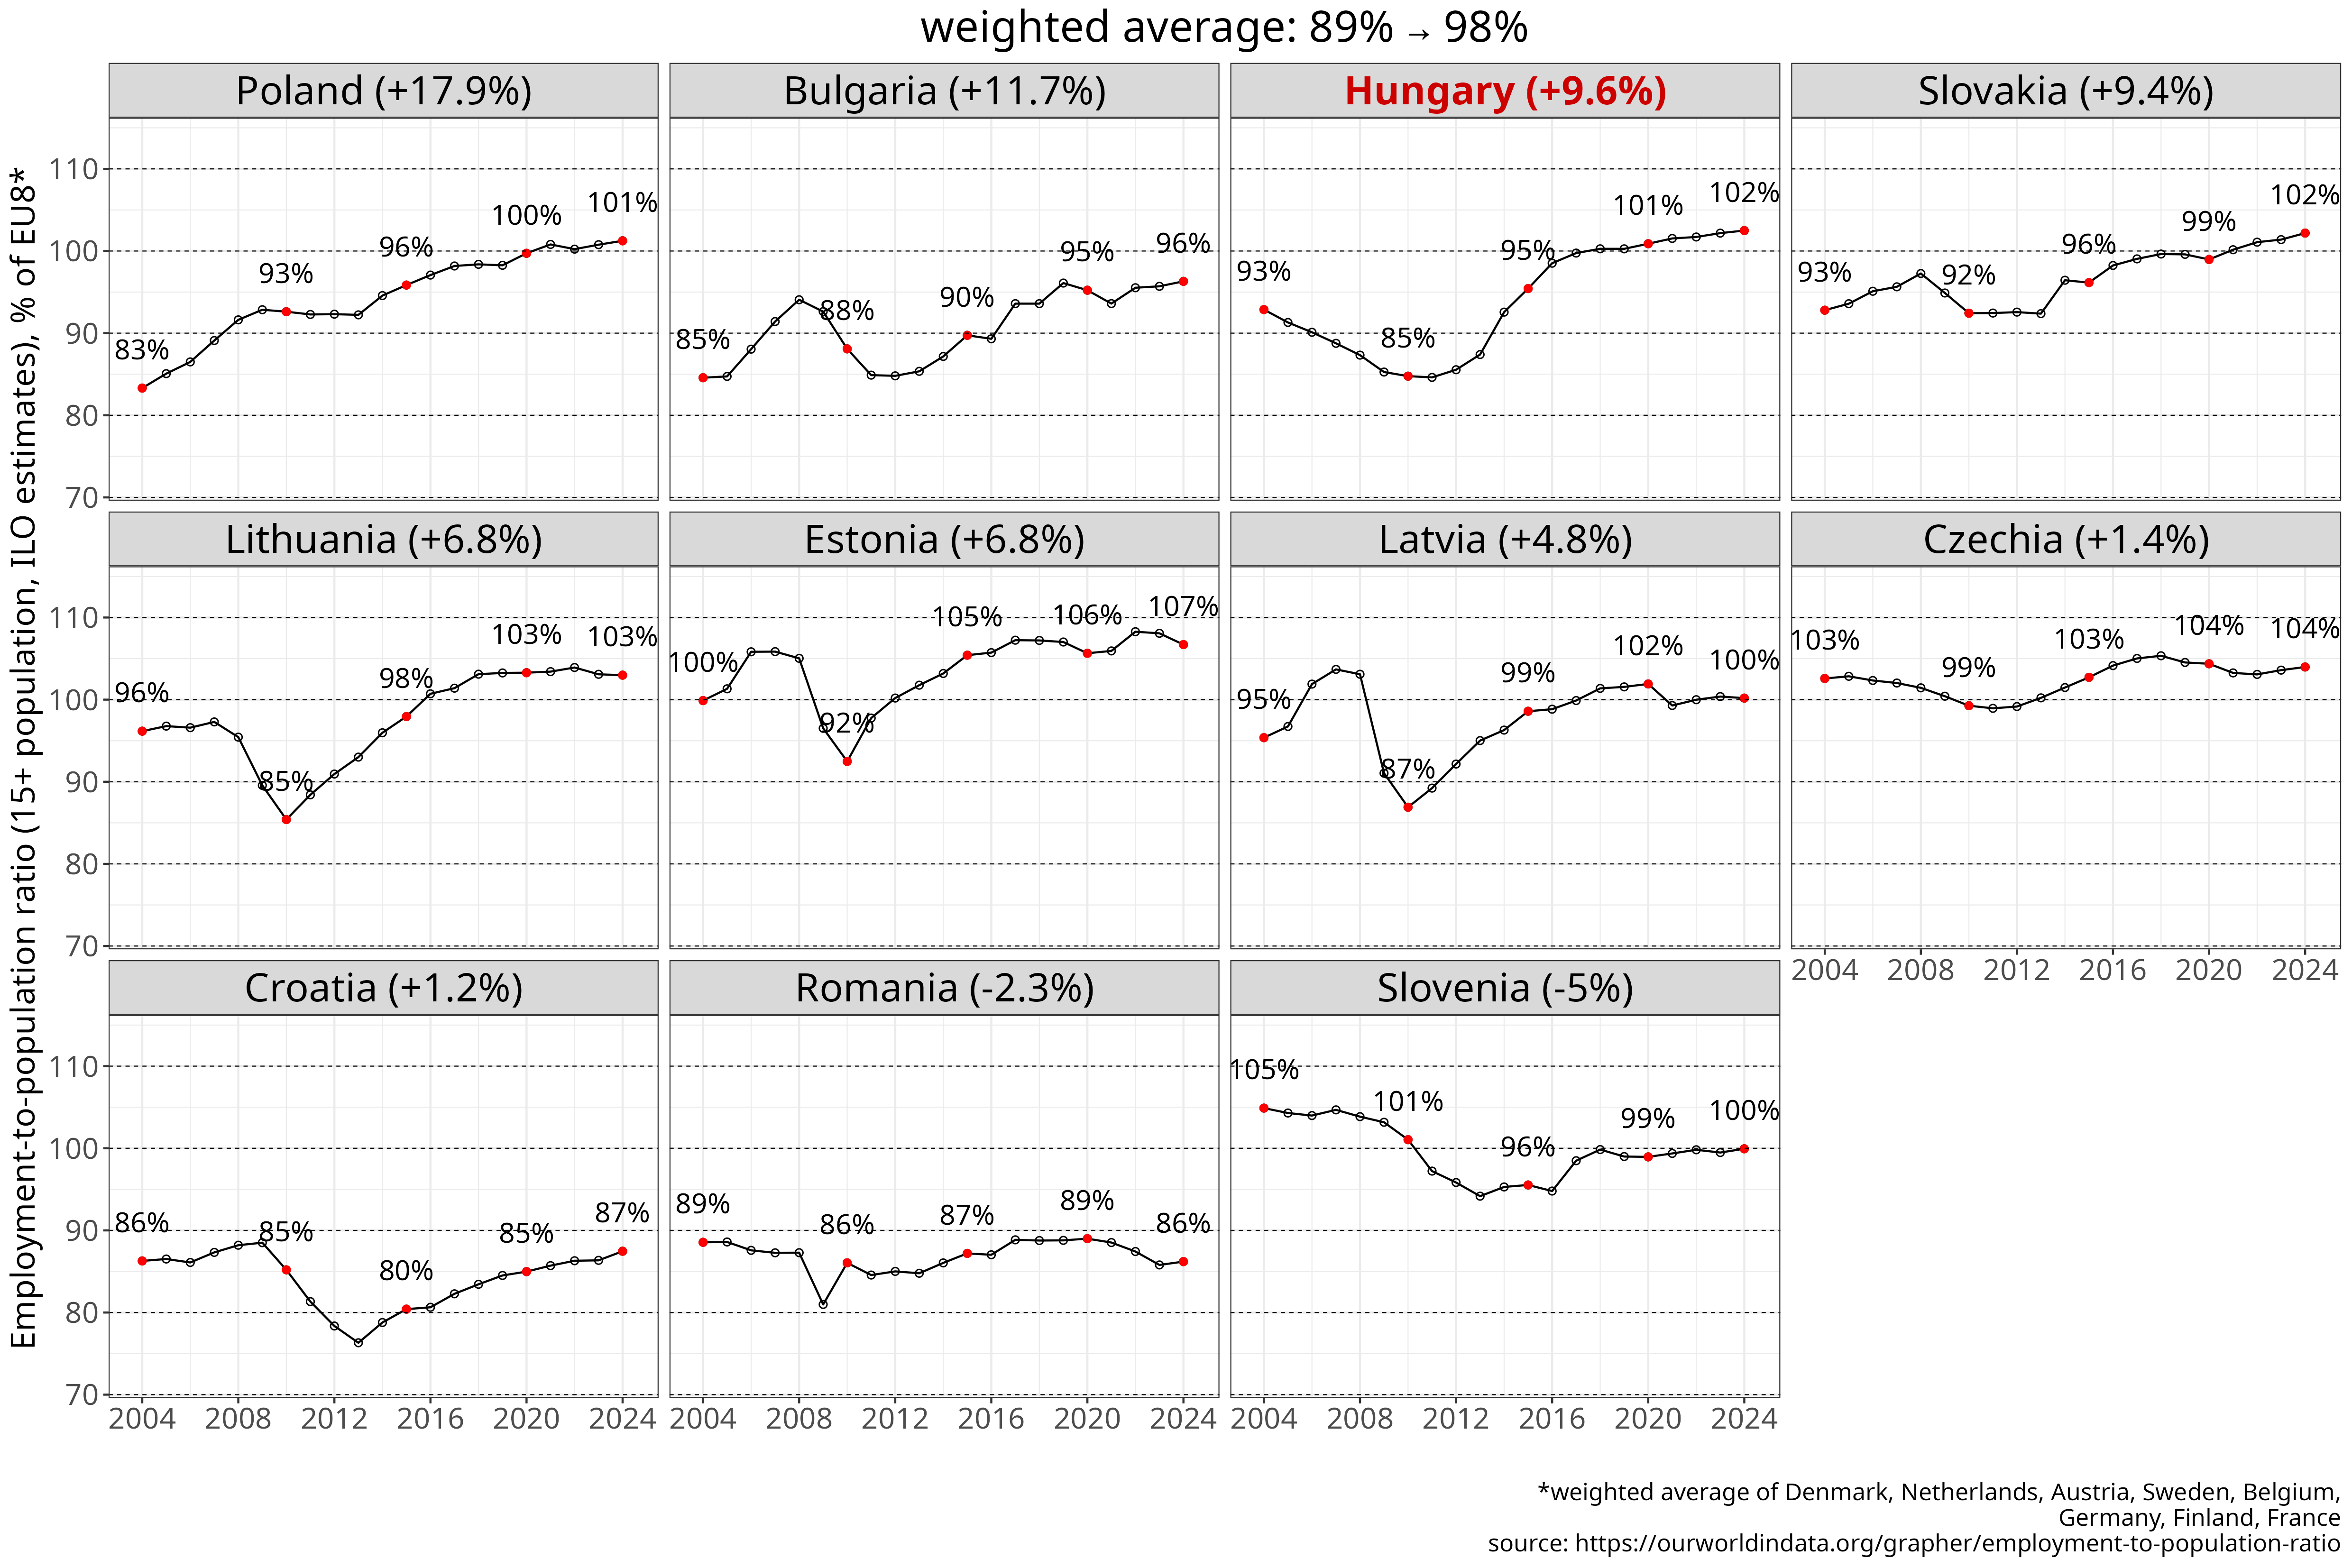
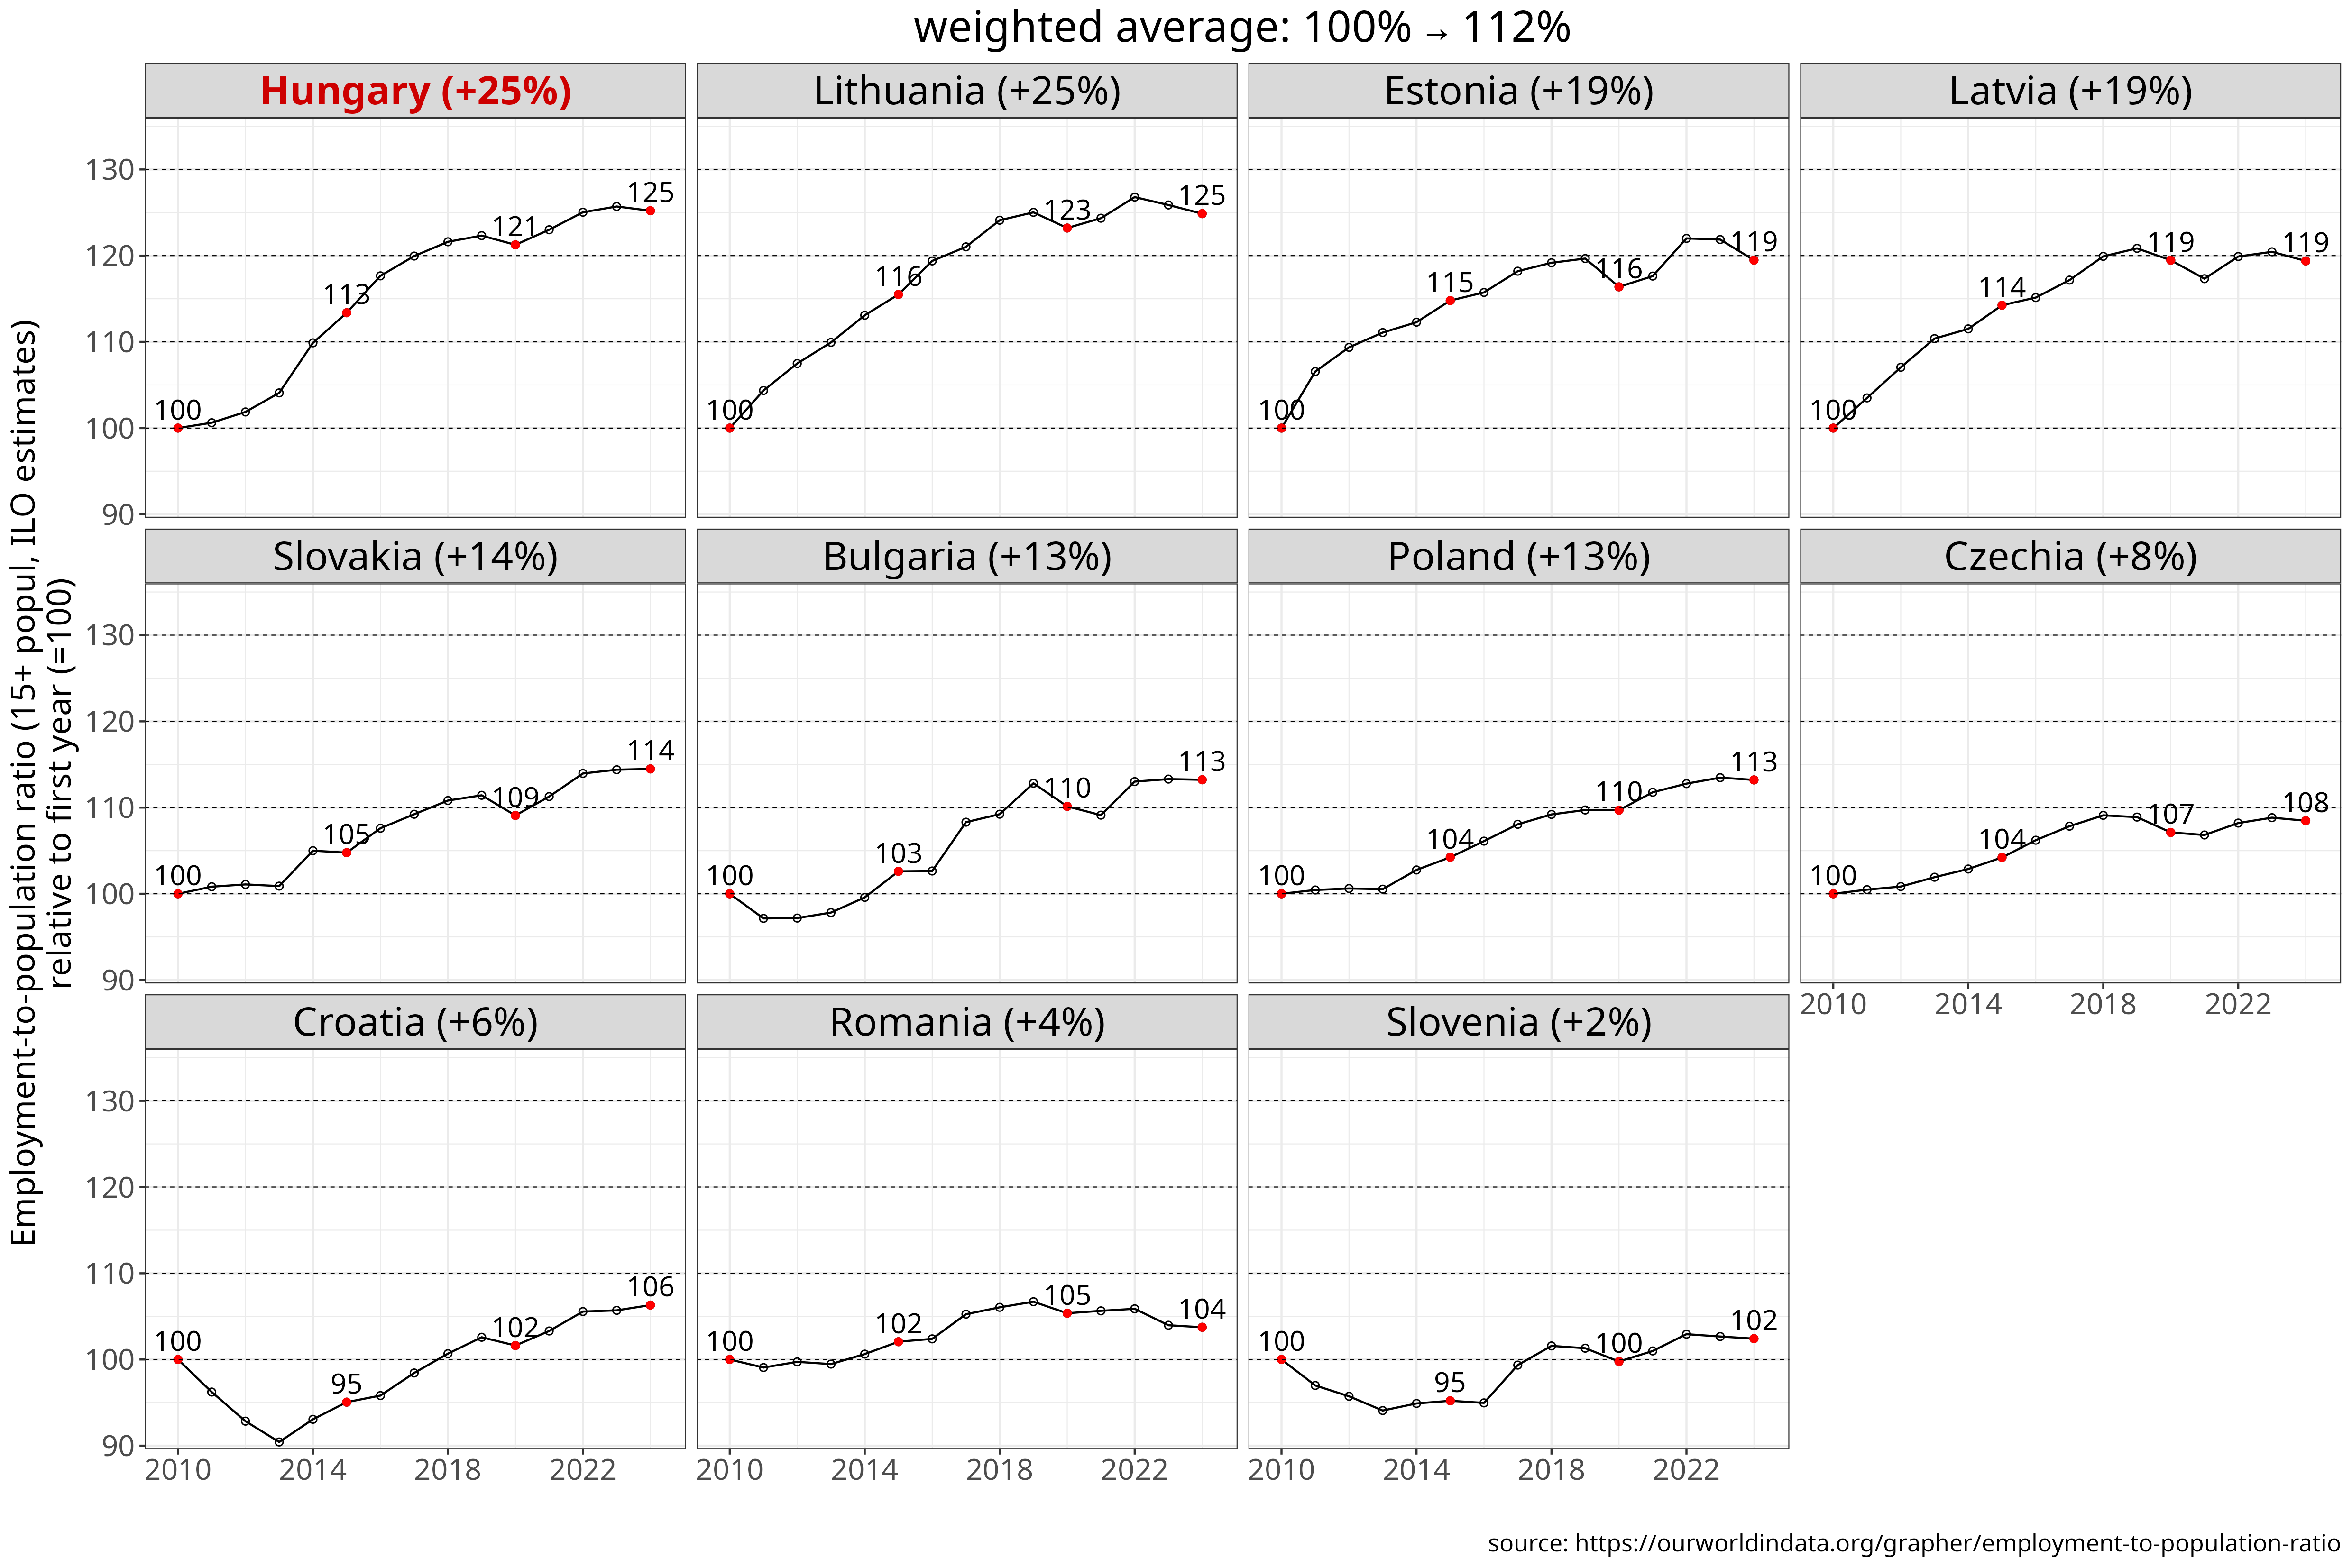
Figure 9 Employment ratio (% of 15+ population) since 2004. The chart shows levels (% of 15+ population), indexed values relative to 2004 and 2010, and percentages of the EU8 weighted average. Countries are ranked by cumulative growth from the selected base year through 2024. [download data] [source]
In this indicator, Hungary is in line with the region and even slightly stands out positively. Measured from 2004, its increase in the employment ratio is the third largest; from 2010, it is - tied with Lithuania - the largest. This partly reflects a baseline effect: the employment ratio in both countries actually fell between 2004 and 2010, which was rather the exception in the region. The subsequent rise in Hungary’s employment ratio aligns with broader regional trends and neither the cumulative increase, nor the level achieved by 2024 are outliers. The unusual feature is how low the ratio was in 2010.
| country | absolute value (% of 15+ popul.) | % of EU8 | relative to initial value (%) |
|---|---|---|---|
| Poland | +13% (44.1→57.1) | +18% (83→100) | +30% |
| Bulgaria | +9.6% (44.8→54.4) | +12% (85→96) | +21% |
| Hungary | +8.7% (49.2→57.8) | +9.6% (93→100) | +18% |
| Slovakia | +8.5% (49.1→57.7) | +9.4% (93→100) | +17% |
| Estonia | +7.3% (52.9→60.2) | +6.8% (100→110) | +14% |
| Lithuania | +7.2% (50.9→58.1) | +6.8% (96→100) | +14% |
| Latvia | +6% (50.5→56.5) | +4.8% (95→100) | +12% |
| Czechia | +4.4% (54.3→58.7) | +1.4% (100→100) | +8% |
| Croatia | +3.7% (45.7→49.4) | +1.2% (86→87) | +8% |
| Romania | +1.8% (46.9→48.6) | -2.3% (89→86) | +4% |
| Slovenia | +0.9% (55.5→56.4) | -5% (100→100) | +2% |
| country | absolute value (% of 15+ popul.) | % of EU8 | relative to initial value (%) |
|---|---|---|---|
| Hungary | +11.6% (46.2→57.8) | +18% (85→100) | +25% |
| Lithuania | +11.6% (46.5→58.1) | +18% (85→100) | +25% |
| Estonia | +9.8% (50.4→60.2) | +14% (92→110) | +19% |
| Latvia | +9.2% (47.4→56.5) | +13% (87→100) | +19% |
| Slovakia | +7.3% (50.4→57.7) | +9.8% (92→100) | +14% |
| Poland | +6.7% (50.5→57.1) | +8.6% (93→100) | +13% |
| Bulgaria | +6.3% (48→54.4) | +8.2% (88→96) | +13% |
| Czechia | +4.6% (54.1→58.7) | +4.7% (99→100) | +8% |
| Croatia | +2.9% (46.4→49.4) | +2.3% (85→87) | +6% |
| Romania | +1.8% (46.9→48.6) | +0.15% (86→86) | +4% |
| Slovenia | +1.3% (55.1→56.4) | -1.1% (100→100) | +2% |
Table 9: Cumulative change in employment ratio (% of 15+ population) from 2004 or 2010 to 2024, shown as a percentage of the EU8 weighted average, relative to the initial year, and as a % of 15+ population. Countries are ranked by the EU8-relative measure.
Life expectancy
Period life expectancy represents the expected length of life based on current age-specific mortality rates. In the CEE region, this metric had already showed significant increases from the early 1990s to 2004, following roughly 25 years of stagnation prior to 1990.
From 2004 to 2024 convergence continued, but at a slower pace, as life expectancy across the CEE region rose by about 4 years, reaching an average of 78 years, or roughly 95% of the EU8 average. Slovenia reached full parity with Western Europe, while Romania, Bulgaria, and Lithuania remain at the lower end, around 92% of the EU level.
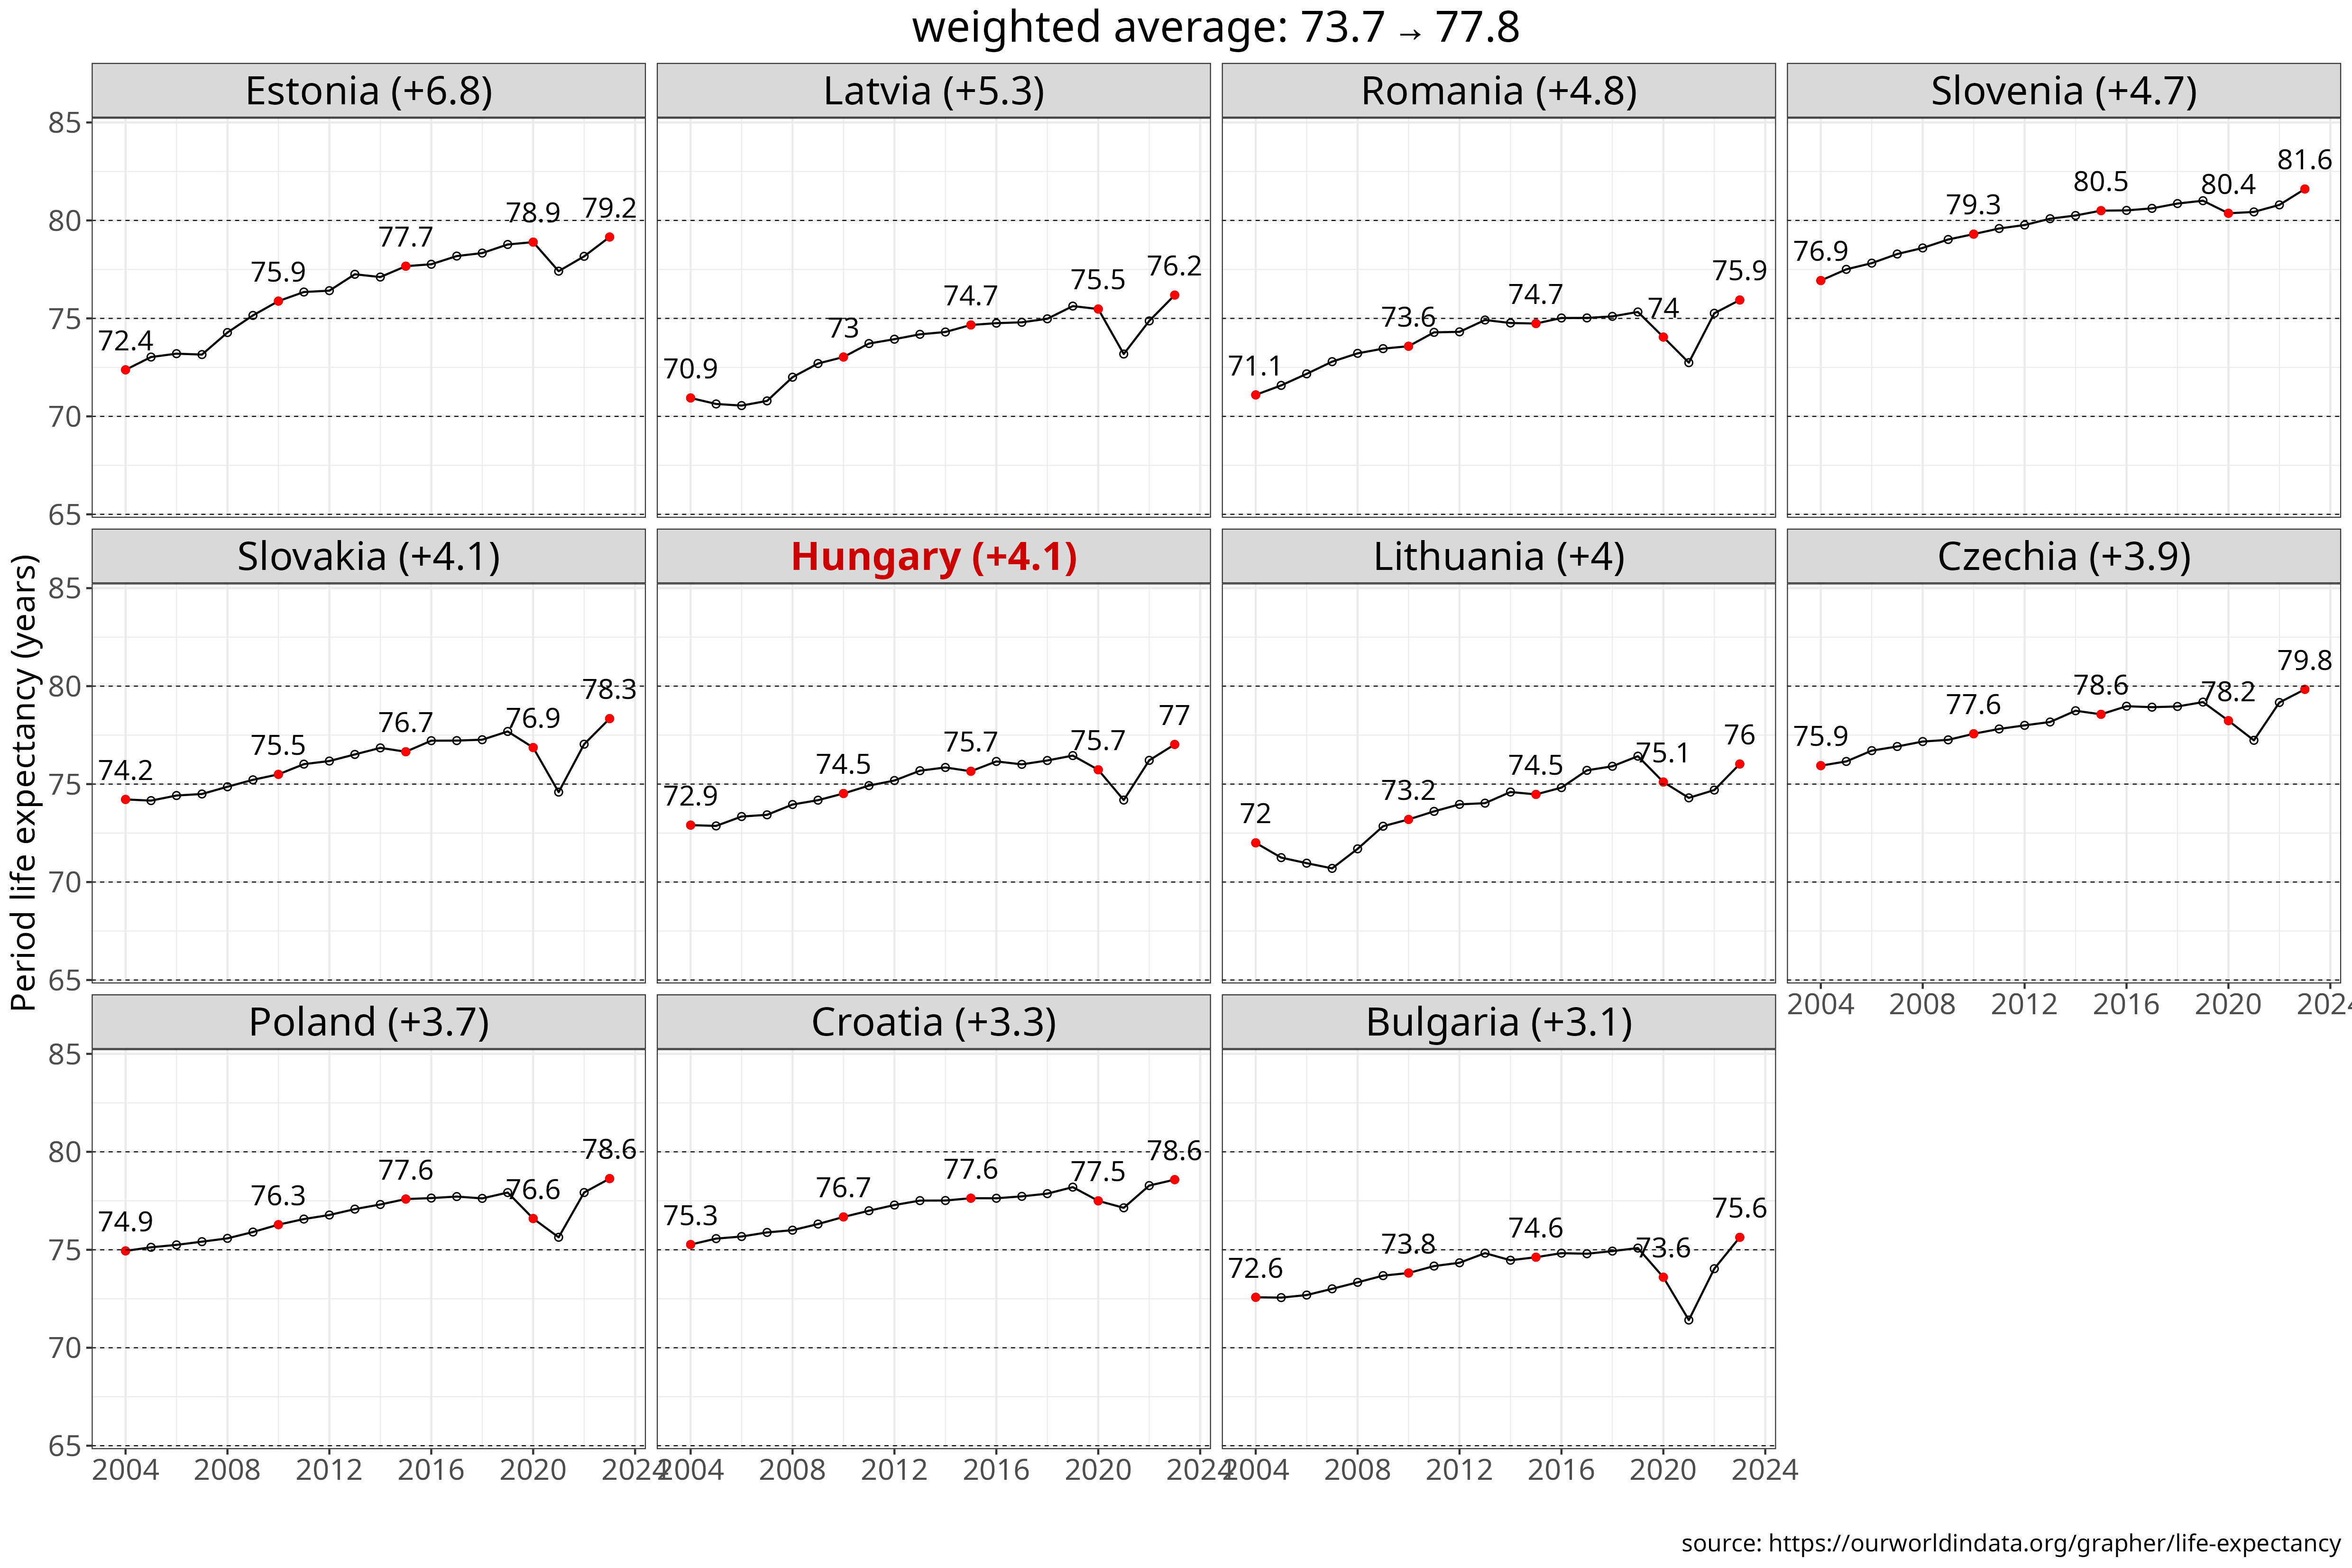
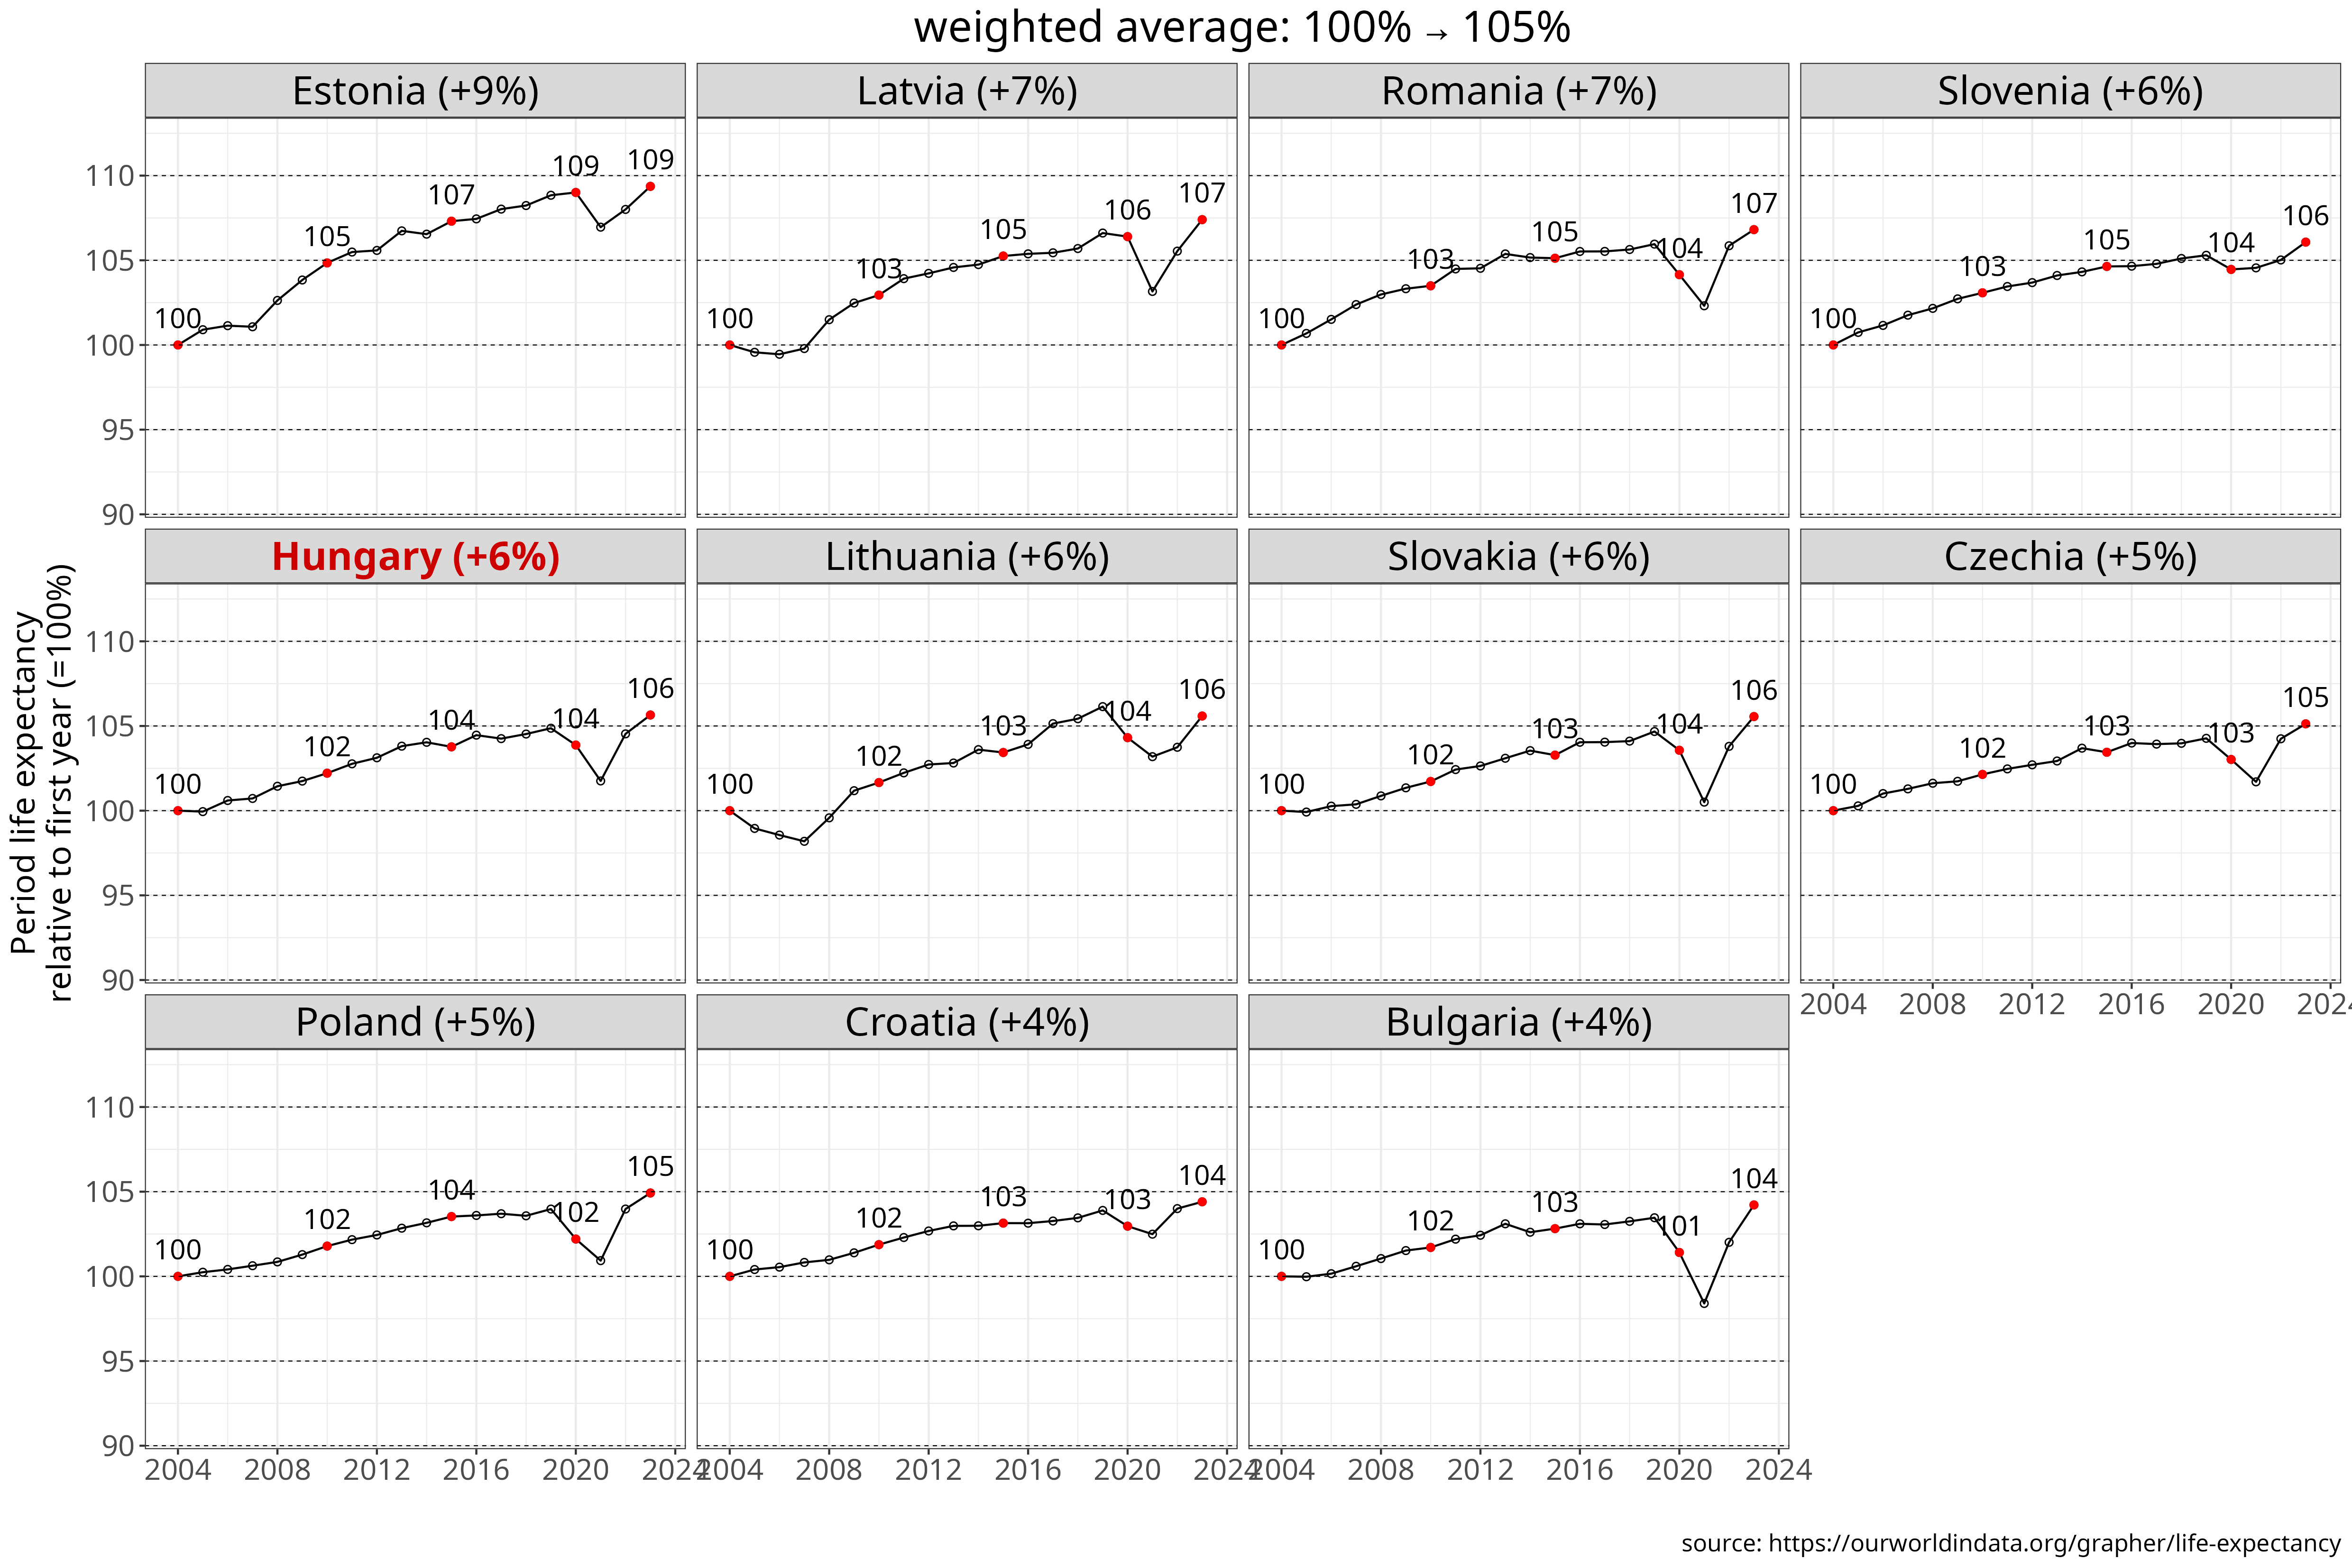
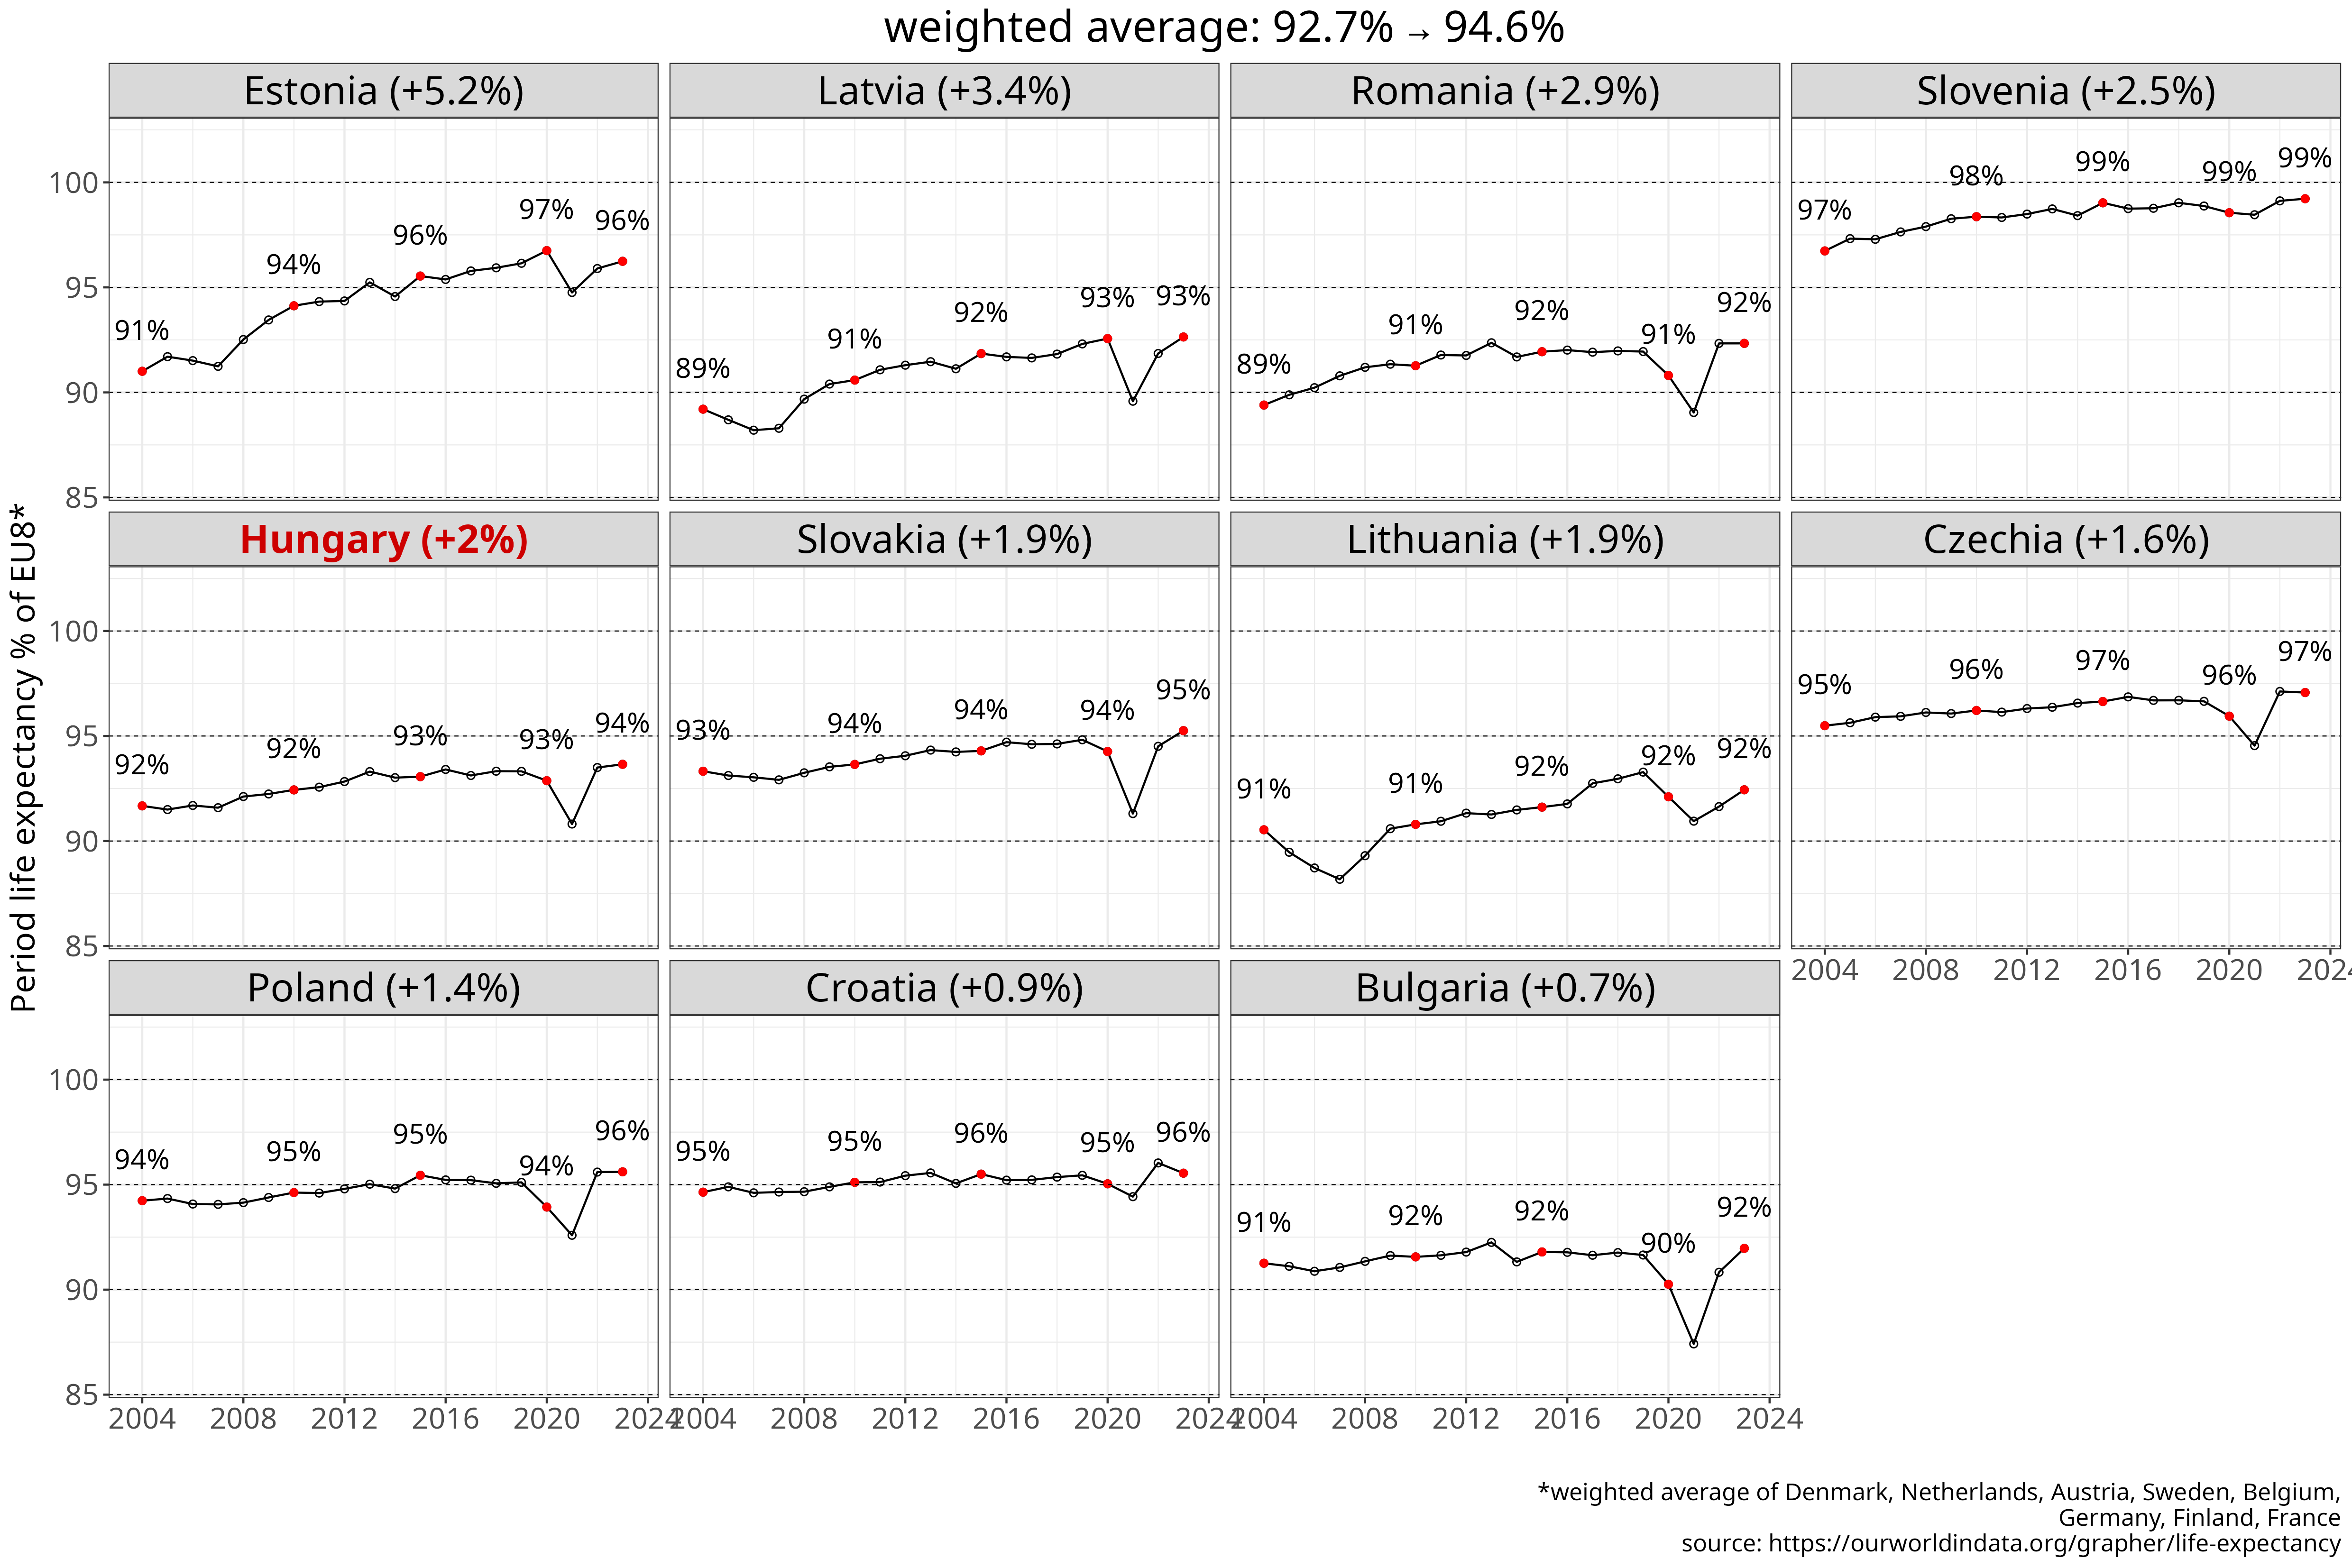
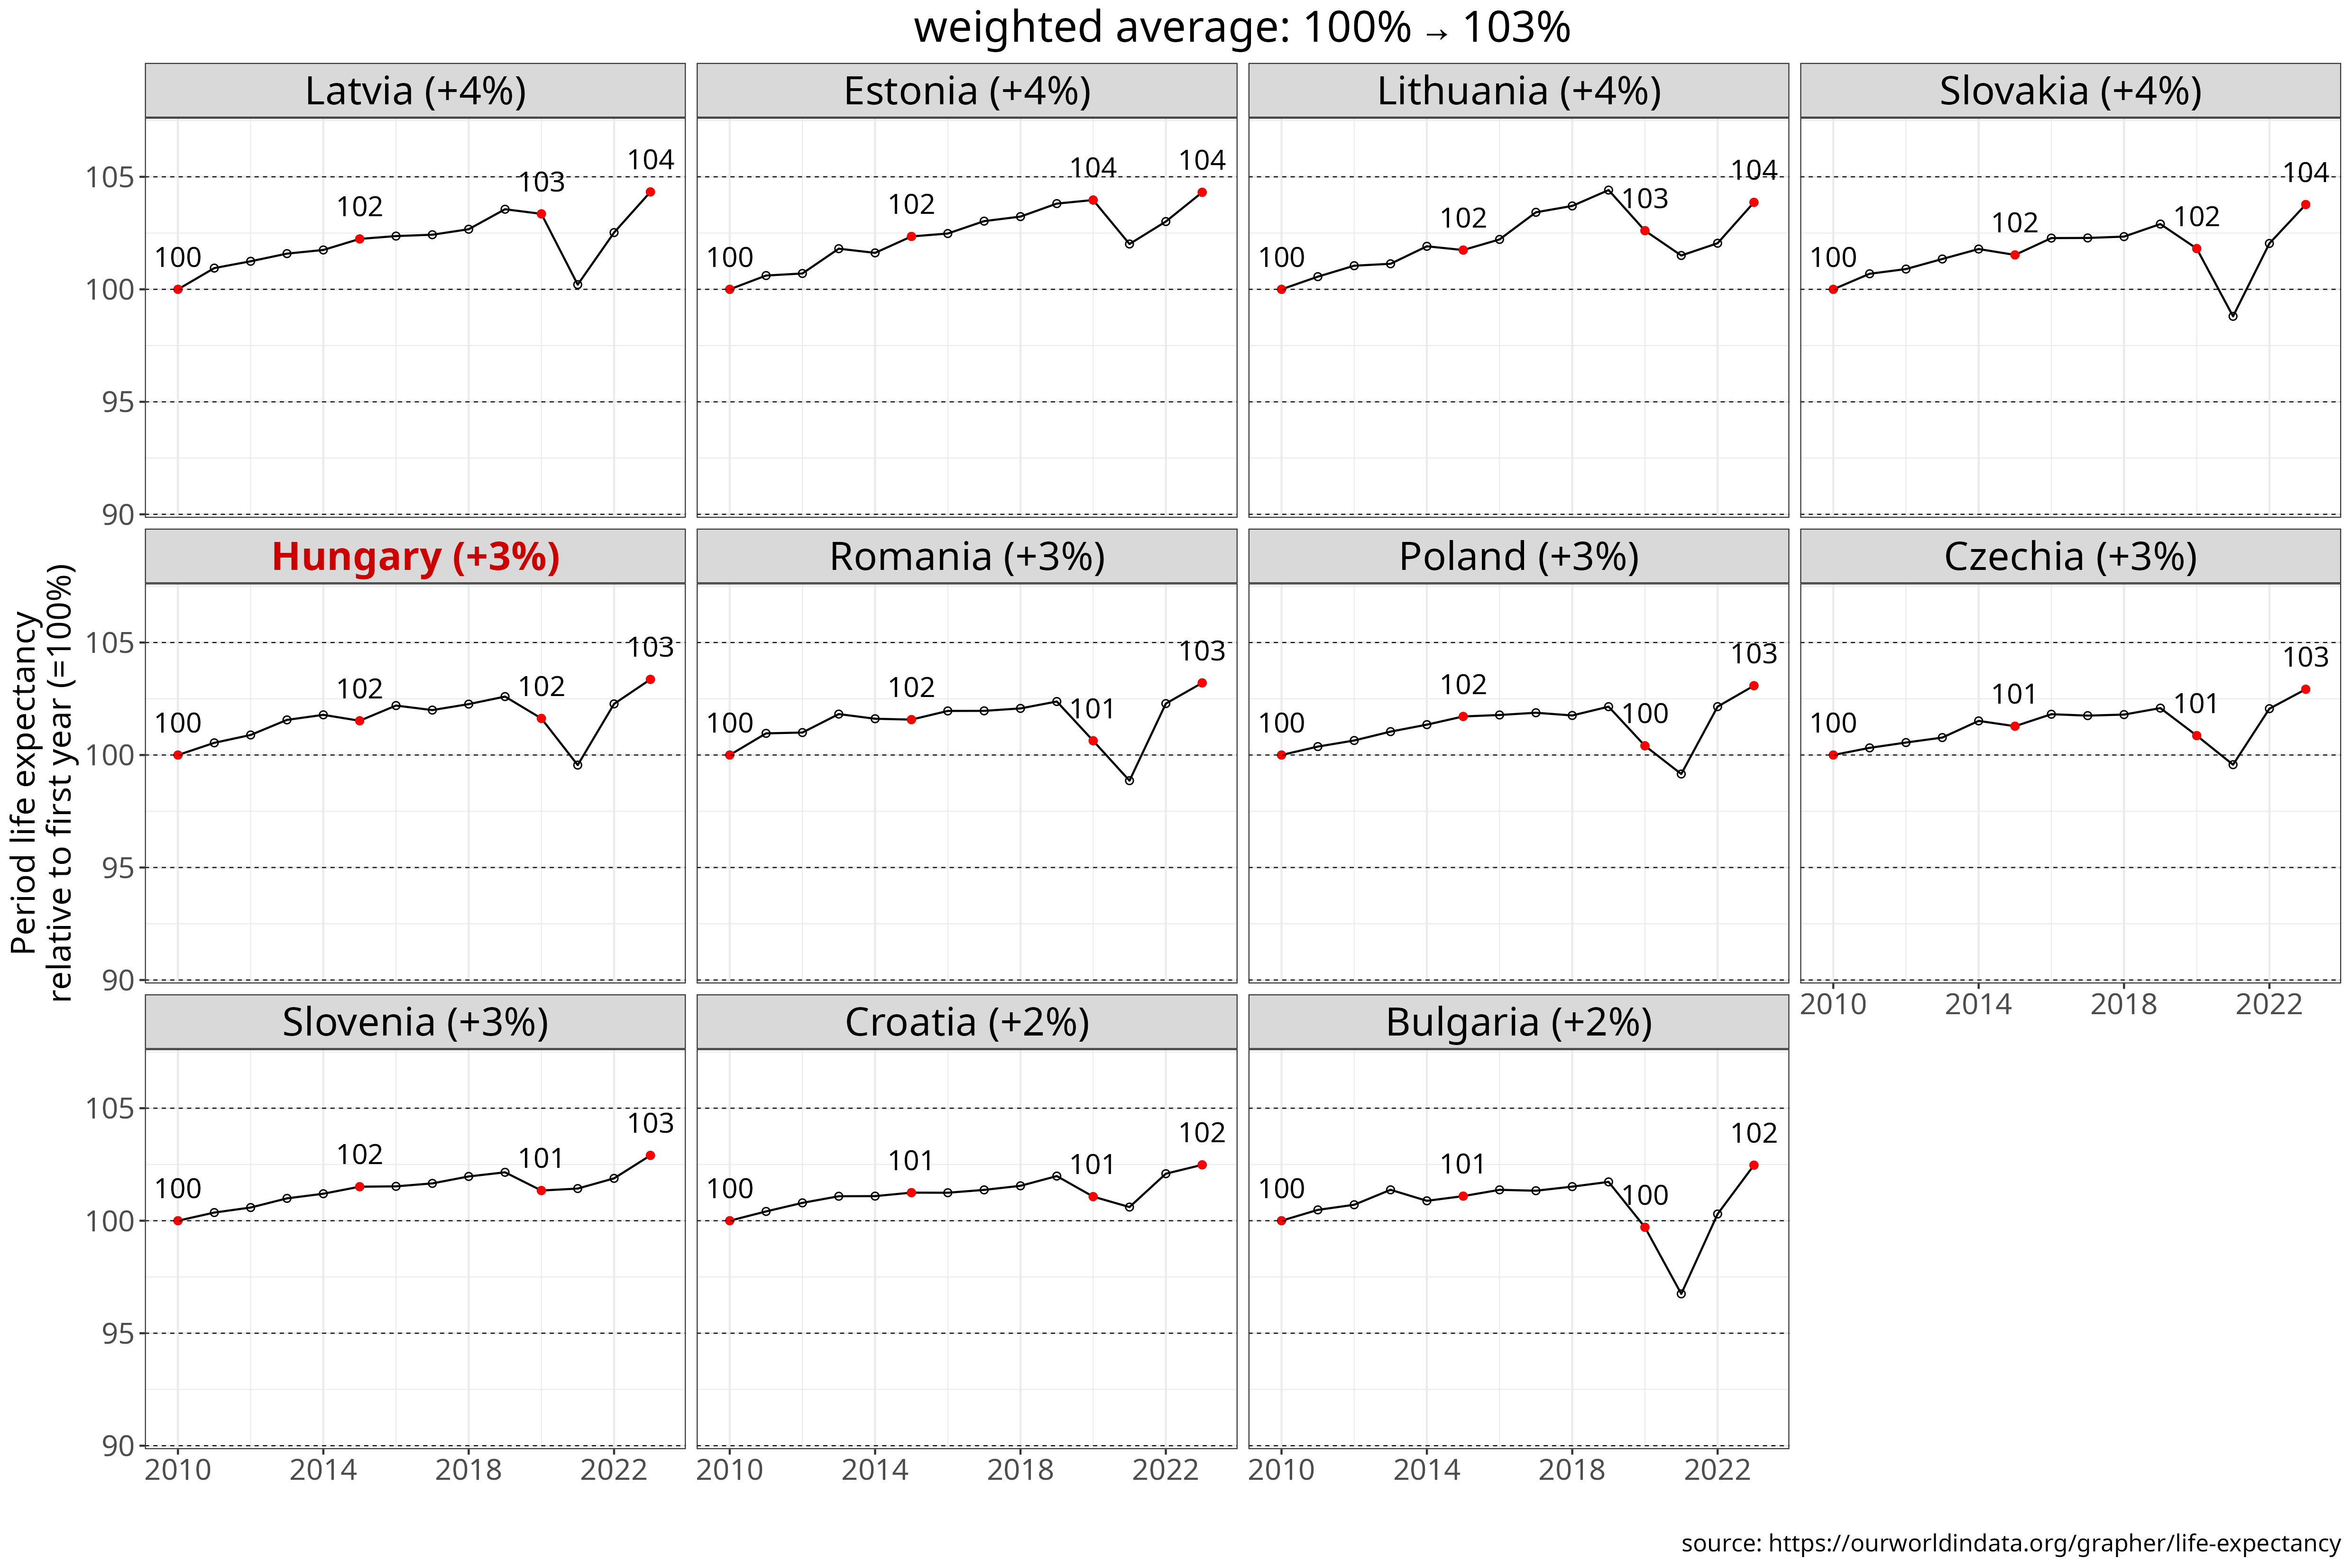
Figure 10 Life expectancy (years) since 2004. The chart shows levels (years), indexed values relative to 2004 and 2010, and percentages of the EU8 weighted average. Countries are ranked by cumulative growth from the selected base year through 2024. [download data] [source]
Life expectancy in Hungary has increased roughly in line with the CEE regional average, whether measured from 2004 or 2010. By 2022, it reached 77 years, just below the region’s weighted average.
| country | absolute value (years) | % of EU8 | relative to initial value (%) |
|---|---|---|---|
| Estonia | +6.8y (72.4→79.2) | +5.2% (91→96) | +9.4% |
| Latvia | +5.3y (70.9→76.2) | +3.4% (89→93) | +7.4% |
| Romania | +4.8y (71.1→75.9) | +2.9% (89→92) | +6.8% |
| Slovenia | +4.7y (76.9→81.6) | +2.5% (97→99) | +6.1% |
| Hungary | +4.1y (72.9→77) | +2% (92→94) | +5.6% |
| Slovakia | +4.1y (74.2→78.3) | +1.9% (93→95) | +5.6% |
| Lithuania | +4y (72→76) | +1.9% (91→92) | +5.6% |
| Czechia | +3.9y (75.9→79.8) | +1.6% (95→97) | +5.1% |
| Poland | +3.7y (74.9→78.6) | +1.4% (94→96) | +4.9% |
| Croatia | +3.3y (75.3→78.6) | +0.9% (95→96) | +4.4% |
| Bulgaria | +3.1y (72.6→75.6) | +0.71% (91→92) | +4.2% |
| country | absolute value (years) | % of EU8 | relative to initial value (%) |
|---|---|---|---|
| Estonia | +3.3y (75.9→79.2) | +2.1% (94→96) | +4.3% |
| Latvia | +3.2y (73→76.2) | +2.1% (91→93) | +4.3% |
| Lithuania | +2.8y (73.2→76) | +1.6% (91→92) | +3.9% |
| Slovakia | +2.8y (75.5→78.3) | +1.6% (94→95) | +3.8% |
| Hungary | +2.5y (74.5→77) | +1.2% (92→94) | +3.4% |
| Poland | +2.4y (76.3→78.6) | +0.99% (95→96) | +3.1% |
| Romania | +2.4y (73.6→75.9) | +1.1% (91→92) | +3.2% |
| Czechia | +2.3y (77.6→79.8) | +0.85% (96→97) | +2.9% |
| Slovenia | +2.3y (79.3→81.6) | +0.86% (98→99) | +2.9% |
| Croatia | +1.9y (76.7→78.6) | +0.44% (95→96) | +2.5% |
| Bulgaria | +1.8y (73.8→75.6) | +0.41% (92→92) | +2.5% |
Table 10: Cumulative change in life expectancy from 2004 or 2010 to 2024. Expressed in years, as % of the EU8 (weighted average), or relative to the initial value. Countries are ranked by the change in years.
Discussion
To provide an overview of the results, the table below summarises all indicators analysed.
Table 11 presents the findings in three complementary ways. First, it shows country rankings, calculated in two variants: one excluding Czechia and Slovenia - often outliers across multiple indicators - and one including all 11 CEE countries. Countries are ranked by their levels in 2004 (where available), 2010, and 2024, as well as by cumulative changes from 2004 or 2010 to 2024.
By clicking the “Values” button, rankings are replaced by the underlying indicator values (mostly expressed as percentages of the EU-8 average) for Hungary and the CEE regional average.
| variable | Rank by level at start | Rank by level in 2010 | Rank by level in last year | Rank by cumulative change since start |
Rank by cumulative change since 2010 |
|---|---|---|---|---|---|
| GDP per capita (% of EU8) |
2/9 | 4/9 | 5/9 | 8/9 | 7/9 |
| GNI per capita (% of EU8) [2004-2023] |
1/9 | 3/9 | 7/9 | 9/9 | 8/9 |
| GDP per hour worked (% of EU8) [2004-2023] |
2/9 | 2/9 | 7/9 | 9/9 | 8/9 |
| Average annual wage (% of EU8) |
2/6 | 5/6 | 6/6 | 6/6 | 5/6 |
| Median hourly earnings (% of EU8) [2006-2022] |
3/8 | 5/9 | 7/9 | 8/8 | 8/9 |
| Statutory minimum wage (% of EU8) [2007-2024] |
3/9 | 6/9 | 5/9 | 7/9 | 5/9 |
| Median equivalised net household income (% of EU8) |
1/8 | 5/9 | 9/9 | 8/8 | 8/9 |
| Actual individual consumption (% of EU8) |
1/9 | 4/9 | 9/9 | 9/9 | 8/9 |
| Employment-to- population ratio (% of 15+ population) |
4/9 | 9/9 | 3/9 | 3/9 | 1/9 |
| Life expectancy at birth (years) [2004-2023] |
4/9 | 5/9 | 5/9 | 4/9 | 5/9 |
| variable | Rank by level at start | Rank by level in 2010 | Rank by level in last year | Rank by cumulative change since start |
Rank by cumulative change since 2010 |
|---|---|---|---|---|---|
| GDP per capita (% of EU8) |
4/11 | 6/11 | 7/11 | 8/11 | 7/11 |
| GNI per capita (% of EU8) [2004-2023] |
3/11 | 5/11 | 9/11 | 10/11 | 8/11 |
| GDP per hour worked (% of EU8) [2004-2023] |
4/11 | 3/11 | 9/11 | 11/11 | 10/11 |
| Average annual wage (% of EU8) |
4/8 | 7/8 | 8/8 | 8/8 | 6/8 |
| Median hourly earnings (% of EU8) [2006-2022] |
5/10 | 7/11 | 9/11 | 8/10 | 9/11 |
| Statutory minimum wage (% of EU8) [2007-2024] |
5/11 | 8/11 | 6/11 | 8/11 | 5/11 |
| Median equivalised net household income (% of EU8) |
3/10 | 7/11 | 11/11 | 10/10 | 10/11 |
| Actual individual consumption (% of EU8) |
3/11 | 6/11 | 11/11 | 9/11 | 8/11 |
| Employment-to- population ratio (% of 15+ population) |
6/11 | 11/11 | 4/11 | 3/11 | 1/11 |
| Life expectancy at birth (years) [2004-2023] |
6/11 | 7/11 | 7/11 | 5/11 | 5/11 |
| variable | level at start | level in 2010 | level in last year | cumulative change since start |
cumulative change since 2010 |
|---|---|---|---|---|---|
| GDP per capita (% of EU8) |
HU: 52% CEE: 44.4% |
HU: 51% CEE: 51.6% |
HU: 67% CEE: 70.7% |
HU: 15% CEE: 26.3% |
HU: 15% CEE: 19.2% |
| GNI per capita (% of EU8) [2004-2023] |
HU: 51% CEE: 42.8% |
HU: 50% CEE: 49.7% |
HU: 60% CEE: 65.6% |
HU: 9.6% CEE: 22.8% |
HU: 10% CEE: 15.9% |
| GDP per hour worked (% of EU8) [2004-2023] |
HU: 46% CEE: 39.8% |
HU: 54% CEE: 46.9% |
HU: 52% CEE: 56.6% |
HU: 5.7% CEE: 16.9% |
HU: -1.8% CEE: 9.8% |
| Average annual wage (% of EU8) |
HU: 44% CEE: 31.4% |
HU: 43% CEE: 34.7% |
HU: 52% CEE: 44.5% |
HU: 8.3% CEE: 13.1% |
HU: 9.2% CEE: 9.8% |
| Median hourly earnings (% of EU8) [2006-2022] |
HU: 34% CEE: 32.3% |
HU: 41% CEE: 41.2% |
HU: 53% CEE: 60.7% |
HU: 19% CEE: 26.3% |
HU: 12% CEE: 19.5% |
| Statutory minimum wage (% of EU8) [2007-2024] |
HU: 30% CEE: 28.4% |
HU: 29% CEE: 33.9% |
HU: 52% CEE: 63.2% |
HU: 22% CEE: 34.8% |
HU: 23% CEE: 29.3% |
| Median equivalised net household income (% of EU8) |
HU: 39% CEE: 31.7% |
HU: 38% CEE: 38.8% |
HU: 45% CEE: 62.4% |
HU: 5.8% CEE: 28.1% |
HU: 7.4% CEE: 23.6% |
| Actual individual consumption (% of EU8) |
HU: 53% CEE: 45.5% |
HU: 52% CEE: 55.3% |
HU: 64% CEE: 73% |
HU: 11% CEE: 27.5% |
HU: 11% CEE: 17.7% |
| Employment-to- population ratio (% of 15+ population) |
HU: 49.2% CEE: 47.2% |
HU: 46.2% CEE: 49.3% |
HU: 57.8% CEE: 55.3% |
HU: 8.7% CEE: 8.1% |
HU: 11.6% CEE: 6% |
| Life expectancy at birth (years) [2004-2023] |
HU: 72.9y CEE: 73.7y |
HU: 74.5y CEE: 75.4y |
HU: 77y CEE: 77.8y |
HU: 4.1y CEE: 4.1y |
HU: 2.5y CEE: 2.4y |
Table 11: Summary of indicators for Hungary and the CEE average. Rankings are shown for a nine-country group excluding CZ and SI and for all eleven CEE countries. Values report the underlying indicators (mostly as % of the EU-8 average).
It is clear that in most indicators Hungary saw a relative decline within the region, going from the top two to four countries in the CEE9 group to the bottom 2 or 3 by 2024, with a few exceptions (employment, minimum wage and life expectancy).
To make the conclusions more straightforward, I calculate the median and mean rankings across all indicators in Table 12.
| metric | Mean rank (all) | Median rank (all) | Mean rank (no CZ/SI) | Median rank (no CZ/SI) |
|---|---|---|---|---|
| Rank by level at start (2004) | 4.4/11 | 4/11 | 2.3/9 | 2/9 |
| Rank by level in 2010 | 7/11 | 7/11 | 5.1/9 | 5/9 |
| Rank by level in last year (2024) | 8.3/11 | 9/11 | 6.6/9 | 7/9 |
| Rank by cumulative change since start (2004) | 8.4/11 | 9/11 | 7.4/9 | 9/9 |
| Rank by cumulative change since 2010 | 6.9/11 | 8/11 | 6.4/9 | 7.5/9 |
I would argue that the most informative summary measure is the median ranking within the CEE9, which excludes Czechia and Slovenia - countries that were already substantially more developed in 2004 (and even in 1990). Their smaller cumulative gains relative to the EU8 group average reflect an expected slowdown associated with higher initial income levels rather than a clear policy failure. At the same time, this pattern raises the question how realistic full convergence to the Western European core is for the CEE region as a whole.
For Hungary, Table 12 paints a clear and deeply negative picture of the past two decades. In 2004, Hungary still ranked fourth by the median of the indicators within the full 11-country CEE group. Excluding Czechia and Slovenia, it stood second in the narrower CEE9 group. The exact mean or median ranking is not the main point, since it depends on which variables are included. While the ten variables selected here are the most comprehensive economic indicators I could identify, the list could be expanded or narrowed, producing slightly different results. What is clear, however, is that across the broadest measures of convergence, Hungary’s performance over the past two decades ranks among the worst - whether it was the absolute worst, second, or third depends on the choice of indicators.
Using the 10 indicators discussed, by 2010 Hungary had already fallen three places in its median ranking (5/9 in the CEE9 group or 7/11 in CEE11). Between 2010 and 2024, it slipped a further two positions, ending up seventh out of nine in the CEE9 — or eighth to ninth in the full CEE11.
As a result, Hungary’s convergence performance ranks among the weakest in the region, whether measured from a 2004 or a 2010 baseline.From the 2004 baseline, Hungary has the worst median ranking in cumulative convergence within the CEE9. From the 2010 baseline, it ranks between the second- and third-worst (median ranking of 7.5/9), alongside Slovakia and Croatia, whose convergence has also been weak. Hungary avoids placing last since 2010 as well only because of the sharp rise in its employment ratio after 2010 and Slovakia’s similarly poor performance across most other indicators.
While the increase in Hungary’s employment ratio after 2010 was a welcome development, it was not unique. Similar gains occurred across nearly all CEE countries as part of a broader regional trend. Indeed, Hungary’s increase in employment since 2004 exactly matches the CEE average. This makes the argument that weak productivity and income growth reflect the absorption of previously underemployed workers and therefore weak or no productivity growth was unavoidable unconvincing. Several other countries managed to raise both employment and productivity over the same period.
In short, Hungary’s relative downward slide already started around 2004 and continued after 2010, under the Orban government. If we look at the curves above, we can also visually locate the two sub-periods when Hungary was more or less completely stagnant, while most of the region - with the exception of post-2010 Slovakia - continued to climb upwards. Hungary was stagnant in the main output variables in the 2006-2012 period and again from 2022 until today, although it seems for different reasons. While in 2006-2010 the employment ratio fell in absolute terms, output per hour of work was still on the way up until 2011. Since 2021 the employment ratio plataeud - which is expected as it already reached a high level - but labour productivity has been essentially stagnant too.
Since 2022 this led to stagnating GDP and GNI per capita, ie. total output, while - somewhat surprisingly - wages, incomes and consumption still kept slowly increasing, with minimum wages hiked. However, within the context of a stagnating national economy, these wage increases are unlikely to be sustainable.
Conclusion
This survey of macro-trends does not, in itself, provide a causal analysis. It does, however, allow us to assess the record of the past 16 years - an uninterrupted period of Orbán’s rule.
Across the economic indicators examined, the only area of clear success over this period was the rise in the employment ratio. This increase followed a broader regional trend and, by the end of the 2010s, reached Western European levels.
That achievement, however, was accompanied by an absolute decline in average labour productivity until 2016, followed by only weak productivity growth thereafter. Improvements in living standards were similarly limited: median wages, household incomes, and per-capita consumption showed the weakest convergence in the CEE region, with the sole exception of Slovakia, which underperformed even Hungary. While minimum wage increases in Hungary were around the regional average, rather than below average, this did not lead to a comparable convergence of actual wages, income or consumption.
This trajectory left Hungary as the second- or third-worst performer in the CEE region by 2024, despite entering the EU as one of the region’s frontrunners.
This does not mean Hungary stagnated in absolute terms over the past two decades - it did not. Rather, it is its convergence toward Western European levels of output and income that has been notably weak, compared with most of the CEE region.
The contrast is stark in the headline indicator of GNI per capita. Since 2004, Poland, Romania, and Latvia have roughly doubled their real GNI per capita, and since 2010 have increased it by around 60%. In Hungary, by comparison, real GNI per capita rose by only 40% since 2004 and 35% since 2010. Similar relative gaps are visible in wage, income, and consumption trends when Hungary is compared with the best-performing CEE economies.
While the reasons for this relative decline are complex, the fact that Hungary has been governed by the same administration for 16 years makes it reasonable to conclude that the current regime’s economic record has been a failure in comparative, regional terms.
The combination of near-stagnant output since 2022 and below average productivity, income and consumption growth throughout the 2010s is distinctive to Hungary (and to Slovakia) and increasingly divergent from broader regional trends. The post-2021 stagnation also does not appear to be explicable by the Ukraine war. It is only Estonia (and perhaps Czechia) that seems to have suffered a similar shock to output growth, while other countries in a similar geographic and geo-economic situation as Hungary - the other Visegrad countries, Romania, Croatia, Slovenia - has not experienced stagnation in the last four years.
It is important to note that the 2004-2010 period in Hungary was also unsuccessful, by several metrics even more so than 2010-2024, and contributed to this divergence. However, the 16 years since 2010 constitute a sufficiently long horizon for a government to identify structural problems in its macroeconomic strategy and to propose - if not fully implement - a change in direction.
Whatever the underlying causes of Hungary’s relative stagnation, the current government has consistently refused to acknowledge any shortcomings in its policy mix. Instead, it has doubled down on a strategy characterised by extreme centralisation, disproportionately large government subsidies to foreign (primarily manufacturing) investment, and an almost exclusive focus on physical infrastructure, especially motorways. This inability - and indeed aggressive rejection - of any admission of error, let alone correction, is perhaps the most troubling feature of the past 16 years.
Whatever the precise causal mechanisms, this policy mix has not delivered strong economic outcomes. On the contrary, it has resulted in the second or third worst economic performance in the entire region. The continued refusal to reconsider any element of this strategy, combined with explicit commitments to pursue it further, suggests that Hungary’s relative marginalisation within its historical region and the EU is likely to persist - at least in the absence of a change in political leadership.
hungary politics elections demographics data-visualisation magyar